Accepted for publication in Monthly Notices
Intergalactic Filaments as Isothermal Gas Cylinders
Abstract
Using a cosmological simulation at redshift 5, we find that the baryon-rich cores of intergalactic filaments extending outward from galaxies commonly form isothermal gas cylinders in regions favorable to their formation. The central gas density is typically about 500 times the cosmic mean total density, and the temperature is typically 1-2 times , just above the Lyman alpha cooling floor. These findings argue that the hydrodynamic properties of the gas are more important than the dark matter in determining this structure. It is noteworthy that the temperature and ionization state of the gas completely determine a finite total mass per unit length of an isothermal cylinder. Our findings may have implications for understanding the “cold mode” mechanism of gas transport into galaxies.
keywords:
cosmology: theory – intergalactic – filaments – sheets – baryons1 Introduction
The standard model of cosmology emphasizes the role of the gravitational field of the dark matter in structure formation. In this picture, the dark matter determines the overall geometry and rate of growth of structure.
While analyzing a cosmological simulation at redshift 5, we found that on scales of a few proper kiloparsecs intergalactic dark matter and baryons form qualitatively different structures (Harford et al., 2008). In contrast to the dark matter, which tends to occur in many small, quasi-spherical clumps, the baryons occur in a framework of thin, smooth rods that form backbones connecting the large, dark-matter dominated galaxies.
These gaseous filaments likely correspond to the filaments described by others that mediate the “cold mode” mechanism of gas transport into galaxies (Birnboim & Dekel, 2003; Binney, 2004; Katz et al., 2003; Kereš et al., 2005; Dekel & Birnboim, 2006; Ocvirk et al., 2008; Kereš et al., 2009; Dekel et al., 2009; Brooks et al., 2009). In contrast to the classical picture in which incoming gas is shock-heated to the virial temperature of the dark matter halo, gas accreted by this mechanism is never shock-heated, but rather moves directly to the center of the galaxy along relatively cool filaments. This mechanism predominates for haloes less massive than about (dark matter, gas, and stars combined). These haloes appear to be too small to sustain a shock (Birnboim & Dekel, 2003). If the filaments we have studied are indeed conduits for such accretion, then their structure might have ramifications for understanding how galaxies gain the gas necessary for the varied star formation histories that are observed.
We reasoned that these contrasting distributions of gas and dark matter result from hydrodynamic effects: pressure forces retard the gas as it moves toward the axis of a filament, in contrast to the dark matter which can pass freely through subject only to gravitational forces. The gas would be expected to accumulate along the axis of the filament until the pressure forces are sufficient to counteract the gravitational field. In this paper we explore the hypothesis that the gas in the baryonic core forms a self-gravitating, isothermal cylinder in hydrostatic equilibrium, whose structure is determined primarily by the gravitational and hydrodynamic properties of the gas.
Many different versions of an isothermal cylinder are possible with different degrees of concentration of the gas, but they all share the interesting property that the mass per unit length of the gas is finite and depends only on the temperature and ionization state (Stodólkiewicz, 1963; Ostriker, 1964). We suggest that our findings may place constraints upon models for the movement of gas along filaments.
The importance of hydrodynamic forces for the filament structure supports a hydrodynamic mechanism of origin from isothermal sheets as first proposed by Schmid-Burgk (1967).
The plan of the paper is as follows: Section 2 summarizes our previous work on intergalactic filaments, which provides the rationale for the present study. The important properties of the infinite, self-gravitating, isothermal cylinder are then presented, followed by the important features of our cosmological simulation. The results of our study are presented in Section 3. In Section 4 we first review the details of the simulation. Then the details of the procedures for selecting filaments, curve fitting, and the elimination of overlaps are presented. Finally, Section 5 summarizes our conclusions and discusses some broader implications.
2 Background and Rationale
In Paper I (Harford et al., 2008) we studied the distributions of dark matter and baryons in a detailed cosmological simulation run to a redshift of 5.1. At this redshift we found that the distributions of dark matter and baryons begin to diverge in an interesting way at a scale less than 40 kpc comoving. Dividing the simulation box into cubical grid cells of this dimension, we found that, among cells with a total overdensity of or greater, about 5% have a baryonic fraction exceeding twice the cosmic mean. These enriched cells, in contrast to their unenriched peers, form a network of long, thin filaments that connect the largest galaxies. We studied the filaments that issue from the ten largest galaxies in detail and found that, in addition to being baryon-rich, they extend outward in approximately straight lines from the centers of the galaxies. We decided to study the structure of these filaments in more detail.
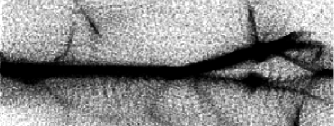
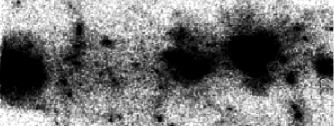
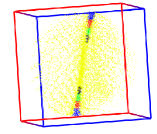
Our working hypothesis is that the filaments form self-gravitating, isothermal cylinders in hydrostatic equilibrium. This hypothesis is motivated by our finding that, for many of the filaments, the inner core, within four proper kpc of the filament axis, is predominately gas. Figure 1 shows the typical distributions of gas and dark matter about a filament. Each image shows actual simulation particles in a sub-box of the simulation. The top image shows just the gas particles, while the bottom image shows just the dark matter particles. Clearly the gas and dark matter have very different structures.
Since our maximum halo mass (dark matter, gas, and stars combined) is , shocks are generally not expected to form. Consistent with this expectation, the gas bounding the filaments has a temperature of only a few times .
The infinite, self-gravitating, isothermal gas cylinder in hydrodynamical equilibrium has been described mathematically by Stodólkiewicz (1963) and Ostriker (1964). The density profile is given by
| (1) |
where is the central density along the axis of the cylinder and
| (2) |
where is the radial distance and the scale radius
| (3) |
In this expression is the isothermal speed of sound and is the gravitational constant. The speed of sound depends only upon the temperature and the mean molecular weight
| (4) |
where is the Boltzmann constant and the mass of the hydrogen atom.
The total mass per unit length of an isothermal cylinder, obtained by integrating equation (1), is finite and given by
| (5) |
where is the isothermal sound speed and is the gravitational constant. This result agrees with the virial theorem for an infinite cylinder derived by Chandrasekhar & Fermi (1953).
Because of the limited number of simulation particles, it is convenient to work with the gravitational potential produced by the distribution of the gas rather than with the density profile itself. Dividing the potential by gives a dimensionless variable which takes the simple form
| (6) |
for the isothermal cylinder.
In this paper we will use the term isothermal-like to refer to a distribution of gas whose potential satisfies equation (6) for some sound speed. If the sound speed is equal to the actual sound speed of the gas (within a factor of two), the distribution will also be called isothermal. A gas distribution inconsistent with (6) will be termed non-isothermal.
Filaments in a cosmological simulation are of course messier than this idealization. They may be bent, truncated, or disturbed in various ways by galaxies, small dark matter haloes, or other filaments. Thus at best it can be shown only that relatively undisturbed filaments emanating from galaxies are commonly reasonably well approximated as isothermal cylinders. Despite this limitation, such a finding would be interesting because it would suggest that the dynamics of filaments at scales of a few kpc at redshift 5 is dominated by gaseous processes rather than by the gravity of dark matter.
In anticipation of considerable variability, we expanded our study to include the filaments around the 200 largest haloes in our comoving simulation box. These haloes range in total mass (gas, dark matter, and stars) from to , in the mass range for shockless cold mode accretion. The mass of a halo is defined as the mass gravitationally bound to it as opposed to the mass within the virial radius. The differences are not large.
We used the same simulation at the same redshift as in Paper I. A feature that distinguishes this simulation from many others in the literature is that the ionizing radiation is generated directly from the simulated star formation rather than added as a uniform background. Detailed chemistry and radiative transfer computations are included. Resultant luminosity functions are reasonable (Harford & Gnedin, 2003, 2007). Although the history of reionization remains controversial, the process within the simulation is at least consistent with the spectra of high-redshift quasars (Gnedin & Fan, 2006). The importance of the latter is underscored by the finding that the Jeans length changes by more than an order of magnitude over the course of reionization (see Gnedin et al. 2003 and references therein).
In what follows, all distances are proper unless specified otherwise. All histograms are shown with the plotted point at the center of the bin.
3 Results
This section presents the basic results of our study. Details of filament selection and methodology are deferred to Section 4.
To study a large number of galaxies, we devised an efficient, objective way to identify filaments. In Paper I we found that the baryon-rich filaments extend from the centers of the galaxies in a predominantly radial direction, consistent with their being conduits for gas accretion onto galaxies. From this perspective, we take as our defining feature of a filament a long, straight rod of gas protruding from the center of a galaxy. To implement this definition we used the HealPix (Górski et al., 2005) partition of the volume of a sphere centered on each galaxy. This method divides the region completely into volume elements of equal solid angle issuing from the center. We reasoned that the volume elements containing the most gas probably represent directions of filaments.
To allow for the possibility that the filament structure might vary along its length, we divided filaments into segments 7.24 kpc long for individual analysis. Each angular volume element is divided into four radial parts corresponding to four spherical shells bracketed by five spheres at radii of 3, 4, 5, 6, and 7 radial units (7.24 kpc) from the center of the galaxy. The spherical shell in which a segment resides will be termed its parent shell, and its total overdensity will largely determine its ability to host an isothermal structure.
The minimum distance from the galaxy center is thus 22 kpc, outside the virial radius of all but a few of the larger galaxies. The virial radii 111The virial radius was taken to be the radius enclosing an average total overdensity of 200 times the cosmic mean and was computed directly from the simulation. The total overdensity includes gas, dark matter, and stars. range from 28 kpc for the largest galaxy down to 6 kpc. Details of the selection and analysis of filament segments are given in Section 4.2.
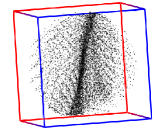
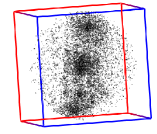
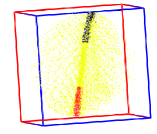
An illustrative example is shown in Figure 2. Each of the four images represents the same spherical volume of radius 51 kpc centered on one galaxy. The top left image shows only the gas particles in this region, while the top right shows only the dark matter particles. The two gas filaments issuing from the center of the galaxy are well delineated. This example exemplifies our working hypothesis that the gas has a distinctive structure unlike that of the dark matter. The bottom left image shows gas particles in the individual filament segments that we analyzed, colored in order moving outward black, green, red, and blue. The remaining gas particles are shown in yellow to provide contrast. The bottom right image shows in black the segments extending upward, which were deemed to be isothermal, while the red ones extending downward were not.
The segments belong to a small number of major strings of galaxies, resembling the filaments formed by the baryon-rich grid cells in Paper I.
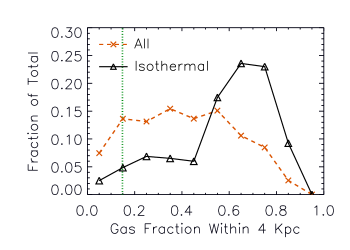
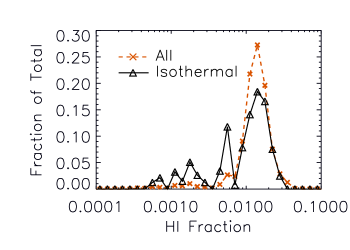
Figure 3 shows that the cores of the majority of the segments are enriched in gas above the cosmic mean, consistent with the findings of Paper I. The subset of segments that we find to be isothermal is even more gas-rich. In the present paper we use the gas fraction rather than the baryonic fraction (gas and stars) used in Paper I. This convention was chosen because the stellar particles in the simulation, like the dark matter ones, are treated as collisionless, in constrast to the hydrodynamic treatment of the gas. The contribution of stars to the baryonic fraction is generally small.
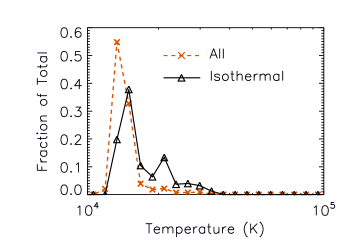
The segments have average temperatures of about 12000 to 14000 K, just above the Lyman alpha cooling floor (Figure 4) and neutral hydrogen fractions of about 0.01 to 0.02 (Figure 5).
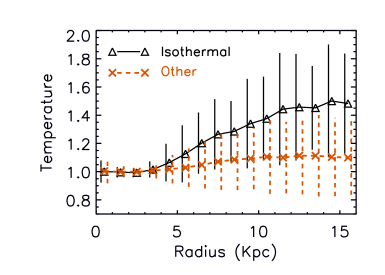
The extended temperature profiles shown in Figure 6 show that the segments are bounded mostly by low temperature regions. For the isothermal segments the temperature increase in the outer regions is small, not suggestive of strong shocks or high pressure confinement of these filaments by high temperature gas. The remaining segments that are not isothermal show essentially no change in temperature. Thus it seems unlikely that they fail to be isothermal because of shocks or ram pressure from the surrounding gas.
The structure of each segment was determined from the cylindrical, radial profile of the gravitational potential produced by the distribution of its gas. Section 2 described the basic properties of a self-gravitating, isothermal cylinder. Details of the computation and the fitting of the potential profiles to an isothermal one are given in Sections 4.3 and 4.4.
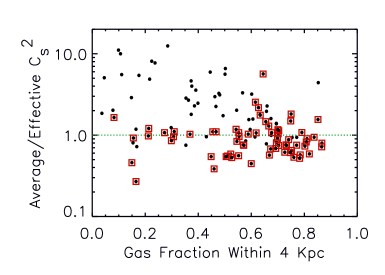
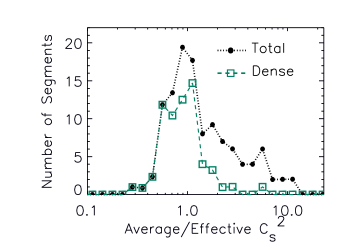
From an isothermal potential profile, an effective sound speed can be computed. This is the sound speed that the gas would have if its pressure balanced its gravitational field. The effective sound speed is then compared to the actual sound speed averaged within 4 kpc of the cylinder axis. Figure 7 shows a histogram of the square of the ratio of the actual sound speed to the effective one for the isothermal-like segments, that is, those that satisfy equation (6) for some effective sound speed. There is a pronounced peak at a ratio of one. The segments whose ratio is within a factor of two of one will be considered isothermal.
. Criterion Total Isothermal Isothermal/Total None 540 80 0.15 (0.32) Density 136 57 0.42 (0.52) Density and Gas Fraction 86 44 0.52 (0.63)
The mass per unit length of an isothermal cylinder depends only upon the temperature and average molecular weight of the gas. For a typical segment with a temperature of 1-2 times , this mass is about of gas per shell. Typically a large galaxy is surrounded by two to three filaments. The parent shell of a segment would then need a minimum of about of total gas to accomodate 2.5 isothermal cylinders. Not all of the parent shells even have this much gas.
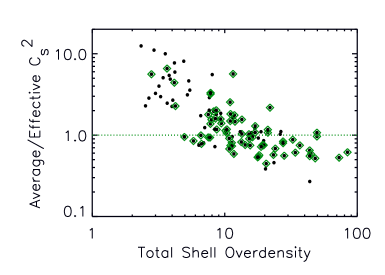
The scatter plot in Figure 8 compares the sound speed ratio to the total cosmic overdensity of the parent shell. All of the points represent isothermal-like segments. As the shell overdensity falls below ten the sound speed ratio rises indicating that there is too little gas to balance the ambient pressure.
Figure 7 shows that this density effect accounts for most of the the failure of isothermal-like segments to be isothermal. The dashed, blue line with squares shows the sound speed ratio distribution for segments whose parent shells have a total cosmic overdensity of at least ten.
Another factor that might be important is the gas fraction of the segment. Dark matter might increase the gravitational field enough to accomodate a higher temperature, or it might disrupt the isothermal structure altogether. Figure 9 shows the ratio of the square of the sound speeds of the isothermal-like segments as a function of gas fraction. This figure shows that higher gas fractions are more conducive to isothermal cylinders.
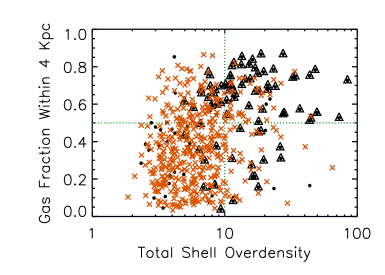
Figure 10 combines the two criteria of overdensity and gas fraction. The upper right quadrant of the figure contains those segments that have both a parent shell of overdensity greater than ten and a segment gas fraction greater than one half. In this quadrant, 44 of the 86 segments are isothermal. The statistics from this graph are summarized in Table 1. The isothermal segments are among the most massive filaments we have identified and thus would be expected to be avenues of transport for a disproportionately large fraction of the gas. With this in mind, Table 1 shows the fractions by gas mass in parentheses.
Despite our efforts to qualify segments, isothermal cylinders might still fail to be identified for a variety of reasons. In additon to misalignment and extraneous structures nearby, some of the segments might have a scale radius too small or too large to be modeled in our study. With these considerations in mind, we conclude that isothermal cylinders are at least common among filament segments residing in regions conducive to the formation of these structures.
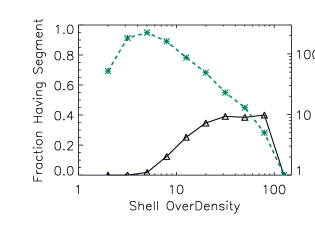
Figure 11 shows that among the densest shells, those with an overdensity greater than twenty, about 40% have at least one isothermal segment.
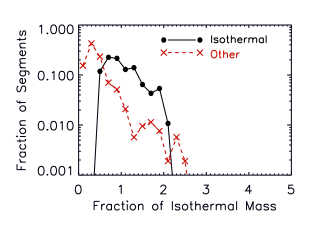
The mass per unit length of an isothermal cylinder is finite and completely determined by the temperature and ionization state of the gas (Stodólkiewicz, 1963; Ostriker, 1964). Excess gas is expected to disrupt an isothermal cylinder (Inutsuka & Miyama, 1992). The isothermal segments in our simulation are among the most massive and gas-rich of the simulation The segments that fail to be isothermal generally have too little gas to be isothermal, as shown in Figure 12. Thus in our simulation, at least, the amount of gas per unit length appears to be limited to the amount compatible with an isothermal cylinder. 222Although the total mass per unit length is finite, the radial profile extends to infinity. The profile will thus be truncated at some radial distance, perhaps by shocks or ram pressure, thus limiting the linear density of gas in an isothermal structure to a lesser value. Our potential profile fitting extends to 4.25 scale radii, a distance enclosing 69% of the total mass. The correction is thus modest. However, the high resolution and consequently modest box size ( comoving) of our simulation limits the mass of galaxies that can be modeled. Filaments associated with larger galaxies, particularly those surrounded by hot halo gas (Dekel et al., 2009; Kereš & Hernquist, 2009; Faucher-Giguere et al., 2011), may have different structures from those in our study. Our findings do not apply to the spherically symmetric “hot mode” accretion that becomes increasingly important for larger galaxies at lower redshifts (Birnboim & Dekel, 2003; Katz et al., 2003; Kereš et al., 2005; Dekel & Birnboim, 2006; Ocvirk et al., 2008; Kereš et al., 2009; Dekel et al., 2009; Brooks et al., 2009).
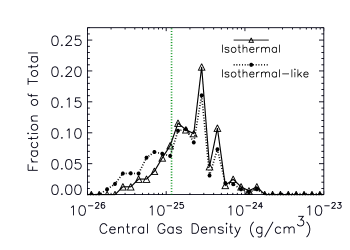
From the isothermal potential profile we can determine the central gas density, a useful value that is difficult to compute directly from the gas particles of the simulation. Figure 13 shows that the isothermal segments have central densities equal to about 500 times the mean overall cosmic density, above the value of 200 normally considered indicative of spherically symmetric virialization and well above the corresponding value of about 80 for cylindrical symmetry (Fillmore & Goldreich, 1984). For comparison, the average density of gas enclosed within a radius that contains half the total gas is reduced from the central one by only a factor of four. Many of the segments to the left of the green line, denoting an overdensity of 200, are isothermal-like segments with too little gas to be isothermal.
This result suggests that dark matter is not needed to maintain the isosthermal structure in the presence of the Hubble expansion. This finding, coupled with the high gas fractions, argues that the structure of these segments is primarily determined by the hydrodynamic properties of the gas rather than by the dark matter.
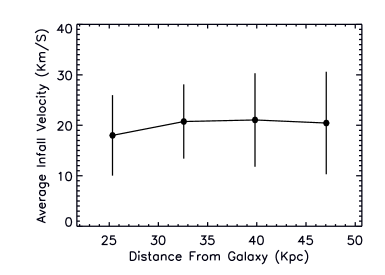
The filaments appear to extend nearly to the centers of the galaxies. On average the gas is falling into the galaxies along the filaments (Figure 14). However, the velocity dispersion is large, and there is no clear relation to the masses of the galaxies. The nature of the simulation does not allow one to trace the history of individual gas particles, and the peculiar velocities of the particles include that of significant bulk motion of larger regions, which must be subtracted out. Consequently, a more detailed analysis of gas transport has not been pursued. Accretion of filament gas onto galaxies has been shown directly by others however (Kereš et al., 2005; Brooks et al., 2009; Dekel et al., 2009).
4 Methods
4.1 Review of Simulation
The simulation from which the filaments are drawn is the same as that in Paper I, and has been previously described there. It utilizes a “Softened Lagrangian Hydrodynamics” (SLH-P3M) code (Gnedin, 1995; Gnedin & Bertschinger, 1996) with a flat CDM cosmology. The cosmological parameters are , , , and . The simulation is developed following the gas dynamics on a quasi-Lagrangian mesh, which deforms adaptively to provide higher resolution in higher density regions. As in Paper I we concentrate on a snapshot of the simulation at a redshift of 5.135. The softening length was 0.08 proper kpc at this redshift. Each dimension of the simulation box is comoving and contains 256 cells. The dark matter particle mass is , and the fiducial mass of a gas particle is . Gas particle masses are adjusted during the simulation by a factor of a few. Galaxies were identified with DENMAX (Bertschinger & Gelb, 1991).
4.2 Finding Filaments
To implement our filament definition described at the beginning of section 3 we used the HealPix333We gratefully acknowledge the use of the HealPix software package obtained from http://healpix.jpl.nasa.gov. partition of the volume of a sphere (Górski et al., 2005) centered on each of 200 galaxies. A subdivison (nside = 8) into 768 volume elements, called pixels, proved ideal.
Each angular pixel is divided into four radial subpixels corresponding to four spherical shells bracketed by five spheres at radii of 3, 4, 5, 6, and 7 radial units (7.24 kpc) from the center of the galaxy. The spherical shell in which a segment resides will be termed its parent shell.
For our study we selected as possible segments of filaments those subpixels having at least 30 times the average amount of gas per subpixel in the parent shell. Neighboring subpixels are consolidated into a single peak segment.
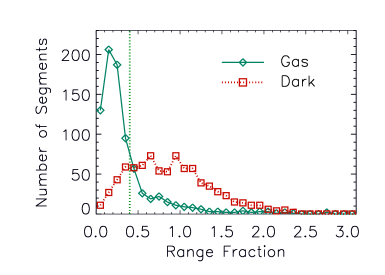
We then require that the gas be uniformly distributed along the axis of the segment in order to eliminate galaxies, grossly misaligned filaments, and other miscellaneous oddities. For this test, the segment is divided longitudinally into three parts, and the total gas mass within four kpc of the axis is computed for each. A range fraction is obtained by dividing the maximum difference between any two parts by the average of the three parts. We consider the distribution uniform if the range fraction does not exceed 0.4.
The 618 segments that meet both tests constitute the candidate segments to be examined for isothermal structure. They extend from 178 of the 200 galaxies analyzed.
The method, though crude, quickly identifies filamentous structures. Visual inspection shows the segments lined up into filaments of up to four segments. On a larger scale the filaments merge to connect many galaxies in a filamentary network.
A corresponding range fraction was computed for the dark matter in these candidate segments. Figure 15 shows that the gas and dark matter are distributed very differently by this criterion.
Our method for identifying filaments has the disadvantage that it requires that the filament issue from the center of the galaxy in a straight line. However, visual inspection of the simulation suggests that most of the filaments near galaxies do meet this requirement. Our method has the advantage of being easy to implement on the small scale of our structures.
Several more general methods to find filaments have been developed by others for the analysis of the large scale structure of the universe. Methods based upon Minkowski functionals (Sahni et al., 1998; Schmalzing et al., 1999) are promising for our purposes although they are more difficult to implement. Others based upon the analysis of first and second derivatives of the density (Sousbie et al., 2008; Bond et al., 2010) or the analysis of orbits of test particles (Hahn et al., 2007) are not practical for the small scale of our structures.
4.3 Computing the Gas Potential
The gravitational potential generated by the gas of a segment is computed on a 200 x 200 plane grid with a spacing of 0.17 kpc, perpendicular to the segment at its center. The potential is a sum over the contributions of all gas particles within 7 kpc of the cylindrical axis. Using a preliminary computation, this axis is adjusted to the common center of the largest contours, which are nearly concentric circles.

The 7 kpc maximal radius for the gas was chosen from experience, coupled with our findings in Paper I. A softening length of 0.1 kpc is added in quadrature to each contribution. In order to compare the potential of the finite segment to the simple form for an infinite cylinder, the gas particle distribution is replicated ten times in each direction along the axis, and the potential contributions of these additional particles added in.
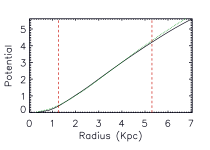
Fifty equally spaced contours on the full grid are computed using the IDL Software (Research Systems). Example potential contours are shown in Figure 16.
4.4 Fitting to an Isothermal Potential
The result is a set of contours for a nearly cylindrically symmetric potential well. The average radius of each contour about its own center is used to construct a radial potential profile. As will be shown, the contour centers very nearly coincide.
The zero point for the potential of an isothermal cylinder is defined to be the potential on the cylinder axis (Ostriker, 1964). We take as our estimate of this value the value at the most extreme grid point within the innermost contour.
An isothermal potential profile is completely characterized by two parameters, the scale radius and the sound speed. We determined the scale radius for which the profile is the best fit up to a constant of proportionality. The constant for the best fit is then the square of an “effective” sound speed (see Section 2).
The test region for each trial is a cylindrical shell between one and 4.25 scale radii. This region contains the characteristic inflection point of the potential curve at the square root of eight times the scale radius, a radius enclosing half the total mass of an isothermal cylinder. The central region where small irregularites have a large effect on the profile is thus omitted from the fitting procedure.
For each of a range of scale radii the standard deviation of the mean of the proportionality constant throughout the fitting region is determined. The scale radius for which the ratio of this standard deviation to the constant of proportionality itself is a minimum is taken as the best fitting scale radius. We require the minimum ratio to be less than 0.01 because we find empirically that these fits narrowly prescribe the optimal scale radius. Figure 17, center panel, shows an example of the determination of the optimal scale radius. Fits this good usually show the inflection point well.
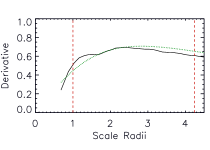
Segments that fit this well are then further tested by computing the fractional standard deviation of the fit to the derivative. Here, a cutoff of 0.1 was used. This test eliminates some pathological cases, often involving very small scale radii and thus very small fitting regions. Examples of well-fitting profiles of the potential and its derivative are shown in Figure 17, left and right panels respectively.
As a further test of the fit, the total mass within four scale radii was compared to prediction. The computed mass is invariably smaller than predicted presumably because the centering varies slightly along the axis of the cylinder. Only when all centers coincide would the mass be expected to be 100% that of prediction. We require that the actual mass be at least 70% of prediction. The segments failing this test generally have very small scale radii and thus a small spatial region for the fitting.

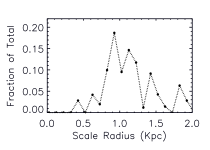
Those segments meeting all of these requirements are considered to be isothermal-like, that is, they have an isothermal profile for some effective temperature. The number of equally spaced contours in the fitting region for the best fit ranges from about 20 to 35. Figure 18, left panel, shows a histogram of their scale radii. Most are between 0.8 and 1.5 kpc. The low end may be underrepresented because of the small volume of the resultant fitting region. The high end may be underrepresented because the fitting region is slightly truncated in those few cases where it would otherwise extend beyond 7 kpc.
The resolution of the simulation is limited by the discrete number of gas particles. It ranges from about 0.5 kpc at the center of the filament to about 1 kpc at the furthest edge of the fitting region. The total number of gas particles used to fit a segment profile ranged from about a hundred to a thousand.
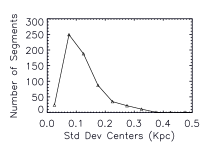
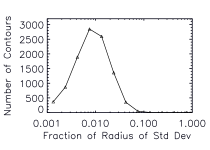
For cylindrical symmetry, the centers of the closed contours should coincide. For the fitted region of each segment the standard deviation of the contour centers about the mean of these centers was computed. Figure 18, center panel, shows a histogram of these standard deviations for all of the segments fitting the isothermal curve and its derivative for some effective temperature. Also for straight cylinders the contours should be nearly circular. Figure 18, right panel, shows a histogram of the fractional standard deviations of the mean radius for these contours.
4.5 Eliminating Overlaps
The fit allows one to compute for each segment an effective sound speed. This is the sound speed that an isothermal cylinder with this spatial distribution of gas would have. This sound speed is then compared to the actual one in order to identify the isothermal segments. We designate as isothermal those segments with ratios within a factor of two of 1.0. Out of a total of 618 candidates 87 are isothermal.
To make a more accurate assessment we eliminate overlaps. Overlapping can occur because a given gas particle can be part of a segment issuing from more than one galaxy. Because of possible misalignments with the radial directions from the centers of the galaxies in question, the quality of the fitting of a region may differ depending upon which galaxy it is considered to have emanated from. For each segment, then, we determine what fraction of the gas particles are not held in common with other segments with better fits. For this procedure, the measure of fit was taken as the absolute value of the deviation from one of the ratio of the square of the actual and effective sound speeds.
The segments, weighted by their non-overlapping fractions, are added together to form the histograms in Figures 3, 4, 5, 13, 7, and Table 1. In the scatter plots only segments whose non-overlapping fractions exceed one half are included.
After the elimination of overlaps, the 618 candidates are reduced to the equivalent of 540 non-overlapping segments, of which 117 are isothermal-like. Among the isothermal-like the equivalent of 80 are isothermal.
5 Conclusions and Discussion
From a comological hydrodynamic simulation at redshift 5, we find that a plausible model for intergalactic filaments is an isothermal gas cylinder whose structure and stability are determined primarily by the gravitational and hydrodynamic properties of the gas. The cylinders have a central gas density of several hundred times the mean total cosmic density, with a peak at about 500. The average temperature of the gas in the cylinders is 1-2 times . The neutral hydrogen fraction is generally between 0.01 and 0.02.
The box size of comoving limits the findings to haloes less than in total mass (gas, dark matter, and stars).
Our findings fit well into the emerging picture of gas transport into galaxies. Except for haloes larger than a few times at low redshifts, gas is believed to enter galaxies primarily through intergalactic filaments at temperatures well below the virial temperature of the galaxy and to never be shock-heated (Birnboim & Dekel, 2003; Katz et al., 2003; Kereš et al., 2005; Dekel & Birnboim, 2006; Ocvirk et al., 2008; Kereš et al., 2009; Dekel et al., 2009; Brooks et al., 2009). The temperatures of our filaments are below a few times , mostly well below the estimated virial temperatures of the galaxies, which range from about down to about 444The virial temperatures were computed using a spherically symmetric mass profile within the virial radius of the galaxy..
The intergalactic medium is thought to be filamentous, and better knowledge of this texture may help to understand the spectra of high redshift quasars. The Lyman alpha forest is the main observational probe of this tenuous medium.
Many of the galaxies in the simulation, particularly small ones, do not have recognizable intergalactic filaments attached to them. For these galaxies the diffuse, hot, ionized gas around them may have few mechanisms to enter. Thus the presence or absence of filaments may effectively divide galaxies into two categories, those that can efficiently accrete gas and form stars and those that cannot. If the baryon-rich cores require a minimum amount of gas for the stability of an isothermal cylinder, it may be that the stellar content of a galaxy is a good indication for overall cosmic density. The importance of the gas environment for accretion has been emphasized by Kereš et al. (2005).
The dearth of satellite galaxies around the Milky Way is sometimes cited as a problem for the currently favored CDM cosmology, which would predict many more satellite dark haloes. An absence of filaments at an earlier stage in cosmic history may have prevented these haloes from becoming luminous today. Whatever the explanation, it is worth noting that the simulation predicts a clear separation between gas and dark matter at the spatial dimensions of small galaxies. We would argue, then, that an assessment of the number of galaxies that form stars requires a simulation that at a minimum includes some gas hydrodynamics.
We invariably see our filaments embedded within thin sheets of gas. This observation suggests that the filaments might emerge from the sheets. Schmid-Burgk (1967) has shown that an infinite isothermal cylinder is but one extreme of a series of isothermally balanced structures that range from the infinite isothermal sheet, through intermediate structures containing regularly spaced, parallel, embedded filaments with elliptical cross-sections, to the other extreme of isolated cylinders.
A hydrodynamic origin of the filaments may help to explain a general difference between the collapse of dark matter and gas in our simulation. The dark matter can collapse only so far into filaments before fragmenting and collapsing further into spheroidal structures. The gas on the other hand can collapse into denser filaments which are stable to small perturbations.
Acknowledgments
We are grateful to Nickolay Y. Gnedin for providing the output from the simulation, his visualization software IFRIT, and helpful comments on the final manuscript.
References
- Bertschinger & Gelb (1991) Bertschinger E., Gelb J. M., 1991, Computers in Physics, 5, 164
- Binney (2004) Binney J., 2004, MNRAS, 347, 1093
- Birnboim & Dekel (2003) Birnboim Y., Dekel A., 2003, MNRAS, 345, 349
- Bond et al. (2010) Bond N. A., Strauss M. A., Cen R., 2010, MNRAS, 409, 156
- Brooks et al. (2009) Brooks A. M., Governato F., Quinn T., Brook C. B., Wadsley J., 2009, ApJ, 694, 396
- Chandrasekhar & Fermi (1953) Chandrasekhar S., Fermi E., 1953, ApJ, 118, 116
- Dekel & Birnboim (2006) Dekel A., Birnboim Y., 2006, MNRAS, 368, 2
- Dekel et al. (2009) Dekel A., Birnboim Y., Engel G., Freundlich J., Goerdt T., Mumcuoglu M., Neistein E., Pichon C., Teyssier R., Zinger E., 2009, Nature, 457, 451
- Dekel et al. (2009) Dekel A., Sari R., Ceverino D., 2009, ApJ, 703, 785
- Faucher-Giguere et al. (2011) Faucher-Giguere C., Keres D., Ma C., 2011, ArXiv e-prints
- Fillmore & Goldreich (1984) Fillmore J. A., Goldreich P., 1984, ApJ, 281, 1
- Gnedin (1995) Gnedin N. Y., 1995, ApJS, 97, 231
- Gnedin et al. (2003) Gnedin N. Y., Baker E. J., Bethell T. J., Drosback M. M., Harford A. G., Hicks A. K., Jensen A. G., Keeney B. A., Kelso C. M., Neyrinck M. C., Pollack S. E., van Vliet T. P., 2003, ApJ, 583, 525
- Gnedin & Bertschinger (1996) Gnedin N. Y., Bertschinger E., 1996, ApJ, 470, 115
- Gnedin & Fan (2006) Gnedin N. Y., Fan X., 2006, ApJ, 648, 1
- Górski et al. (2005) Górski K. M., Hivon E., Banday A. J., Wandelt B. D., Hansen F. K., Reinecke M., Bartelmann M., 2005, ApJ, 622, 759
- Hahn et al. (2007) Hahn O., Porciani C., Carollo C. M., Dekel A., 2007, MNRAS, 375, 489
- Harford & Gnedin (2003) Harford A. G., Gnedin N. Y., 2003, ApJ, 597, 74
- Harford & Gnedin (2007) Harford A. G., Gnedin N. Y., 2007, ApJ, 664, 599
- Harford et al. (2008) Harford A. G., Hamilton A. J. S., Gnedin N. Y., 2008, MNRAS, 389, 880
- Inutsuka & Miyama (1992) Inutsuka S., Miyama S. M., 1992, ApJ, 388, 392
- Katz et al. (2003) Katz N., Keres D., Dave R., Weinberg D. H., 2003, in J. L. Rosenberg & M. E. Putman ed., The IGM/Galaxy Connection. The Distribution of Baryons at z=0 Vol. 281 of Astrophysics and Space Science Library, How Do Galaxies Get Their Gas. pp 185–191
- Kereš & Hernquist (2009) Kereš D., Hernquist L., 2009, ApJL, 700, L1
- Kereš et al. (2009) Kereš D., Katz N., Fardal M., Davé R., Weinberg D. H., 2009, MNRAS, 395, 160
- Kereš et al. (2005) Kereš D., Katz N., Weinberg D. H., Davé R., 2005, MNRAS, 363, 2
- Ocvirk et al. (2008) Ocvirk P., Pichon C., Teyssier R., 2008, MNRAS, 390, 1326
- Ostriker (1964) Ostriker J., 1964, ApJ, 140, 1056
- Sahni et al. (1998) Sahni V., Sathyaprakash B. S., Shandarin S. F., 1998, ApJL, 495, L5
- Schmalzing et al. (1999) Schmalzing J., Buchert T., Melott A. L., Sahni V., Sathyaprakash B. S., Shandarin S. F., 1999, ApJ, 526, 568
- Schmid-Burgk (1967) Schmid-Burgk J., 1967, ApJ, 149, 727
- Sousbie et al. (2008) Sousbie T., Pichon C., Colombi S., Novikov D., Pogosyan D., 2008, MNRAS, 383, 1655
- Stodólkiewicz (1963) Stodólkiewicz J. S., 1963, Acta Astronomica, 13, 30