A mathematical model of social group competition with application to the growth of religious non-affiliation
Abstract
When groups compete for members, the resulting dynamics of human social activity may be understandable with simple mathematical models. Here, we apply techniques from dynamical systems and perturbation theory to analyze a theoretical framework for the growth and decline of competing social groups. We present a new treatment of the competition for adherents between religious and irreligious segments of modern secular societies and compile a new international data set tracking the growth of religious non-affiliation. Data suggest a particular case of our general growth law, leading to clear predictions about possible future trends in society.
pacs:
89.65.Ef, 89.75.-k, 89.75.Fb, 64.60.aq, 02.30.Hq, 45.10.HjThe tools of statistical mechanics and nonlinear dynamics have been used successfully in the past to analyze models of social phenomena ranging from language choice abrams03 to political party affiliation bennaim05 to war ispolatov96 and peace zhao09 . In this work, we focus on social systems comprised of two mutually exclusive groups in competition for members weidlich00 ; epstein97 ; krapivsky03 ; benczik08 ; holme06 ; durrett05 . We compile and analyze a new data set quantifying the declining rates of religious affiliation in a variety of regions worldwide and present a theory to explain this trend.
People claiming no religious affiliation constitute the fastest growing religious minority in many countries throughout the worldzuckerman07 . Americans without religious affiliation comprise the only religious group growing in all 50 states; in 2008 those claiming no religion rose to 15 percent nationwide, with a maximum in Vermont at 34 percentkosmin09 . In the Netherlands nearly half the population is religiously unaffiliatedNLstats . Here we use a minimal model of competition for members between social groups to explain historical census data on the growth of religious non-affiliation in 85 regions around the world. According to the model, a single parameter quantifying the perceived utility of adhering to a religion determines whether the unaffiliated group will grow in a society. The model predicts that for societies in which the perceived utility of not adhering is greater than the utility of adhering, religion will be driven toward extinction.
I Model
We begin by idealizing a society as partitioned into two mutually exclusive social groups, and , the unaffiliated and those who adhere to a religion. We assume the attractiveness of a group increases with the number of members, which is consistent with research on social conformitytanford84 ; latane96 ; latane81 ; hogg90 . We further assume that attractiveness also increases with the perceived utility of the group, a quantity encompassing many factors including the social, economic, political and security benefits derived from membership as well as spiritual or moral consonance with a group. Then a simple model of the dynamics of conversion is given byabrams03
| (1) |
where is the probability, per unit of time, that an individual converts from to , is the fraction of the population adhering to at time , is a measure of ’s perceived utility, and and are complementary fractions to and . We require to obtain symmetry under exchange of and and to capture the idea that no one will switch to a group with no utility or adherents. The assumptions regarding the attractiveness of a social group also imply that is smooth and monotonically increasing in both arguments. Under these assumptions, for generic Eq. (1) has at most three fixed points, the stability of which depends on the details of (see Supplementary Material Section S2).
A functional form for the transition probabilities consistent with the minimal assumptions of the model is , where and are constants that scale time and determine the relative importance of and in attracting converts, respectively. (Supplementary Figure S2 illustrates the structure of the fixed points for this case.) If there are three fixed points, one each at and , which are stable, and one at , which is unstable. For the stability of these fixed points is reversed. For the boundary at , there are only two fixed points, one of which is stable and the other unstable (see Supplementary Material Section S3).
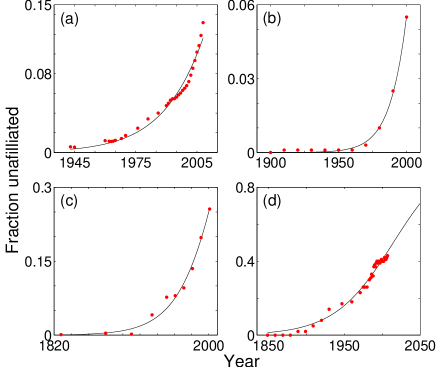
In Figure 1 we fit the model to historical census data from regions of Finland, Switzerland, Austria, and the Netherlands, four of 85 worldwide locations for which we compiled and analyzed data. The initial fraction unaffiliated and the perceived utility were varied to optimize the fit to each data set, while and were taken to be global. A broad minimum in the error near indicated that as a reasonable choice (see Supplementary Material Section S4). Figure 1(d) shows that, if the model is accurate, nearly 70% of the Netherlands will be non-affiliated by midcentury.
The behavior of the model can be understood analytically for , in which case we have = : logistic growth. An analysis of the fixed points of this equation tells us that religion will disappear if its perceived utility is less than that of non-affiliation, regardless of how large a fraction initially adheres to a religion. However, if is less than but close to one, a small social group can indefinitely coexist with a large social group. Even if it is possible that society will reach such a state if model assumptions break down when the population is nearly all one group.
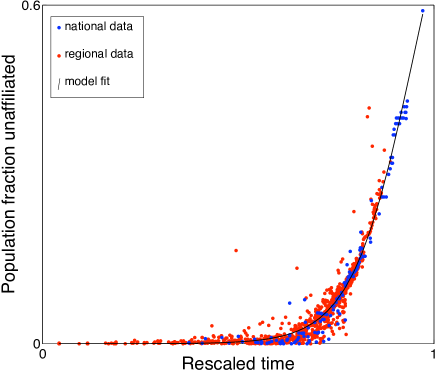
Figure 2 shows the totality of the data collected and a comparison to the prediction of Eq. (1) with , demonstrating the general agreement with our model. Time has been rescaled in each data set and the origin shifted so that they lie on top of one another. See Supplementary Material Section S3 for more details.
Our assumption that the perceived utility of a social group remains constant may be approximately true for long stretches of time, but there may also be abrupt changes in perceived utility, a possibility that is not included in the model. We speculate that for most of human history, the perceived utility of religion was high and of non-affiliation low. Religiously non-affiliated people persisted but in small numbers. With the birth of modern secular societies, the perceived utility of adherence to religion versus non-affiliation has changed significantly in numerous countrieszuckerman07 , such as those with census data shown in Fig. 1, and the United States, where non-affiliation is growing rapidlypew09 .
One might ask whether our model explains data better than a simple empirical curve. Logistic growth would be a reasonable null hypothesis for the observed data, but here we have provided a theoretical framework for expecting a more general growth law (1), and have shown that data suggest logistic growth as a particular case of the general law. Our framework includes a rational mathematical foundation for the observed growth law.
II Generalizations
We have thus far assumed that society is highly interconnected in the sense that individual benefits stem from membership in the group that has an overall majority. For that reason, the model as written is best applied on a small spatial scale where interaction is more nearly all-to-all. We can generalize this model to include the effects of social networks: rather than an individual deriving benefits from membership in the global majority group, he or she will instead benefit from belonging to the local majority among his or her social contactskrapivsky03 ; galam97 . In order to define “local,” however, we must introduce either a spatial dimension to the problem, or a network defining social interaction. On a network, Eq. (1) becomes:
| (2) |
where
| (3) |
defines the local mean religious affiliation, is a binary adjacency matrix defining the social network and is a binary religious affiliation vector (1 indicates membership in group X). An ensemble average has been assumed in order to write a derivative for the expected religious affiliation in (2), since this system is stochastic rather than deterministic. In the all-to-all coupling limit, and , so (2) reduces to (1).
A further generalization to a continuous system with arbitrary coupling can be constructed with the introduction of a spatial dimension. The spatial coordinate will be allowed to vary from to with a normalized coupling kernel determining the strength of connection between spatial coordinates and . The religious affiliation variable now varies spatially and temporally with , so individuals may have varying degrees of affiliation. Then the dynamics of satisfy
| (4) |
in analogy with the discrete system. Here represents the local mean religious affiliation,
| (5) |
Note that simulation of Eq. (2) with continuous real-valued and large is equivalent to integration of Eq. (4) with appropriate initial conditions and appropriately chosen . This is because (2) goes from a stochastic system for binary , to a deterministic system for real .
In the case of all-to-all coupling, , and , independent of space, where is the spatially averaged value of . Then (4) becomes
| (6) |
If at some time is independent of space, then and Eq. (6) becomes
| (7) |
which follows dynamics identical to the original two-group discrete system (1).
We can impose perturbations to both the coupling kernel (i.e., the social network structure) and the spatial distribution of values to examine the stability of this system and the robustness of our results for the all-to-all case. One very destabilizing perturbation consists of perturbing the system towards two separate clusters with different values. These clusters might represent a polarized society that consists of two social cliques in which members of each clique are more strongly connected to members of their clique than to members of the other clique. Mathematically, this can be written as , where is a small parameter () that determines the amplitude of the perturbation and represents the Heaviside step function. This kernel implies that individuals with the same sign of are more strongly coupled to one-another than they are to individuals with opposite-signed .
The above perturbation alone is not sufficient to change the dynamics of the system—a uniform state will still evolve according to the dynamics of the original system (1) (See Supplementary Material Section S5).
We add a further perturbation to the spatial distribution by imposing , where is a small parameter. This should conspire with the perturbed coupling kernel to maximally destabilize the uniform state.
Surprisingly, an analysis of the resulting dynamics reveals that this perturbed system must ultimately tend to the same steady state as the original unperturbed system. Furthermore, the spatial perturbation must eventually decay exponentially, although an initial growth is possible. (See Supplementary Material Section S5 for more details on the perturbative analysis.)
The implication of this analysis is that systems that are nearly all-to-all should behave very similarly to an all-to-all system. In the next Section we describe a numerical experiment that tests this prediction.
III Numerical Experiment
We design our experiment with the goal of controlling the perturbation from an all-to-all network through a single parameter. We construct a social network consisting of two all-to-all clusters initially disconnected from one-another, and then add links between any two nodes in opposite clusters with probability . Thus corresponds to an all-to-all network that should simulate (1), while leaves the network with two disconnected components. Small perturbations from all-to-all correspond to near 1, and can be related to the coupling kernel perturbation parameter described above as (assuming all links in the network have equal weight). The size of each cluster is determined by the initial condition as , .
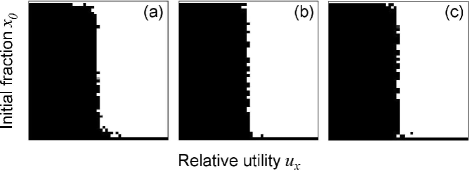
Figure 3 compares the results of simulation of system (2) with varying perturbations off of all-to-all. The theoretical (all-to-all) separatrix between basins of attraction is a vertical line at . Even when , when in-group connections are 100 times more numerous than out-group connections, the steady states of the system and basins of attraction remain essentially unchanged.
In the case of the continuous deterministic system (4), the equivalent figure to 3 is extremely boring: numerically, the steady states of the perturbed system are indistinguishable from those of the unperturbed all-to-all system, regardless of the value of (see Supplementary Section S6 and Figure S5).
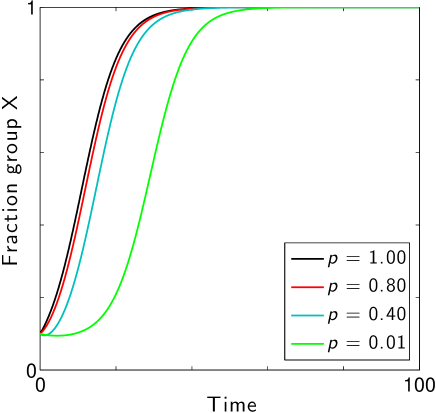
The only notable difference between the dynamics of the continuous networked system and the dynamics of the original all-to-all system (1) is a time delay apparent before the onset of significant shift between groups (see Figure 4). We were able to find an approximate expression for that time delay as (see Supplementary Material Section S7, figures S6 and S7).
What we have shown by the generalization of the model to include network structure is surprising: even if conformity to a local majority influences group membership, the existence of some out-group connections is enough to drive one group to dominance and the other to extinction. In the language of references krapivsky03 ; benczik08 ; holme06 , the population will reach the same consensus, despite the existence of individual cliques, as it would without cliques, with only the addition of a time delay.
In a modern secular society there are many opportunities for out-group connections to form due to the prevalence of socially integrated institutions—schools, workplaces, recreational clubs, etc. Our analysis shows that just a few out-group connections are sufficient to explain the good fit of Eq. (1) to data, even though Eq. (1) implicitly assumes all-to-all coupling.
IV Conclusions
We have developed a general framework for modeling competition between social groups and analyzed the behavior of the model under modest assumptions. We found that a particular case of the solution fits census data on competition between religious and irreligious segments of modern secular societies in 85 regions around the world. The model indicates that in these societies the perceived utility of religious non-affiliation is greater than that of adhering to a religion, and therefore predicts continued growth of non-affiliation, tending toward the disappearance of religion. According to our calculations, the steady-state predictions should remain valid under small perturbations to the all-to-all network structure that the model assumes, and, in fact, the all-to-all analysis remains applicable to networks very different from all-to-all. Even an idealized highly polarized society with a two-clique network structure follows the dynamics of our all-to-all model closely, albeit with the introduction of a time delay. This perturbation analysis suggests why the simple all-to-all model fits data from societies that undoubtedly have more complex network structures.
For decades, authors have commented on the surprisingly rapid decline of organized religion in many regions of the world. The work we have presented does not exclude previous models, but provides a new framework for the understanding of different models of human behavior in majority/minority social systems in which groups compete for members. We believe that, with the application of techniques from the mathematics of dynamical systems and perturbation theory, we have gained a deeper understanding of how various assumptions about human behavior will play out in the real world.
Acknowledgements.
This work was funded by Northwestern University and The James S. McDonnell Foundation. The authors thank P. Zuckerman for useful correspondence.References
- (1) D. M. Abrams and S. H. Strogatz, Nature 424, 900 (2003)
- (2) E. Ben-Naim, Europhys. Lett., 671 (2005)
- (3) I. Ispolatov, P. L. Krapivsky, and S. Redner, Phys. Rev. E 54, 1274 (1996)
- (4) Z. Zhao, J. C. Bohorquez, A. Dixon, and N. F. Johnson, Phys. Rev. Lett. 103, 148701 (2009)
- (5) W. Weidlich, Sociodynamics: A Systematic Approach to Mathematical Modelling in the Social Sciences, 1st ed. (CRC Press, 2000)
- (6) J. M. Epstein, Nonlinear Dynamics, Mathematical Biology, And Social Science (Westview Press, 1997)
- (7) P. L. Krapivsky and S. Redner, Phys. Rev. Lett. 90, 238701 (2003)
- (8) I. J. Benczik, S. Z. Benczik, B. Schmittmann, and R. K. P. Zia, Europhys. Lett., 48006 (2008)
- (9) P. Holme and M. E. J. Newman, Phys. Rev. E 74, 056108 (2006)
- (10) R. Durrett and S. Levin, J. Econ. Behavior 57, 267 (2005)
- (11) P. Zuckerman, “Atheism: Contemporary rates and patterns,” in Cambridge Companion to Atheism, edited by M. Martin (University of Cambridge Press, 2007, 2007)
- (12) B. A. Kosmin and A. Keysar, American Nones: The Profile of the No Religion Population: A Report Based on the American Religious Identification Survey 2008, Tech. Rep. (Hartford, CT, 2009)
- (13) Statistics Netherlands (Centraal Bureau voor de Statistiek Statline), “Participation in social activities (data table).” (1997-2008)
- (14) S. Tanford and S. Penrod, Psych. Bull. 95, 189 (1984)
- (15) B. Latané, J. Comm. 46, 13 (1996)
- (16) B. Latané and S. Wolf, Psych. Rev. 88, 438 (1981)
- (17) M. A. Hogg and D. Abrams, Social Identifications: A Social Psychology of Intergroup Relations and Group Processes, reprint ed. (Routledge, 1990)
- (18) Pew Forum on Religion and Public Life, “Report on religious affiliation,” (2009)
- (19) S. Galam, Physica A: Statistical and Theoretical Physics 238, 66 (1997)
See pages 1 of Abrams_SI.pdf
See pages 2 of Abrams_SI.pdf
See pages 3 of Abrams_SI.pdf
See pages 4 of Abrams_SI.pdf
See pages 5 of Abrams_SI.pdf
See pages 6 of Abrams_SI.pdf