Homogeneous coexistence of SDW and SC states in CaFe1-xCoxAsF studied by nuclear magnetic resonance
Abstract
We investigated the homogeneous coexistence of spin-density-wave (SDW) and superconducting (SC) states via 75As-nuclear magnetic resonance (NMR) in CaFe1-xCoxAsF and found that the electronic and magnetic properties of this compound are intermediate between those of LaFeAsO1-xFx and Ba(Fe1-xCox)2As2. For 6% Co-doped samples, the paramagnetic spectral weight completely disappears in the crossover regime between the SDW and SC phases followed by anomalous behavior of relaxation rate (), implying that the two phases are not segregated. 59Co-NMR spectra show that spin moments are not commensurate but spatially modulated. These experimental results suggest that incommensurate SDW (IC-SDW) and SC states are compatible in this compound.
pacs:
74.70. Xa, 74.25. Dw, 74.25. nj, 76.60. -kTo date, a number of iron-based high-critical temperature () superconductors have been discovered since the first discovery of superconductivity in LaFeAsO1-xFx [1]. Among these, 1111 series (RFeAsO1-xFx [R=Nd, Sm, Ce, and La, ) [1-6] and 122 series such as Ba(Fe1-xCox)2As2 [7-9] have been studied intensively because the former has a relatively high compared with the others, and the latter is available in a single-crystal form. A clear difference between the two series is apparent from the electronic phase diagrams shown in Fig. 1. The structural and magnetic phase transitions occur at almost the same temperature () for the 122 series but not for the 1111 series. The optimal for the La1111 series is realized away from the antiferromagnetic (AF) or spin-density-wave (SDW) phase, whereas the optimal for the Ba122 series is realized near the AF phase, although the optimal values are almost the same at ambient pressure. In other words, the overlap between the AF and SC phases is large for the Ba122 series, whereas the two phases are almost separated in the La1111 series. This necessarily leads to the problem of coexistence in the crossover regime. Several theoretical investigations have focused on charge and spin states in the vicinity of the crossover regime [10-12]. The coexistence of the order parameters of the incommensurate spin-density-wave and superconducting (IC-SDW + SC) states has been investigated in the crossover regime for s+-- or s++-wave symmetry [10-12]. The homogeneous coexistence of the AF and SC states has been suggested for Ba(Fe1-xCox)2As2 on a microscopic level [13-15], whereas microscopic or mesoscopic segregation of the AF and SC phases has been suggested for K-doped Ba(Fe1-xCox)2As2 [16-18]. The topics have been investigated mainly for the Ba 122 series [19] and it is presently unclear whether the observed phenomena are inherent to all iron-based superconductors with a crossover regime.
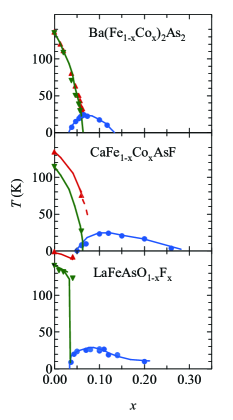
In this study, we focus on CaFe1-xCoxAsF [20] to investigate whether the AF and SC phases coexist homogeneously or are segregated. The compound is a member of the 1111 series, but exhibits an intermediate phase diagram, as shown in Fig. 1 [20-23]. The degree of overlap of the SC and AF phases is intermediate between the La1111 and Ba122 series. The doping dependence of the structural ( ) and magnetic () transition temperatures is also intermediate between the two series.
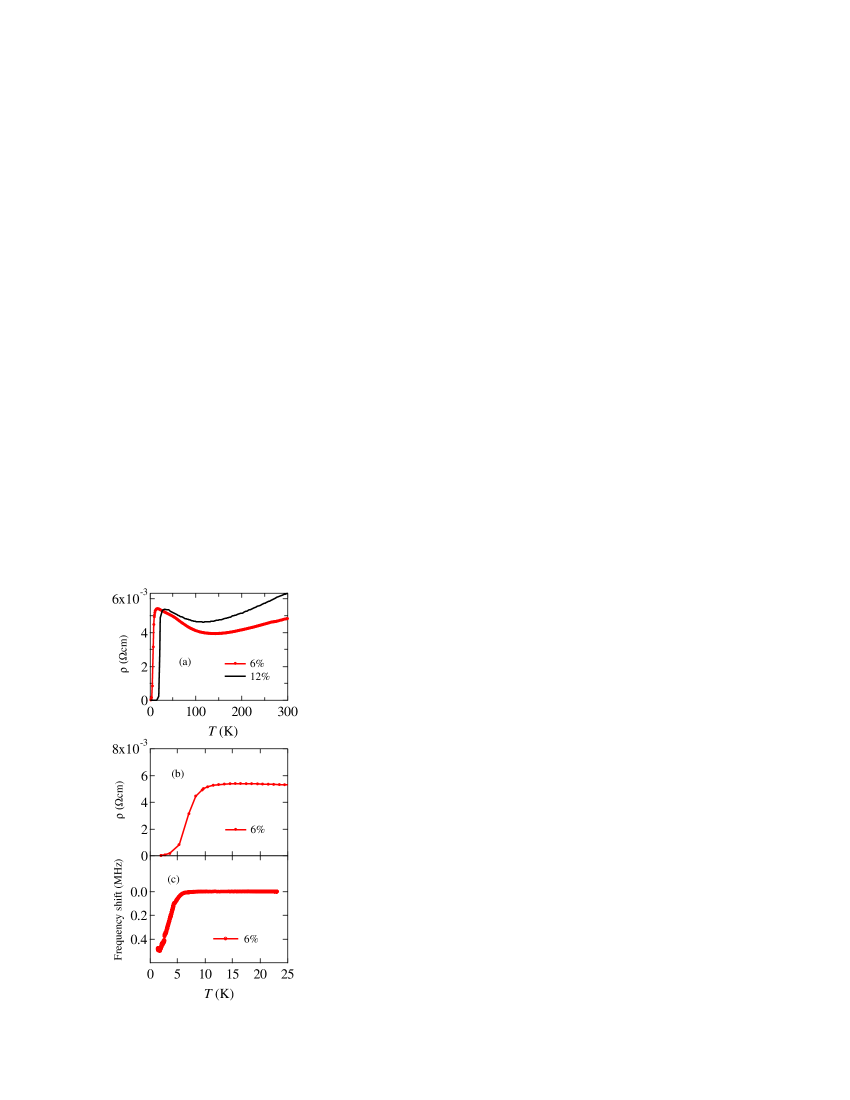
We performed nuclear magnetic resonance(NMR) measurements using 6% and 12% Co-doped powder samples. Figures 2 (a) and (b) show the dependence of the resistivity. The SC phase was confirmed for both samples; the onset is 7 and 20 K for the 6% and 12% Co-doped samples, respectively. The detuning of an NMR tank circuit is shown in Fig. 2 (c). The bending point at 7 K is closer to the zero-resistivity temperature than the onset.
For the 6% Co-doped samples, the field-swept 75As-NMR spectra were measured at a frequency = 45.1 MHz, as shown in Fig. 3. The low-field peak around 50 kOe corresponds to the transition I = -3/2 -1/2, and the central peak with two bumps corresponds to the transition I = -1/2 1/2. The two bumps of the central peak originate from the second-order quadrupole effect. The frequency shift () arising from this effect is expressed using two polar coordinates, and , of the applied field (H ) in the coordinate system of the electric field gradient (EFG). The coordinate represents the angle between H and the maximal principal axis (Z axis) of EFG. In this case, the Z axis is equivalent to the crystal c axis. The coordinate represents the angle between the second principal axis (X axis) and the H component projected onto the XY plane. The XY plane coincides with the crystal ab plane. The and dependence of is given as
| (1) |
where and () are the pure quadrupole frequency and the EFG anisotropy, respectively. From the analysis of the NMR spectra, and are estimated to be 22.6 MHz and 0.3, respectively. The value of is almost twice as large as that for the La1111 series [24]. The terms and in Eq. (1) are correction terms arising from axial asymmetry. The and dependence of and is explained in detail [25]. At the field , where represents the resonance field expected for , the spectral intensity is
| (2) |
where the gyromagnetic ratio () of 75As is 7.292 MHz/10kOe. For ,
| (3) |
The bumps originate from the powders with = 90∘ or 42∘ that satisfy . Even for , the bumps appear at the same angle ( = 90∘ or 42∘ ) [25]. The low-field bump originates from the powders with = 90∘ in which the Fe basal planes are aligned with H, whereas the high-field bump originates from the powders with = 42∘. The spectral weight weakens below and completely disappears in the SC state. An analogous disappearance is not observed for the 12% Co-doped samples in which the AF phase is absent. The disappearance of the bump is characteristic of the AF phase.

Unlike the high-field bump, the low-field bump is maintained even at low temperatures. The resonance position of the low-field bump is almost unchanged even when the Co nuclei experience the internal field that appears in the AF phase. For the commensurate SDW state, stripe-type antiferromagnetic spin moments aligned in an Fe plane (the ab plane) induce the internal field normal to the Fe plane on 75As sites, therefore, As nuclei experience no internal field when the Fe plane is parallel to H ( = 90∘). Consequently, the low-field bump is maintained even in the spin-ordered state. For crystals with other angles, As nuclei experience nonzero internal fields, and the corresponding signals are swept over a wider field range. This explanation is possible for the IC-SDW state accompanied by long-wave spin modulation.
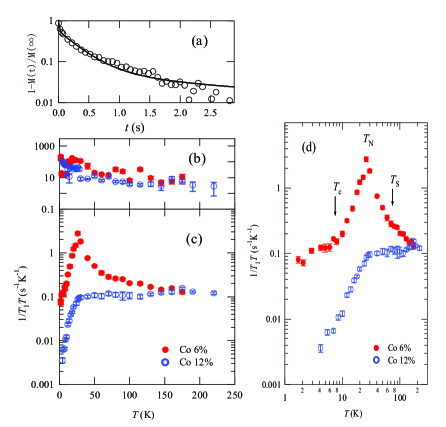
The relaxation time was measured using the conventional saturation-recovery method. The dependence of was measured at the low-field bump. The bump position is almost unchanged for the observed temperatures. Therefore, is successively measured even in the AF phase with the same conditions as the paramagnetic phase. The recovery curves , where represents the nuclear magnetization after the saturation pulse, exhibit a fast-recovery component throughout the entire temperature range. The data were analyzed using three-component fitting; that is, fast-recovery component is introduced tentatively into the recovery curve as follows:
| (4) |
A recovery curve measured at 4.2 K for the 6% Co-doped samples is shown in Fig. 4 (a). The magnitude of is two orders larger than that of , which allows us to separate the two terms without ambiguity. The dependence of and is shown in Figs. 4 (b) and 4 (c), respectively. Below 50 K, the value of is approximately 0.4 to 0.5. The results of are almost unchanged even if the experimental data are analyzed using instead of in Eq. (4). The dependence of reflects the AF and SC transitions both, whereas that of reflects neither of them. In Fig. 4 (d), =75 5 K and =26 K are derived from the bending point and peak, respectively. From neutron scattering measurements, the magnitude of the ordered moments is estimated to be 0.15 , which is considerably small compared with that in the undoped case (0.49 ) [22]. The bending point at 7 K observed in Fig. 4 (d) corresponds to , which is consistent with the temperatures observed from the detuning of the tank circuit and the resistivity measurements. Although was measured under an applied magnetic field, is almost the same, implying that the decrease in due to the applied field is negligible. As a result, the effect of the vortex is neglected when the Fe basal planes are parallel to H. Actually, we could not observe the field dependence of which is expected to appear for the vortex motion. The temperature dependence at low temperature follows the power law, . We tentatively attribute this dependence to an intrinsic electronic state in the Fe basal planes. The fast-recovery component is also observed for the 12% Co-doped samples. Therefore, this component may be extrinsic to the low-frequency fluctuation arising from the Fe basal planes. A possible origin of the fast-recovery component is nuclear spin diffusion.
For the 12% Co-doped samples, is almost independent of the temperature above and is proportional to below . There are two possible origins for this temperature-independent behavior. The first possibility is a Korringa relation , where is the density of the states at the Fermi energy, and the second possibility is very weak Curie-Weiss behavior. Both possibilities have been observed in LaFeAsO1-xFx. The former has been observed for the overdoped regime ( = 0.14-0.15) just above [24, 28], whereas the latter has been observed for the underdoped regime in a wide temperature range above [24, 29]. In the present case, the value of is rather close to that observed for the underdoped regime. The dependence is attributable to spin fluctuations.
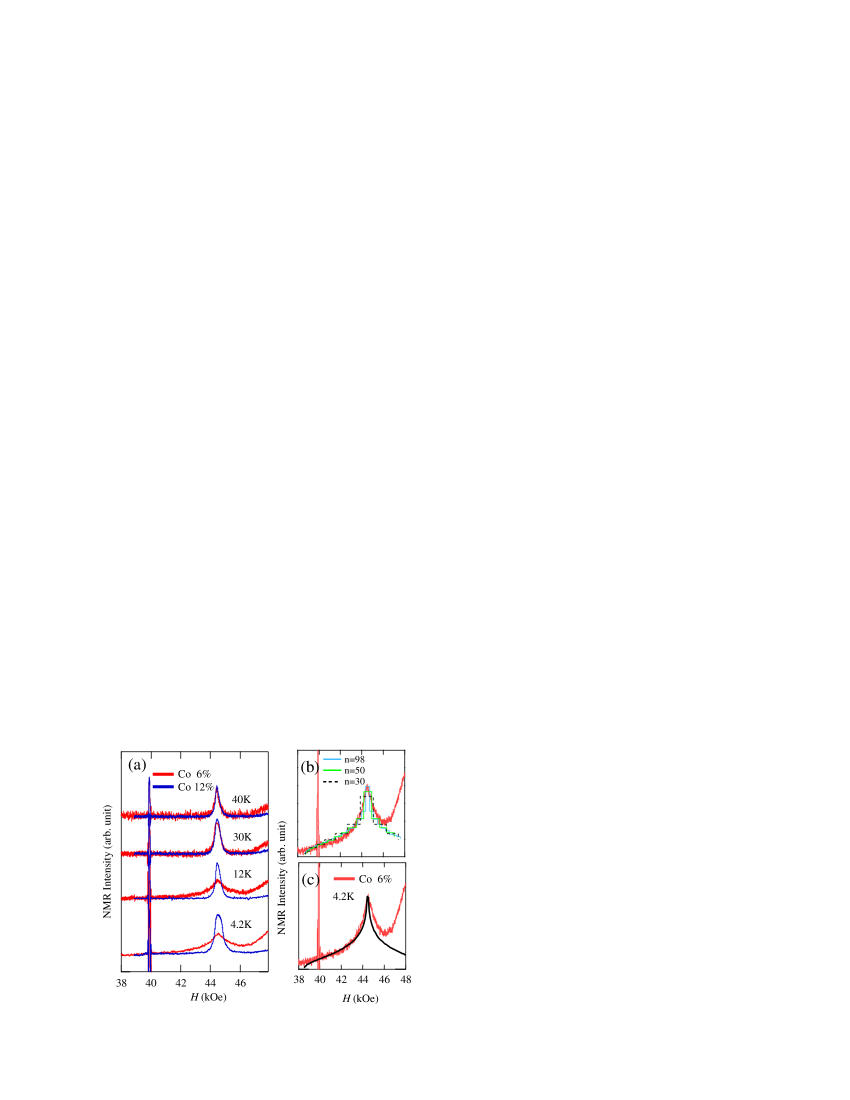
The present NMR measurements confirm successive phase transitions. The complete disappearance of the high-field bump in the crossover regime indicates that no paramagnetic domains exist, which implies that no phase segregation occurs in this doping regime. The fact that the AF phase is not commensurate can be demonstrated by the 59Co()-NMR spectra shown in Figs. 5(a) - (c). The satellite signals expected owning to the quadrupole effect are not clearly observed in the paramagnetic state as seen in Fig. 5(a), implying that the EFG at Co nuclei is considerably small and is somewhat distributed. The broadening due to an inhomogeneous EFG or hyperfine coupling may be seen at low temperatures for the 12% Co-doped samples. For the 6% Co-doped samples, however, the inhomogeneity hardly explains the broadening unless some spin ordering is considered. If a commensurate SDW state with an internal field was realized in the crossover regime, the spectral intensity would be
| (5) | |||||
| (6) |
where and represents the angle between H and the Fe plane. The field dependence represents a well-known rectangular powder pattern, implying that the commensurate SDW state is not realized. Figure 5(b) shows simulations for the internal field modulated to the AF direction , where the wavelength is 2 lattice units, and = 6 kOe. The width of the top rectangular pattern is proportional to for a large . A pattern with a large approaches to the curve expressed by the following integral:
| (7) | |||||
| (8) |
The curve reproduces the experimental results well as shown in Fig. 5(c). In fact, an extremely large is not always required owning to the small quadrupole effect: the rectangular pattern would become smooth when this effect is considered.The simulations for = 50 - 100 could reproduce the experimental results. The cusp-type pattern at 4.2 K in Fig. 5(a) is almost the same as that at 12 K, suggesting that the distribution of the internal field below is identical to that above . This result implies that the SC transition proceeds on the background of the IC-SDW state which is well developed above . A uniform electronic state, the IC-SDW + SC state, is a promising candidate to explain these experimental results.
In summary, we measured NMR spectra and in CaFe1-xCoxAsF and found that the electronic and magnetic properties are intermediate between those of LaFeAsO1-xFx and Ba(Fe1-xCox)2As2. For the 6% Co doped samples, we confirm the coexistence of the SC and spin-ordered states from at low temperatures. At , the 75As spectral weight completely disappears in the crossover regime, which indicates that no phase segregation is realized in this regime. The 59Co-NMR spectra demonstrate that spin moments are not commensurate but spatially modulated. In addition, the SC state develops on the background of the IC-SDW state, which suggests the existence of a uniform electronic IC-SDW + SC state.
References
- (1)
- (2) [[1]] Y. Kamihara et. al., J. Am. Chem. Soc. 130, 3296 (2008).
- (3) [[2]] H. Luetkens et. al., Nature Materials, 8, 305 (2009).
- (4) [[3]] Y. Kamihara et. al., N. J. Phys. 12, 033005 (2010).
- (5) [[4]] C. Hess et. al., Europhys. Lett. 87, 17005 (2009).
- (6) [[5]] J. Zhao et. al., Nature Materials, 7, 953 (2008).
- (7) [[6]] C. R. Rotundu et. al.,Phys. Rev. B 80, 144517 (2009).
- (8) [[7]] X. F. Wang et. al., N. J. Phys. 11, 045003 (2009).
- (9) [[8]] C. Lester et. al., Phys. Rev. B 79, 144523 (2009).
- (10) [[9]] F. Rullier-Albenque et. al., Phys. Rev. Lett. 103, 057001 (2009).
- (11) [[10]] A. B. Vorontsov, M. G. Vavilov, and A. V. Chubukov, Phys. Rev. B 79, 060508(R) (2009).
- (12) [[11]] R. M. Fernandes, and J. Schmalian, Phys. Rev. B 82, 140501(R) (2010).
- (13) [[12]] L. P. Gorkov, and G. B. Teitel’baum, Phys. Rev. B 82, 020510(R) (2010).
- (14) [[13]] M. H. Julien et. al., Europhys. Lett. 87, 37001 (2009).
- (15) [[14]] Y. Laplace et. al., Phys. Rev. B 80, 140501(R) (2009).
- (16) [[15]] P. Marsik et. al., Phys. Rev. Lett. 105, 057001 (2009).
- (17) [[16]] H. Fukazawa et. al., J. Phys. Soc. Jpn. 78, 033704 (2009).
- (18) [[17]] J. T. Park et. al., Phys. Rev. Lett. 102, 117006 (2009).
- (19) [[18]] T. Goko et. al., Phys. Rev. B 80, 024508 (2009).
- (20) [[19]] Phase segregation under pressure has also been reported in undoped SrFe2As2. K. Kitagawa et. al., Phys. Rev. Lett. 103, 257002 (2009).
- (21) [[20]] S. Matsuishi et. al., J. Am. Chem. Soc. 130, 14429 (2008).
- (22) [[21]] T. Nomura et. al., Supercond. Sci. Technol. 22, 055016 (2009).
- (23) [[22]] Y. Xiao et. al., Phys. Rev. B 79, 060504(R) (2009).
- (24) [[23]] The of 26 K for 6%-doped samples has been obtained from in the present work.
- (25) [[24]] T. Nakano et. al., Phys. Rev. B 81, 100510(R) (2010).
- (26) [[25]] G. H. Stauss, J. Chem. Phys. 40, 1988 (1964).
- (27) [[26]] S. Takeshita et. al., Phys. Rev. Lett. 103, 027002 (2009).
- (28) [[27]] S. Takeshita and R. Kadono, New. J. Phys. 11, 035006 (2009).
- (29) [[28]] M. Sato et. al., J. Phys. Soc. Jpn. 79 014710 (2010).
- (30) [[29]] T. Nakano et. al., Phys. Rev. B 82, 172502 (2010).
- (31)