Decays and CVC
Abstract
We use experimental data on and to test conservation of vector current (CVC) by comparing the predicted hadronic spectrum and branching fraction with the decay data. Based on the corresponding data and CVC, we also calculate the branching fraction of decay.
1 Introduction
Low energy annihilation into hadrons is a source of valuable information about the interactions of light quarks. Precise measurements of the exclusive cross section appear important for different applications like, e.g., determination of various QCD parameters — quark masses, quark and gluon condenstates [1], calculation of the hadronic contributions to the muon anomalous magnetic moment and running fine structure constant [2].
The hypothesis of conserved vector current and isospin symmetry relate to each other the isovector part of hadrons and corresponding (vector current) hadronic decay of the lepton [3, 4]. This follows from the deep relation between weak and electromagnetic (EM) interactions. The vector weak current and the isovector part of the electromagnetic vector current are different components of the same vector current, so that the matrix element of these currents must be identical assuming SU(2) symmetry. In this case the weak isovector current is assumed to be conserved in analogy to the EM current. This assumption is the CVC hypothesis.
As a consequence, hadronic currents describing vector decays and low energy (up to the lepton mass) annihilation are related and can be obtained one from another. These relations allow one to use an independent high-statistics data sample from decays for increasing the accuracy of the prediction of the spectral functions directly measured in annihilation [5].
The very first application of this idea was very fruitful [5], but increasing experimental precision in both and sectors revealed unexpected problems: the and spectral functions from decays were significantly higher than those obtained from [6, 7]. Although tension in this sector has been recently somewhat decreased after a reestimation of the isospin breaking corrections [8], it is important to understand the reasons causing the deviations between the spectral functions. One of the necessary steps is to perform a systematic test of CVC relations using all available experimental information on various final states.
For the vector part of the weak hadronic current, the distribution of the mass of the produced hadronic system is:
| (1) |
where the spectral function is given by the expression:
| (2) |
and is an electroweak correction equal to 1.0194 [9].
Since the vector part of the weak current has a positive -parity, the allowed quantum numbers for hadronic decays are:
| (3) |
After integration the branching fraction of the decay is
| (4) |
In this work we focus on two specific final states of annihilation ( decay): () and (). Theoretical calculations for the corresponding decay modes of the lepton based on CVC were earlier performed by many authors, see the bibliography in Ref. [10, 11]. New comparison of CVC-based predictions with measurements of lepton decays were motivated by recent progress of experiments on decays as well as by the updated information from annihilation into hadrons, coming mostly from the BaBar [12] and SND [13] collaborations.
For numerical estimates we use the value of the electronic branching = (17.85 0.05)% and recommended by RPP-2010 [14].
2
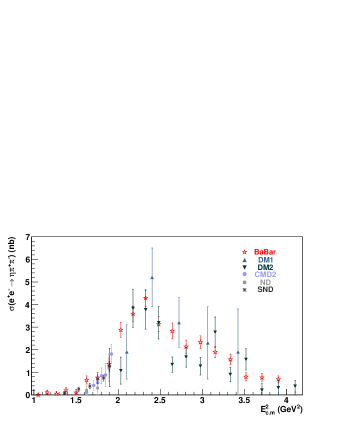
The reaction was recently studied by the BaBar collaboration using ISR in the broad energy range from 1 GeV to 3 GeV [12] and by the SND collaboration in the energy range from 1.1 GeV to 1.4 GeV [13]. Earlier measurements were performed at the ND [15], CMD-2 [16] detectors from 1.25 to 1.4 GeV and at the DM1 [17] and DM2 [18] detectors from 1.4 to 2 GeV. The results of various measurements are shown in Fig. 1. In general, they are in fair agreement with each other within errors although below 1.4 GeV the values of the cross section from BaBar are somewhat higher than those of the previous experiments. Above this energy, the results from BaBar are higher than those from DM2, whereas they are in good agreement with much less precise data of DM1. A more detailed information about the data samples used can be found in Table 1.
| Group | , GeV | Npoints | , % | , % |
|---|---|---|---|---|
| ND, 1986 | 1.25 - 1.40 | 3 | 50 - 100 | 10 |
| CMD-2, 2000 | 1.25 - 1.40 | 6 | 30 - 60 | 15 |
| SND, 2010 | 1.17 - 1.38 | 6 | 15 - 60 | 10.5 |
| DM1, 1982 | 1.40 - 1.80 | 4 | 30 - 60 | 10 |
| DM2, 1988 | 1.35 - 1.80 | 10 | 25 - 60 | 10 |
| BaBar, 2007 | 1.00 - 1.80 | 16 | 10 - 60 | 8 |
We calculated the branching fraction of decay expected from the above mentioned data using the relation (4). The direct integration of experimental points in the energy range from 1.25 GeV to the mass using older data samples gives for the branching fraction (0.130 0.015)% in agreement with the previous estimate [10], while that based on the BaBar data gives (0.165 0.015 )%, where we took into account the 8% systematic error claimed by the authors [12]. Since two results differ by more than one standard deviation, we follow the PDG prescription and inflate the uncertainty of their weighted average by a scale factor of 1.67. This gives for the CVC-based branching fraction (0.147 0.018)% in the energy range (1.25 - 1.77) GeV. Finally, we add the contribution of the low energy range from 1.0 GeV to 1.25 GeV (based on the BaBar data set) to obtain the total CVC expectation of (0.153 0.018)%. It can be compared to the measured branching fractions which are shown in Table 2 and include both older results from CLEO [19] and ALEPH [20] and the recent experimental result from Belle [21]. Our estimate is consistent within errors with all measurements as well as with their average of (0.139 0.008)%, which is 0.9 lower than our CVC-based prediction.
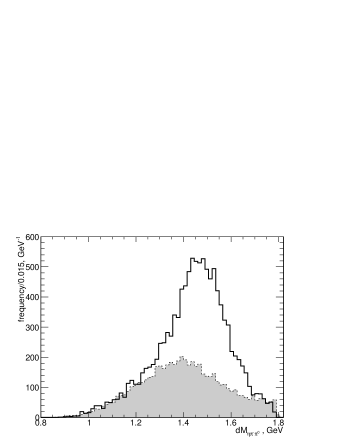
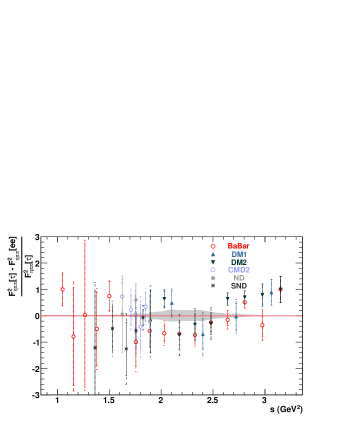
In addition, we show in Fig. 2 the spectrum of masses obtained by Belle and in Fig. 3 compare it (after subtracting the background) with the spectral function calculated from all available data using relation (1). In general, the two spectral functions are in fair agreement with each other except a few points near the lower and higher boundaries, where the values of are close to zero.
It is also interesting to compare our result wuth earlier theoretical estimates of this branching fraction, see Table 2. It can be seen that the older predictions based on the data and CVC agree with the much more accurate result of this work, which uses more precise data, in particular, the recent data sample of BaBar. Other predictions, which are more theoretically driven and use low-energy effective Lagrangians, show a much larger spread of the results.
| Group | ,% | Ref. |
|---|---|---|
| CLEO, 1992 | 0.170 0.020 0.020 | [19] |
| ALEPH, 1997 | 0.180 0.040 0.020 | [20] |
| Belle, 2009 | 0.135 0.003 0.007 | [21] |
| Method | ,% | Ref. |
|---|---|---|
| 0.3 | [22] | |
| CVC | 0.15 | [23] |
| Eff. Lagr. | 0.14 | [24] |
| Eff. Lagr. | 0.18-0.88 | [25] |
| CVC | 0.130.02 | [10] |
| CVC | 0.140.05 | [26] |
| CVC + Eff. Lagr. | 0.19 | [27] |
| Eff. Lagr. | 0.1 | [28] |
2.1 Cross section approximation
For future applications of our results aimed at the improvement of the existing Monte Carlo generators of annihilation [29] and decay [30] we perform the approximation of the cross section of the process . Its energy dependence is described by a sum of the (1450) and (1700) contributions (independently we check that the one from the tail is negligible in this energy range):
| (5) |
| (6) |
where are mass, width and peak cross section of the intermediate or , is the relative phase of the interference, and is a smooth function arising from the decay matrix element squared and the phase space, which is written as an integral over the kinematically allowed region on the – plane:
| (7) |
where are energies and momenta of pions, is a factor reflecting the properties of vector particle decay into three pseudoscalars and is a function characterizing (770) decay dynamics and can be written as:
| (8) |
Since our knowledge of decay channels of both (1450) and (1700) mesons is rather poor, the energy-dependent widths are written as:
| (9) |
where and are full width and mass of the resonances.
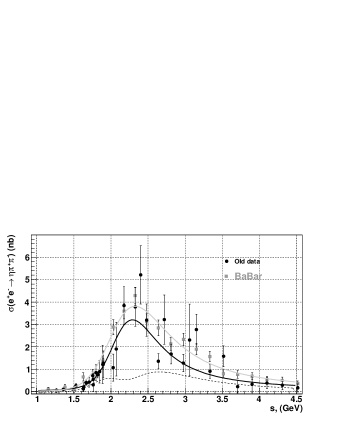
In view of the observed excess of BaBar cross sections over all others, we perform two independent fits – that of BaBar and all other data. Results of the fits are shown in Fig. 4 together with the difference between them (the dashed line). As one can see, the difference is higher than zero in the whole energy range which may point at the fact that cross sections obtained by BaBar are systematically somewhat higher than those from previous experiments.
3
Recently the BaBar collaboration has presented the very first measurement of the cross section of the process [12], see Fig. 5. The cross section of the process clearly shows resonance behavior with a maximum slightly above 2 GeV. We fit the cross section assuming that it is described by a single resonance and parameterizing it with the Breit-Wigner amplitude for production of three pseudoscalar mesons [31]. The following resonance parameters (mass, width and cross section at the peak) have been obtained:
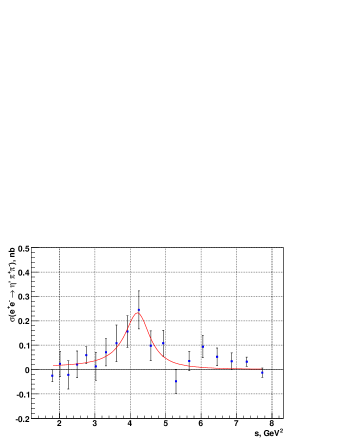
| (10) |
| (11) |
| (12) |
Here the systematic error of is 10% following the estimate of the overall systematic error of the cross section in Ref. [12]. Taking into account that we do not estimate systematic uncertainties on mass and width, one can conclude that the resonance parameters are compatible with those of the (2150) [14]. Since the values of the cross section are very low and have large uncertainties, we do not integrate directly the experimental points to estimate the branching fraction from CVC. Instead, we use (4) and integrate the optimal curve for the cross section up to the mass and obtain:
| (13) |
where the first error is statistical (that of the fit), the second one is experimental systematic and the third is the model one estimated by using the world average values of the (2150) mass and width and varying them within the errors. The obtained result is consistent with zero and we place the following upper limit at 90% CL using the method of Ref. [32]:
| (14) |
which is two and a half times more restrictive than the upper limit based on the only existing measurement from CLEO [33]:
| (15) |
but still an order of magnitude higher than a theoretical prediction based on the chiral Lagrangian [28].
4 Conclusion
Using data on the processes and CVC we obtained the following results:
-
•
for the expected branching fraction is (0.153 0.018)% compatible with the world average of (0.139 0.008)%;
-
•
the spectral functions of the system in annihilation and decay are consistent;
-
•
for the upper limit on the branching fraction is or 2.5 times smaller than the experimental one of 8 10-5, both at 90% CL.
5 Acknowledgments
The authors are grateful to George Lafferty and his colleagues for the excellent organization of the Workshop. We thank Henryk Czyż, Kenji Inami and Zbigniew Wa̧s for useful discussions. SE acknowledges the support of the Organizing Committee. The participation of SE was partially supported by the grants RFBR 10-02-08473 and 10-02-00695.
References
- [1] M. Shifman, A. Vainshtein, V. Zakharov, Nucl. Phys. B 147 (1979) 448.
- [2] S. Eidelman and F. Jegerlehner, Z. Phys. C 67 (1995) 585.
- [3] Y. S. Tsai, Phys. Rev. D 4 (1971) 2821.
- [4] H. B. Thacker and J. J. Sakurai, Phys. Lett. B 36 (1971) 103.
- [5] R. Alemany, M. Davier and A. Höcker, Eur. Phys. J. C 2 (1998) 123.
- [6] M. Davier et al., Eur. Phys. J. C 27 (2003) 497.
- [7] M. Davier et al., Eur. Phys. J. C 31 (2003) 503.
- [8] M. Davier et al., Eur. Phys. J. C 68 (2010) 127.
- [9] W. J. Marciano and A. Sirlin, Phys. Rev. Lett. 61 (1988) 1815.
- [10] S. I. Eidelman and V. N. Ivanchenko, Phys. Lett. B 257 (1991) 437.
- [11] V. A. Cherepanov and S. I. Eidelman, JETP Lett. 89 (2009) 429 [Pisma v ZhETF 89 (2009) 515].
-
[12]
B. Aubert et al., Phys. Rev. D 76 (2007) 092005,
Erratum-ibid, D 77 (2008) 119903. - [13] M. N. Achasov et al,. JETP Lett. 92 (2010) 80 [Pisma v ZhETF 92 (2010) 84].
- [14] K. Nakamura et al. [Particle Data Group], J. Phys. G 37 (2010) 075021.
- [15] V. P. Druzhinin et al., Phys. Lett. B 174 (1986) 115.
- [16] R. R. Akhmetshin et al., Phys. Lett. B 489 (2000) 125.
- [17] B. Delcourt et al., Phys. Lett. B 113 (1982) 93, Erratum - ibid, B 115 (1982) 503.
- [18] A. Antonelli et al., Phys. Lett. B 212 (1988) 133.
- [19] M. Artuso et al., Phys. Rev. Lett. 62 (1992) 78.
- [20] D. Busculic et al., Z. Phys. C 74 (1997) 263.
- [21] K. Inami et al., Phys. Lett. B 672 (2009) 209.
- [22] A. Pich, Phys. Lett. B 196 (1987) 561.
- [23] F. J. Gilman, Phys. Rev. D. 35 (1987) 3541.
- [24] E. Braaten, R. J. Oakes and S. M. Tse, Phys. Rev. D 36 (1987) 2188.
- [25] G. Kramer and W. F. Palmer, Z. Phys. C 39 (1988) 423.
- [26] S. Narison and A. Pich, Phys. Lett. B 304 (1993) 359.
- [27] R. Decker and R. Mirkes, Phys. Rev. D 47 (1993) 4012.
- [28] B. A. Li, Phys. Rev. D 57 (1998) 1790.
- [29] G. Rodrigo, H. Czyż, J. H. Kühn, Eur. Phys. J. C 24 (2002) 71.
- [30] S. Jadach, Z. Wa̧s, R. Decker, J. H. Kühn, Comput. Phys. Commun. 76 (1993) 361.
- [31] R. R. Akhmetshin et al., Phys. Lett. B 489 (2000) 125.
- [32] G. J. Feldman and R. D. Cousins, Phys. Rev. D. 57 (1998) 3873.
- [33] T. Bergfeld et al., Phys. Rev. Lett. 79 (1997) 2406.