Permanent address: ]Applied Physics Laboratory, Johns Hopkins University, Laurel, Maryland 20723
Charge Exchange and Chemical Reactions with Trapped Th3+
Abstract
We have measured the reaction rates of trapped, buffer gas cooled and various gases and have analyzed the reaction products using trapped ion mass spectrometry techniques. Ion trap lifetimes are usually limited by reactions with background molecules, and the high electron affinity of multiply charged ions such as make them more prone to loss. Our results show that reactions of with carbon dioxide, methane, and oxygen all occur near the classical Langevin rate, while reaction rates with argon, hydrogen, and nitrogen are orders of magnitude lower. Reactions of with oxygen and methane proceed primarily via charge exchange, while simultaneous charge exchange and chemical reaction occurs between and carbon dioxide. Loss rates of in helium are consistent with reaction with impurities in the gas. Reaction rates of with nitrogen and argon depend on the internal electronic configuration of the .
pacs:
34.70.+e,82.30.FiI Introduction
Unlike most atomic nuclei, which have excitation energies in the range of keV to MeV, the nucleus of the thorium isotope, 229Th, has an excited state just several eV above the nuclear ground state Beck et al. (2007). The transition between the nuclear ground state and this unique isomeric state lies within the UV optical spectrum, where it can be addressed using coherent light sources. The coherent control of the electronic states of atoms with tunable lasers has been a major focal point of modern atomic physics. Extending this paradigm to the control of nuclear states of atoms would represent a significant achievement. The transition between the 229Th nuclear states could potentially be used as a frequency reference with a fractional uncertainty approaching Peik and Tamm (2003). Furthermore, the transition may be especially sensitive to changes in the value of the fine structure constant, allowing up to 5–6 orders of magnitude enhancement in measurements of its time variation Flambaum (2006). However, this latter point requires further study Hayes and Friar (2007); He and Ren (2007, 2008); Berengut et al. (2009).
In order to demonstrate coherent control of the nuclear state, thorium atoms must be confined in such a way that they can be continuously interrogated and observed. Unlike the lower ionization states, triply ionized thorium has a convenient level structure for fluorescence detection and laser cooling Peik and Tamm (2003). The low-lying electronic states of and the optical transitions between them are shown in Fig. 1. Using the more common thorium isotope, 232Th, our group has demonstrated the creation, trapping, and laser cooling of Campbell et al. (2009).
In our earliest observations of , the ions would remain in the trap for only a few seconds. In general, elastic collisions with background molecules are not likely to result in ejection of ions due to the large depth of an ion trap. The primary modes of loss are charge exchange and chemical reactions with background gases. By improving the background vacuum and increasing the purity of the buffer gas used for initial cooling, we were able to extend the trap lifetime of to minutes. By removing the buffer gas immediately after the initial trap loading and laser cooling the ions, a lifetime of minutes was obtained Campbell et al. (2009).
The limited trap lifetime presents a significant challenge in time-intensive experiments like measuring the hyperfine states of and searching for the nuclear isomer transition. Furthermore, the short lifetime represents a tremendous cost in performing experiments with given the extraordinary price of the isotope ( $100k/mg).
To better understand the charge exchange and chemical reaction processes and quantify their rates, we conducted a series of experiments to determine the reaction rate coefficients between and various gases. A summary of the experimental results can be found in Table 1. The remainder of this paper is devoted to describing these experiments in greater detail.
| Reactant | () | |||
|---|---|---|---|---|
| He | ||||
| Ne | ||||
| Ar(∗) | ||||
| N | ||||
| H2 | ||||
| CH4 | ||||
| O2 | ||||
| CO2 |
A schematic of the ion trap used in these experiments is shown in Fig. 1. The trap is outfitted with a channel electron multiplier (CEM) for electronic detection of trapped ions. When used in combination with the well understood mass selection characteristics of a linear ion trap, the CEM can be used to determine if a specific species of ion is present in the trap.
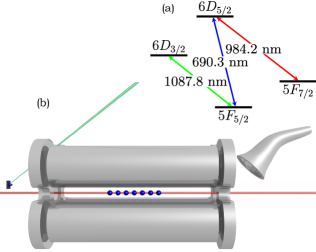
The ion trap is loaded with Th3+ via laser ablation of a thorium metal target with the third harmonic of a pulsed Nd:YAG laser ( nm). The target is located near the trap axis and oriented perpendicular to it. The voltage on the dc endcap nearest the ablation target is gated with the ablation pulse, dropping to ground when the pulse is fired, and increasing to 100 V for ion confinement.
Helium buffer gas is present in the system throughout the loading process. The ablated Th3+ ions are initially moving at speeds of 10 km/s as they approach the ion trap. As the hot Th3+ ions collide with room temperature helium atoms, they lose some of their thermal energy. This process serves two critical purposes. First, it reduces the energy of some ablated Th3+ ions as they traverse the length of the ion trap, thereby increasing the likelihood they will be trapped. Secondly, it damps the motion of trapped Th3+ ions, allowing them to come to thermal equilibrium at some fraction of the trap depth. The helium pressure is commonly held between and torr in these experiments. Generally, the number of ions loaded increases with higher buffer gas pressure, while the final equilibrium temperature of the trapped ions decreases.
II Helium
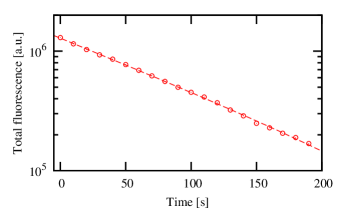
The loss of from the ion trap in torr of helium buffer gas is shown in Fig. 2. Here, the decay rate is measured by observing the reduction in fluorescence over a series of images. This method can be used only when the lifetime of the ions is sufficient to allow enough fluorescence measurements for a proper exponential fit.
When the trap lifetime is too short for observation of fluorescence, mass selective electronic detection with the CEM is employed to measure the decay rate. We load ions into the trap via ablation and wait for some amount of time. The rf and dc voltages applied to the trap are then tuned such that only remains stable. The contents of the trap are then delivered to the CEM by lowering the voltage of the trap endcap nearest it. The time interval before the mass selection is varied, and the data is accumulated over several iterations for each time interval. Many iterations are required to suppress the variation due to fluctuations in the number of ions loaded. This method is typically used when the lifetime is a few seconds or less.
The decay rate through any given reaction channel is proportional to the density of the reactant in the system. This relation can be written as , where is the density of the reactant, and is the reaction rate coefficient for the given channel. Here, is the reaction cross-section and is the relative velocity between the reactants. For a given reaction, the rate coefficient can be determined by measuring the decay rate as a function of the pressure of the reactive gas. The reaction rate coefficient is extracted from the slope of a linear fit of this data. The intercept of the linear fit gives the loss rate due to background gases in the vacuum. For helium, the data and corresponding linear fit are shown in Fig. 3
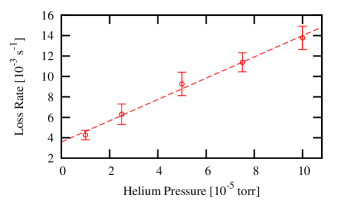
Helium is a noble gas, and a charge exchange reaction between it and is endothermic by 4.6 eV. This suggests that such a reaction is strongly inhibited for low energy reactants. Therefore, the loss shown in Fig. 2 is most likely due to an impurity in the helium rather than to the helium itself.
The helium gas we use in our experiment comes from a cylinder with a built-in purifier (BIP). The BIP helium is supplied by Airgas, Inc. According to the specifications, the BIP helium gas has an impurity level ppm. The data of Fig. 3 implies a reaction rate coefficient between the BIP helium and Th3+ on the order of to cm3s-1. Thus, the reaction between Th3+ and the contaminant within the BIP helium responsible for its loss proceeds with a reaction rate coefficient on the order of to cm3s-1.
A reaction rate coefficient of cm3s-1 is consistent with the value predicted by a classical collision model introduced by Langevin Langevin (1903) and refined by Gioumousis and Stevenson Gioumousis and Stevenson (1958). This model is helpful in estimating the reaction cross-sections between ions and molecules. We assume the ion is a point particle with charge , and that the molecule is spherically symmetric with polarizability . The primary interaction between the ion and molecule is due to the electric field of the ion and the field-induced diploe moment of the molecule. The interaction potential scales as .
Below threshold values of the relative velocity and the impact parameter, the interaction potential leads to a spiraling orbit of the ion and molecule about their shared center of mass. If a reaction between the ion and molecule is exothermic, it is assumed to occur with unit probability when a spiraling orbit occurs. The so-called Langevin cross-section for reaction is then Gioumousis and Stevenson (1958)
| (1) |
where is the relative velocity between the particles and is the reduced mass. The corresponding reaction rate coefficient is
| (2) |
The preceding equations are given in Gaussian (cgs) units, which is how they are most commonly found in the literature.
The Langevin model is not a comprehensive theoretical formulation, and therefore, it only suffices to provide an estimate of the reaction rate between a given ion and reactant molecule. The model does not apply to molecules that possess a permanent dipole moment. In that case, the leading term in the interaction potential scales as rather than Troe (1985). Furthermore, several experiments Schissler and Stevenson (1956); Field et al. (1957); Boelrijk and Hamill (1962) have shown a departure from the inverse velocity dependence of the classical cross-section in some reactions. Ultimately, the probability of a reaction occurring in the event of a classical interaction is dependent on the combined energy state of the reactants, the available energy states in the final products, and the possible reaction pathways between them Mahan (1971). Several experiments Johnsen and Biondi (1978, 1979, 1980); Holzscheiter and Church (1981a); Church and Holzscheiter (1989), including our own, have found that some reaction rates can differ significantly depending on the internal energy state of a reactant.
Nevertheless, the Langevin rate is useful in setting an upper bound on the reaction rate between ions and non-polar molecules McDaniel (1970). Many ion-molecule reactions do occur at or near the Langevin rate Johnsen and Biondi (1979); Johnsen et al. (1974); Holzscheiter and Church (1981b); Chatham et al. (1983); Church (1992); Andrews and Cho (2005). The Langevin rates for the reactions we investigated are given in Table 1 with the experimental results.
III Gases with low reaction rates
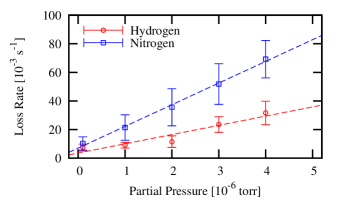
Loss rates of Th3+ in the presence of neon and argon are shown in Fig. 4, while loss rates in the presence of nitrogen and hydrogen are shown in Fig. 5. For all of these decay measurements, a partial pressure of torr of helium was added to the system to cool the ions for fluorescence imaging. As can be seen from Fig. 3, this quantity of helium does not add significantly to the background loss rate of Th3+. The reactions with argon, nitrogen, and hydrogen all proceed relatively slowly, with reaction rate coefficient orders of magnitude below the corresponding Langevin rates. Since our interest was in gases that react with Th3+ near the Langevin rate, we did not attempt to identify the products of these reactions.
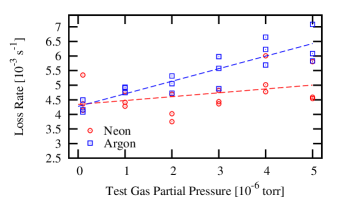
Like helium, neon is a noble gas with a high ionization energy that inhibits charge exchange reactions with . Such reactions are in this case endothermic by 1.6 eV. As can be seen in Fig. 4, loss rates in neon were never significantly larger than what could be attributed to the presence of the helium buffer gas. In addition, the reaction rate coefficient we determined from the data is consistent with reaction occurring between the and 0.5 ppm impurity in the gas.
It is worth noting that the kinetic energy of due to rf micromotion could conceivably contribute to overcome an otherwise endothermic energy gap Major and Dehmelt (1968); Wu and Brodbelt (1993); DeVoe (2009), such as with helium and neon. However, such micromotion-enhanced reactions would require micromotion amplitudes much larger than is likely. While some contribution of the micromotion to the loss rates is possible for endothermic reactions, our results are consistent with quoted impurities Airgas, Inc. (2009).
Argon is also a noble gas, but a charge exchange reaction between it and is exothermic by 4.2 eV. The reaction rates with argon and nitrogen were found to depend on the electronic configuration of the . The data in Fig. 4 represent loss rates from the 5F5/2 ground state of . The 5F5/2 state was isolated for study by shuttering the 690 nm laser between fluorescence measurements. This allows in the -manifold (see Fig. 1) to be pumped back into the ground state by the 984 nm laser. By keeping the time between measurement sufficiently long, the systematic effect introduced during measurement was held below 10%.
IV Th3+ excitation effects on reaction rates
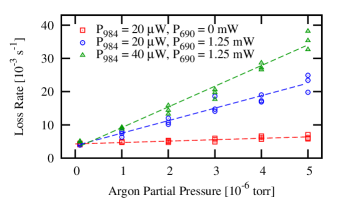
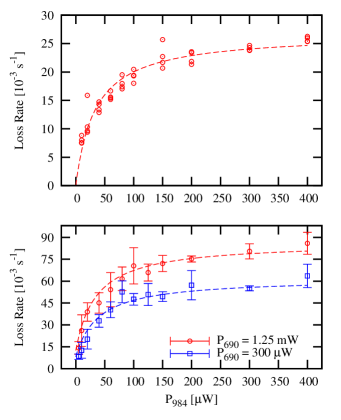
State dependent effects on electron capture in collisions between neutral atoms and multiply charged ions have been studied extensively (see, e.g., Janev and Winter (1985); Fléchard et al. (2001); Knoop et al. (2005); Bodewits and Hoekstra (2007)). The effect of Th3+ optical excitation on its reaction rate with argon can be seen clearly in Fig. 6. In one set of measurements, the 690 nm laser was shuttered between fluorescence measurements. This is the same data set shown in Fig. 4. In the other two sets of measurements, the 690 nm laser was left on continuously. Increasing the power of the 984 nm laser increases the population of the 6D5/2 excited state, and hence the reaction rate, until the excited state is saturated. The corresponding saturation of the argon and nitrogen reaction rates are shown in Fig. 7.
If the 5F7/2–6D5/2 manifold is approximated as a two-level system, the excited state population obeys the relation
| (3) |
where is the effective saturation intensity. The ratio of the effective saturation intensity to the natural saturation intensity, , is approximately equal to the ratio of the Doppler-broadened linewidth, , to the natural linewidth, . Therefore,
| (4) |
By fitting the data in Fig. 7 to a function in the form of Eq. (3), we find an effective saturation intensity of mW/cm2. According to Eq. (4), this corresponds to a Doppler-broadened linewidth of MHz, which is consistent with an independent measurement of the transition linewidth.
The reaction rate from the 5F7/2 electronic state was found to be equal to within experimental error to the reaction rate from the 5F5/2 state for both argon and nitrogen. The 5F7/2 state was isolated for measurement by shuttering the 984 nm laser between measurements, while continuously applying the 690 nm laser. In this way, the long-lived 5F7/2 state was continuosly repopulated. To further demonstrate that optical excitation to the 6D5/2 state was responsible for the increased reaction rates, we verified that detuning the lasers far from resonance had the same effect as shuttering them.
By optically exciting with the 1087 nm laser, we found that reactions with nitrogen were also faster from the 6D3/2 state than from the 5F5/2 state. No quantitative comparisons were made between the reaction rates from the 6D3/2 state and the 6D5/2 state. The reaction rate between Th3+ and argon with 1087 nm optical excitation was not measured.
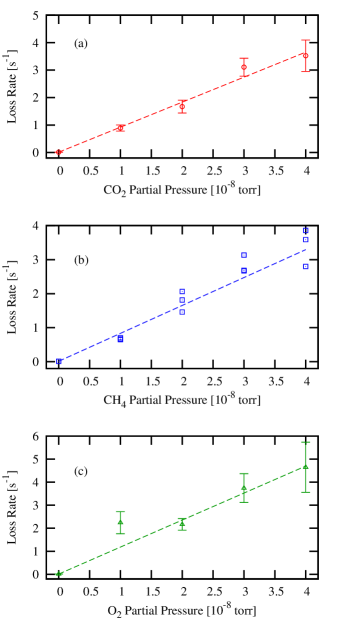
V Gases with high reaction rates
Loss rates of Th3+ in the presence of carbon dioxide, methane, and oxygen are shown in Fig. 8. All of these gases react relatively quickly with Th3+ at rates comparable to the Langevin rate. Even at partial pressures below torr, reactions occurring in the space between the ablation target and the trapping region significantly reduced the number of Th3+ ions loaded. To ensure sufficient loading and an adequate SNR for fluorescence measurement, torr of helium was added to the system for each measurement. The loss rates measured here were in all cases significantly higher than the loss rate with only torr of helium present.
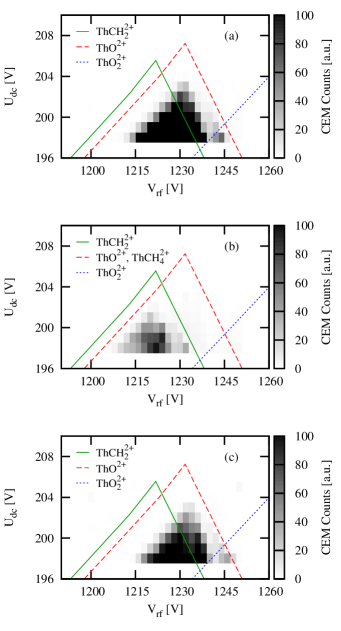
The products of reaction between Th3+ and carbon dioxide, methane, and oxygen were identified using mass selective CEM detection. For these measurements, torr of the test gas and torr of helium buffer gas was introduced into the system. The ion trap was loaded a number of times. Each time the trap was loaded, we waited a short period ( s) for reactions to occur, performed a mass selection, and checked for the presence of ions. Since the rf power supply for our trap could not provide high enough voltage to perform rigorous mass selection on singly ionized molecules, we were able to identify only doubly ionized molecules.
When either carbon dioxide or oxygen was present in the system, Th2+ and ThO2+ were found in the trap. Although thorium dioxide is chemically stable, no ThO was detected with either gas. In a previous work with singly-ionized thorium, Johnsen et al. Johnsen et al. (1974) found that oxidation occurs via the sequential reactions
| (5) | |||||
| (6) |
They found that the first reaction proceeded quickly, with a rate coefficient of cm3s-1, while the rate of the second reaction was more than an order of magnitude lower, with a coefficient of cm3s-1.
Reactions between Th3+ and methane, CH4, resulted in Th2+ and ThCH. Special care was taken to properly identify ThCH. Andrews and Cho Andrews and Cho (2005) were able to create ThCH4 by ablating thorium in a methane environment. However, Marçalo et al. Marçalo et al. (1996) found that the only reaction channel between singly-ionized thorium and methane is
| (7) |
Only 1 amu/ separates the mass-to-charge ratio of ThCH from ThCH and ThO2+. By carefully mapping the voltage space in which ThO2+ and ThCH were stable, we were able to achieve the resolution necessary to correctly determine the product (see Fig. 9).
Once the reaction products were identified, we were able to measure how Th3+ evolved over time in the presence of each of these gases. The results are shown in Fig. 10 for carbon dioxide, methane, and oxygen. Each data point in these graphs represents the average and standard deviation of six measurements. For each measurement, the trap was loaded, and Th3+ was mass selected. A fluorescence measurement would be taken immediately after the mass selection. After the specified wait time, the ion of interest would be mass selected and the contents of the trap delivered to the CEM. The resulting CEM signal was normalized according to the initial fluorescence measurement. By normalizing the signal in this way, the impact of loading fluctuations on the data was minimized.
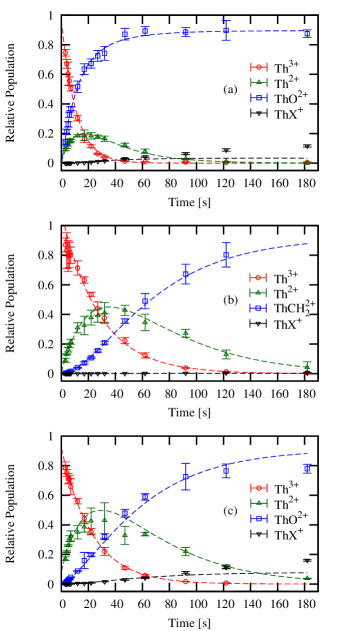
As was mentioned previously, the rf power supply for our trap could not provide high enough voltage to perform rigorous mass selection on singly ionized molecules. However, by ramping the rf to its maximum voltage, we could isolate ions with mass-to-charge ratios greater than 156 amu/. The only ions in the trap above that mass-to-charge ratio would be singly-ionized thorium molecules. These are represented as ThX+ in Fig. 10.
Direct comparison of the CEM signals of the various ions is of limited value since the gain of a CEM can vary from ion to ion. Ions with higher charge states experience a greater acceleration in the field created by the high negative bias at the entrance of the dynode. These ions strike the dynode surface with greater energy, resulting in a higher initial emission of electrons. The CEM gain also depends on mass, as lighter ions tend to cause a larger response than more massive ones. The chemical nature of the ion can also play a role.
We verified several times that the Th3+ CEM signal was linear with measurements of total fluorescence over the dynamic range of both instruments. However, the specific slope of the relationship at any given time was highly sensitive to the background light level around the system. Curtains were employed to stabilize and minimize background light; however, small shifts in the curtains incurred while the system was prepared for data collection still had a noticeable effect.
In order to compare the relative populations of the various ions in the trap over time, we adopted a simple method for scaling the CEM data. The method is based on two assumptions. We assume first that ions are not lost from the trap over the period of investigation. This is reasonable given that the trap depth is on the order of 100 eV for the ions in question, while the exothermicity of the reactions is only on the order of a few eV. We further assume that the only ions present in the trap are those identified in our earlier search for the reaction products. Since our method of searching for reaction products focused only on products resulting from fast reactions, this assumption could lead to error when considering longer time scales. However, here we focus our attention on the rapid chemical kinetics that occur on short time scales.
To scale the data we consider the sum
| (8) |
where is the total trap population, and and are the fluorescence normalized CEM signal and the CEM scaling factor for ion , respectively. The sum is over all ion species present in the trap. The scaling factors are determined via a least-squares algorithm that attempts to make for all . The data shown in Fig. 10 was scaled using this method. The scaling factors are given in Table 2.
| Species | Carbon Dioxide | Methane | Oxygen |
|---|---|---|---|
| ThO2+ | – | ||
| ThCH | – | – | |
| ThX+ |
It is clear from Fig. 10 that the dynamics responsible for the appearance of ThO2+ in the presence of carbon dioxide are different from the dynamics that cause ThO2+ to arise in oxygen and that bring about ThCH in the presence of methane. Based on the identified products, the possible reactions between Th3+ and these gases can be written generally as
| (11) | |||||
| (14) | |||||
| (17) |
Here, , , and represent the relative probabilities of the reaction channels. The possible subsequent reactions with can be summarized as
| (20) | |||||
| (23) | |||||
| (26) |
No decay in the quantity of ThO2+ or ThCH is seen over the time scales investigated, so these can be treated as stable final products. Thus, from the above reaction equations, we can write a system of differential equations describing the chemical kinetics in each gas. For example, in carbon dioxide,
| (27) | |||||
| (28) | |||||
| (29) | |||||
| (30) |
Similar systems of equations can be written to describe the reaction dynamics in methane and oxygen.
To estimate the relative probabilities of the various reaction channels, the data of Fig. 10 was numerically fit to dynamic equations of the form shown above. Fits were performed in the order of the above equations. Once a value was obtained for a fitting parameter, that value was enforced on subsequent fits. The branching ratios that were determined in this fashion are given in Table 3.
| Branching Ratio | Carbon Dioxide | Methane | Oxygen |
|---|---|---|---|
The values given in Table 3 can only be considered rough estimates of the actual branching ratios because of the uncertainties inherent in the CEM scaling procedure. They are given only to illustrate the general reaction dynamics. While reactions of with methane and oxygen proceed predominantly via charge exchange, simultaneous charge exchange and chemical reaction is the dominant branch in reactions between and carbon dioxide. Since methane has the highest ionization energy and lowest polarizability among hydrocarbons Lide (2007), the charge exchange reaction rates between other hydrocarbons and are likely as high as those of methane.
It is worth considering whether impurities of these fast reacting gases could explain the losses in the presence of argon, nitrogen, and hydrogen. CO2, O2, and CH4 each react strongly with at rates very close to the calculated Langevin rates. In order for these molecules to account for the observed loss rates in the other gases, they would have to be present as impurities at the level reacting at the Langevin rate, considerably higher than the levels specified by the gas supplier (see Table 4). Furthermore, none of these molecules exhibited different reaction rates due to optical excitation of , so their presence as impurities could not explain the reaction rates observed for argon and nitrogen. For these reasons, it is unlikely that impurities of the type measured to react at the Langevin rate are responsible for the losses observed for the slowly reacting gases.
| Gas | Minimum Purity | Hydrocarbons | ||
|---|---|---|---|---|
| Argon | 99.9997% | |||
| Hydrogen | 99.999% | |||
| Neon | 99.999% |
VI Conclusion
We have determined the effect of various gases on the trap lifetime of . Reactions involving carbon dioxide, oxygen, and methane proceed at a rate near the classical Langevin limit. Although charge exchange reactions with them are exothermic, the reaction rate coefficients for nitrogen, hydrogen, and argon are orders of magnitude less than the Langevin rate. The reaction rate coefficient between and helium provides a measure of the impurities in the buffer gas. The measurement of the coefficient here provides a standard against which the vacuum and buffer gas quality of future systems can be measured.
Acknowledgements.
We gratefully acknowledge Adam Steele, Corey Campbell, Alex Radnaev, and Alex Kuzmich for their assistance with this work, and we thank Ken Brown for valuable discussions. This work was supported by the Office of Naval Research (N000140911024) and the National Science Foundation (PHYS-1002550).References
- Beck et al. (2007) B. R. Beck, J. A. Becker, P. Beiersdorfer, G. V. Brown, K. J. Moody, J. B. Wilhelmy, F. S. Porter, C. A. Kilbourne, and R. L. Kelley, Phys. Rev. Lett. 98, 142501 (2007).
- Peik and Tamm (2003) E. Peik and C. Tamm, Europhys. Lett. 61, 181 (2003).
- Flambaum (2006) V. V. Flambaum, Phys. Rev. Lett. 97, 092502 (2006).
- Hayes and Friar (2007) A. C. Hayes and J. L. Friar, Phys. Lett. B 650, 229 (2007).
- He and Ren (2007) X. T. He and Z. Z. Ren, Journal of Physics G-Nuclear and Particle Physics 34, 1611 (2007).
- He and Ren (2008) X. T. He and Z. Z. Ren, Nucl. Phys. A 806, 117 (2008).
- Berengut et al. (2009) J. C. Berengut, V. A. Dzuba, V. V. Flambaum, and S. G. Porsev, Phys. Rev. Lett. 102, 210801 (2009).
- Campbell et al. (2009) C. J. Campbell, A. V. Steele, L. R. Churchill, M. V. DePalatis, D. E. Naylor, D. N. Matsukevich, A. Kuzmich, and M. S. Chapman, Phys. Rev. Lett. 102, 233004 (2009).
- Langevin (1903) P. Langevin, Annales De Chimie Et De Physique 28, 433 (1903).
- Gioumousis and Stevenson (1958) G. Gioumousis and D. P. Stevenson, J. Chem. Phys. 29, 294 (1958).
- Troe (1985) J. Troe, Chem. Phys. Lett. 122, 425 (1985).
- Schissler and Stevenson (1956) D. O. Schissler and D. P. Stevenson, J. Chem. Phys. 24, 926 (1956).
- Field et al. (1957) F. H. Field, J. L. Franklin, and F. W. Lampe, J. Am. Chem. Soc. 79, 2419 (1957).
- Boelrijk and Hamill (1962) N. Boelrijk and W. H. Hamill, J. Am. Chem. Soc. 84, 730 (1962).
- Mahan (1971) B. H. Mahan, J. Chem. Phys. 55, 1436 (1971).
- Johnsen and Biondi (1978) R. Johnsen and M. A. Biondi, Phys. Rev. A 18, 996 (1978).
- Johnsen and Biondi (1979) R. Johnsen and M. A. Biondi, Phys. Rev. A 20, 87 (1979).
- Johnsen and Biondi (1980) R. Johnsen and M. A. Biondi, J. Chem. Phys. 73, 190 (1980).
- Holzscheiter and Church (1981a) H. M. Holzscheiter and D. A. Church, J. Chem. Phys. 74, 2313 (1981a).
- Church and Holzscheiter (1989) D. A. Church and H. M. Holzscheiter, Phys. Rev. A 40, 54 (1989).
- McDaniel (1970) E. W. McDaniel, Ion-molecule reactions, Wiley-Interscience series in atomic and molecular collisional processes (Wiley-Interscience, New York, 1970).
- Johnsen et al. (1974) R. Johnsen, F. R. Castell, and M. A. Biondi, J. Chem. Phys. 61, 5404 (1974).
- Holzscheiter and Church (1981b) H. M. Holzscheiter and D. A. Church, Phys. Lett. A 86, 25 (1981b).
- Chatham et al. (1983) H. Chatham, D. Hils, R. Robertson, and A. C. Gallagher, J. Chem. Phys. 79, 1301 (1983).
- Church (1992) D. A. Church, J. Mod. Opt. 39, 423 (1992).
- Andrews and Cho (2005) L. Andrews and H. G. Cho, J. Phys. Chem. A 109, 6796 (2005).
- Major and Dehmelt (1968) F. G. Major and H. G. Dehmelt, Phys. Rev. 170, 91 (1968).
- Wu and Brodbelt (1993) H. Wu and J. S. Brodbelt, Int. J. Mass Spectrom. Ion Processes 124, 175 (1993).
- DeVoe (2009) R. G. DeVoe, Physical Review Letters 102, 063001 (2009).
- Airgas, Inc. (2009) Airgas, Inc., Airgas 2009 Product Catalog (2009).
- Janev and Winter (1985) R. K. Janev and H. Winter, Physics Reports 117, 265 (1985).
- Fléchard et al. (2001) X. Fléchard, C. Harel, H. Jouin, B. Pons, L. Adoui, F. Frémont, A. Cassimi, and D. Hennecart, J. Phys. B: At., Mol. Opt. Phys. 34, 2759 (2001).
- Knoop et al. (2005) S. Knoop, M. Keim, H. J. L dde, T. Kirchner, R. Morgenstern, and R. Hoekstra, J. Phys. B: At., Mol. Opt. Phys. 38, 3163 (2005).
- Bodewits and Hoekstra (2007) D. Bodewits and R. Hoekstra, Phys. Rev. A 76, 032703 (2007).
- Marçalo et al. (1996) J. Marçalo, J. P. Leal, and A. P. de Matos, International Journal of Mass Spectrometry and Ion Processes 157-158, 265 (1996), ISSN 0168-1176.
- Lide (2007) D. R. Lide, CRC Handbook of Chemistry and Physics (CRC, 2007), 88th ed., ISBN 0849304881.