SEPNET, South East Physics Network, UK
11email: alessandra.beifiori@port.ac.uk
On the spectral resolution of the MILES stellar library
Abstract
Context. Empirical stellar libraries are extensively used to extract stellar kinematics in galaxies and to build stellar population models. An accurate knowledge of the spectral resolution of these libraries is critical to avoid propagation errors and uncertain estimates of the intrinsic stellar velocity dispersion of galaxies.
Aims. In this research note we re-assess the spectral resolution of the MILES stellar library and of the stellar population models based on it. This exercise was performed, because of a recent controversy over the exact MILES resolution.
Methods. We perform our test through the comparison of MILES stellar spectra with three different sets of higher-resolution templates, one fully theoretical - the MARCS library - and two empirical ones, namely the Indo-U.S. and ELODIE v3.1 libraries. The theoretical template has a well-defined very high (R=20000) resolution. Hence errors on this theoretical value do not affect our conclusions. Our approach based on the MARCS library was crucial to constrain the values of the resolution also for the other two empirical templates.
Results. We find that the MILES resolution has previously been slightly overestimated. We derive a new spectral resolution of 2.54 Å FWHM, instead of the nominal 2.3 Å. The reason for this difference is due to an overestimation of the resolution for the Indo-U.S. library that was previously used for estimates of the MILES resolution. For the Indo-U.S. we obtain a new value of 1.35 Å FWHM. Most importantly, the results derived from the MARCS and ELODIE libraries are in very good agreement.
Conclusions. These results are important for users of the MILES spectra library and for further development of stellar population models aimed to obtain accurate stellar kinematics in galaxies.
Key Words.:
Techniques:spectroscopic – Stars: kinematics and dynamics – Galaxies:kinematics and dynamics1 Introduction
Stellar libraries are a crucial ingredient of stellar population models that predict the spectral energy distributions of stellar populations (e.g. Bruzual & Charlot 2003; Vazdekis et al. 1996; Maraston et al. 2009a; Vazdekis et al. 2010; Maraston & Strömbäck 2010). The latter are a key tool to analyse unresolved stellar populations such as galaxies and extra-galactic star clusters. The spectral resolution of a stellar population model is determined by the spectral resolution of the input stellar library. The latter can be either theoretical or empirical. As theoretical model atmosphere calculations are known to suffer from incomplete line lists and continuum uncertainties (Korn et al. 2005; Thomas et al. 2010; Maraston & Strömbäck 2010), empirical stellar libraries became a complementary and widely used option to calculate stellar population models (Vazdekis 1999; Bruzual & Charlot 2003; Maraston et al. 2009b; Maraston & Strömbäck 2010). The spectral resolution of empirical libraries is fixed by the instrumental resolution of the observations. An accurate assessment of the underlying spectral resolution of both the input library and the final stellar population model is essential for the proper use of such models.
Several new empirical stellar libraries have been published in recent years, e.g., ELODIE (Prugniel & Soubiran 2001), STELIB (Le Borgne et al. 2003) and MILES (Sánchez-Blázquez et al. 2006). The new stellar population models of Maraston & Strömbäck (2010) include all these three libraries, while the new model of Lick absorption-line indices by Thomas et al. (2010), Johansson et al. (2010) is based on MILES. In both Maraston & Strömbäck (2010) and Thomas et al. (2010) it has been pointed out that the stellar population spectral resolution of MILES appears to be somewhat coarser than generally assumed. It has been found that velocity dispersions of galaxies from the Sloan Digital Sky Survey (SDSS) data base (York et al. 2000) derived using the MILES-based templates of Maraston & Strömbäck (2010) agree well with the values from the SDSS-MPA/JHU data base (Kauffmann et al. 2003; Tremonti et al. 2004). This indicates that stellar population models based on MILES are close to the SDSS spectral resolution ( at Å), hence somewhat coarser than the Å FWHM stated in Sánchez-Blázquez et al. (2006) and Vazdekis et al. (2010).
The aim of this research note is to assess the spectral resolution of the MILES stellar library through direct comparison with various other empirical and theoretical stellar libraries at higher spectral resolution. Since a stellar population model may further dilute the nominal spectral resolution of the input library owing to uncertainties in radial velocities of the stars (MacArthur et al. 2009), we additionally assess the spectral resolution of the MILES-based Maraston & Strömbäck (2010) model.
2 Template stellar libraries
The MILES library (Sánchez-Blázquez et al. 2006) comprises 985 stars for a wide range of evolutionary stages and metallicities. It covers a wavelength range from Å at a nominal spectral resolution of Å FWHM. This value has been determined in Sánchez-Blázquez et al. (2006) through the comparison with the higher-resolution empirical library Indo-U.S. (Valdes et al. 2004).
The result from this evaluation is certainly only as robust as the spectral resolution of the adopted high-resolution library. Therefore, in this research note we select three different stellar libraries, both theoretical and empirical, with spectral resolutions higher than the one of MILES, with the aim at checking the robustness of this value.
The adopted libraries are Indo-U.S., MARCS and ELODIE v3.1. The key to our analysis is that MARCS is a theoretical library therefore with a well-defined spectral resolution. We summarise below the main characteristics of these libraries.
-
•
Indo-U.S. empirical library: consists of 1273 stars spectra covering the wavelength range between 3460-9464 Å with a nominal resolution of Å FWHM (Valdes et al. 2004). The library has a broad coverage of the stellar atmospheric parameters effective temperature, surface gravity and metallicity.
-
•
MARCS theoretical library: contains high-resolution (R=20000) theoretical spectra and covers a large spectral range from 1300 Å to 20 m Gustafsson et al. (2008). Effective temperatures range between 2500-8000 (at solar metallicity), surface gravities between -1.0 and 5.5 and metallicities between -5.0 and +1.0.
-
•
ELODIE v.3.1 empirical library: this version (Prugniel et al. 2007) is an updated release of the original ELODIE library (Prugniel & Soubiran 2001) and includes 1962 spectra of 1388 stars. ELODIE v3.1 covers a wavelength range between Å and provides a large coverage of atmospheric parameters. It is given at two resolutions, and . We decided to select the R=42000 (LH_ELODIE), which is more adequate for a robust test of the MILES library resolution.
3 Method
To extract the resolution of the MILES spectra we follow a similar procedure as in Sánchez-Blázquez et al. (2006). We first divide each spectrum in 11 regions equally spaced in log space to be able to assess the dependence of the resolution with wavelength. We then derive the broadening of each MILES star with respect to a library of templates at higher resolution (Indo-U.S., MARCS, ELODIE v3.1) by using the Penalized Pixel-fitting method (pPXF) of Cappellari & Emsellem (2004) and taking into account the resolution of each template. pPXF performs the fitting in the pixel scale between an observed spectrum and a linear combination of templates. pPXF also allows the use of additive and multiplicative Legendre polynomials to adjust the continuum shape of the template to the one of the spectrum to be analysed. We made some checks and found that the final results are consistently good by adding or not these polynomials. Therefore for the general test we decide not to use them.
The comparison between the results of two empirical libraries and a theoretical library gives us indication not only on the resolution of MILES but also on the actual resolution of the empirical templates we use. Hence, by using the same method, we additionally estimate the actual FWHM of the Indo-U.S. library using as templates MARCS and ELODIE v3.1 libraries. Note that the very high resolution of our templates - ELODIE v3.1 (R=42000) and MARCS (R=20000) - make us confident in our results since any error in the nominal resolution has very little impact on the final derived value.
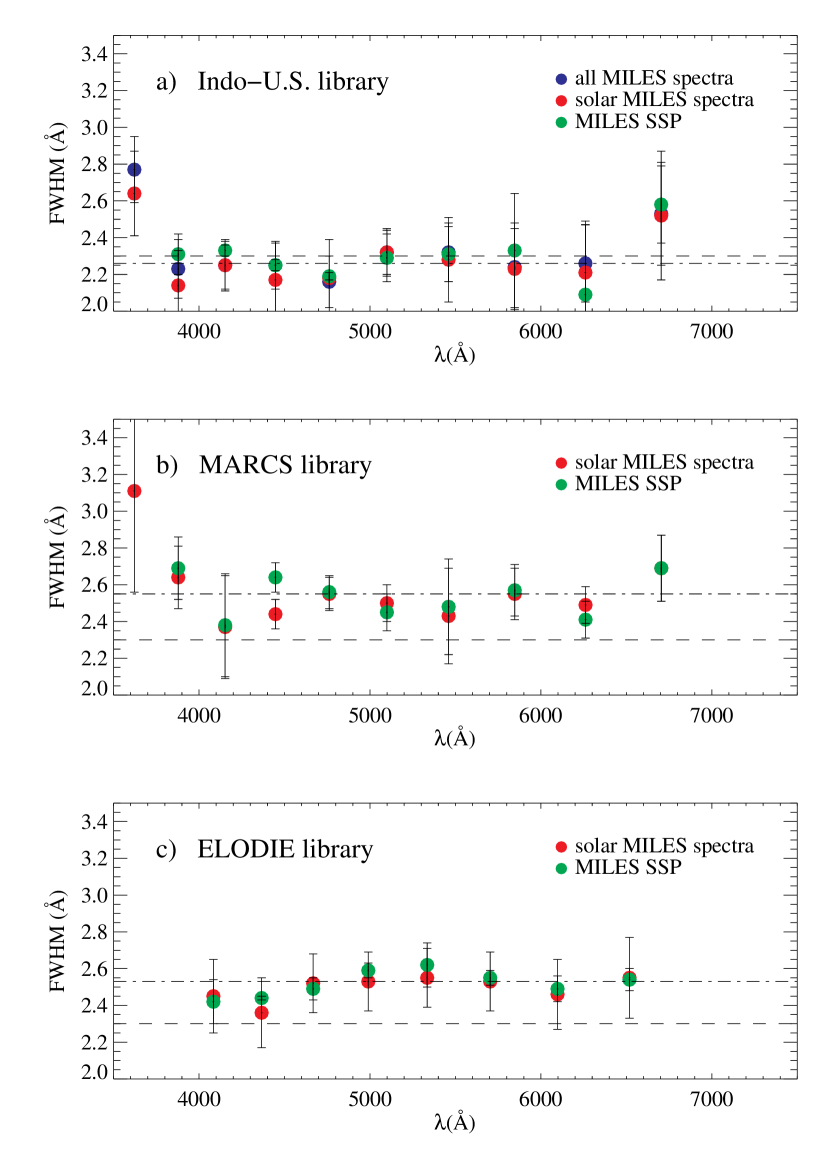
After obtaining the values of the broadening for each MILES star we derive the median of FWHMs to avoid being dominated by spurious values. Errors for each wavelength bin were estimated as the standard deviation of the FWHMs. This estimation is validated by the fact that the typical distribution of FWHM is close to a Gaussian (see Fig.1 for one example). In Fig. 2 we show the results for each wavelength bin and for each template library as described below.

With the same procedure we derived the resolution of the MILES-based SSP of Maraston & Strömbäck (2010) by using a representative subsample of them covering the whole age range - 6.5 Myr, 1Gyr and 10 Gyr. This is important as the fractional contribution of dwarfs and giants to the integrated stellar population spectrum changes with age. We use solar metallicity models with a Salpeter IMF. In all tests we decided to exclude the last wavelength bin at Å because the fit was not as reliable as in the other bins for none of the MILES stars.
4 Results
In the following we describe the results for each template separately. Note that in all cases we decided to remove the reddest wavelength interval (Å) as we could not obtain a good fit to the spectra, possibly due to the lack to strong absorption features to constrain the fit.
4.1 Template: Indo-US library at FWHM=1Å
As a first test we follow the same procedure of Sánchez-Blázquez et al. (2006). We first fitted each 985 MILES spectra with a linear combination of Indo-U.S. spectra (1274 templates). Then we applied the same technique to a subsample of stars chosen among the MILES and Indo-U.S. solar metallicity stars ([FeH]=/) finding 42 and 44 stars, respectively. This could give indications about possible bias in the selection of the stars. We did not find any bias between the initial sample and the final one, which excludes template mismatch and an insufficient number of templates. In the following we will use only the solar metallicity subsample. The results are shown in panel a) of Fig. 2 (see the distribution of blue and red point in Fig. 2 panel a) for differences between all MILES stars and the solar metallicity subsample.).
Results are consistent for most wavelength regions. We found a lower resolution in the first bin ranging from Å, possibly due to the higher residuals in the fit we found in this wavelength interval. For the stellar population models in particular, this first bin gives a relatively poor resolution of Å FWHM, hence a significantly lower spectral resolution. This wavelength bin is therefore excluded from the analysis.
We also notice a difference between the resolution in the redder and bluer part of the spectrum but with a variation that is negligible within the errors. The median FWHM derived by using Indo-U.S. is 2.26 0.08 Å and 2.31 0.11 Å for stars and stellar population models, respectively. The error was derived as the standard deviation of the 10 values. The median instead of the mean was used in order not to be affected by outliers.
4.2 Template: MARCS library at R=20000
We use all solar metallicity MILES stars and combine them with the theoretical MARCS library selecting the spectra at intervals of T=500 (92 spectra in total). We follow the same procedure as above and we found the same issue for the latest and first wavelength bin in both the stellar spectra and integrated models. The results are shown in panel b) of Fig. 2. The median FWHM is 2.55 0.14 Å and 2.57 0.13 Å for stars and stellar population models, respectively.
4.3 Template: ELODIE v3.1 library at R=42000
We fit MILES solar metallicity stars with ELODIE solar metallicity templates (456 stars). Since ELODIE covers a shorter wavelength range (3950 - 6739 Å) than MILES (3500-7428 Å) we select the MILES spectra between 3950 - 6739 Å. We divided the spectra in 8 wavelength regions instead of 11 to match the bins we used in the two tests described above. Note that even though the use of ELODIE limits our test to a shorter wavelength range, we are still able to cover the most important spectral features to extract the stellar kinematics. The results are shown in panel c) of Fig. 2. The median FWHM we derived by using ELODIE v3.1 is 2.53 0.06 Å and 2.54 0.07 Å for stars and stellar population models, respectively.
4.4 Comparison and discussion
The results we obtained with both the ELODIE and MARCS templates agree well with each other and indicate a resolution of Å FWHM for both MILES stars and the stellar population models based on those stars.
This value is smaller than the nominal value for the MILES resolution of Å FWHM. The resolution obtained by means of the Indo-U.S. library, instead, is consistent with the latter. This implies that the different resolution for MILES found by Sánchez-Blázquez et al. (2006) comes from the different resolution of the underlying template - Indo-U.S. - that was used to derive the resolution. The triple test presented here suggests that the library Indo-U.S. has a coarser spectral resolution than previously thought.
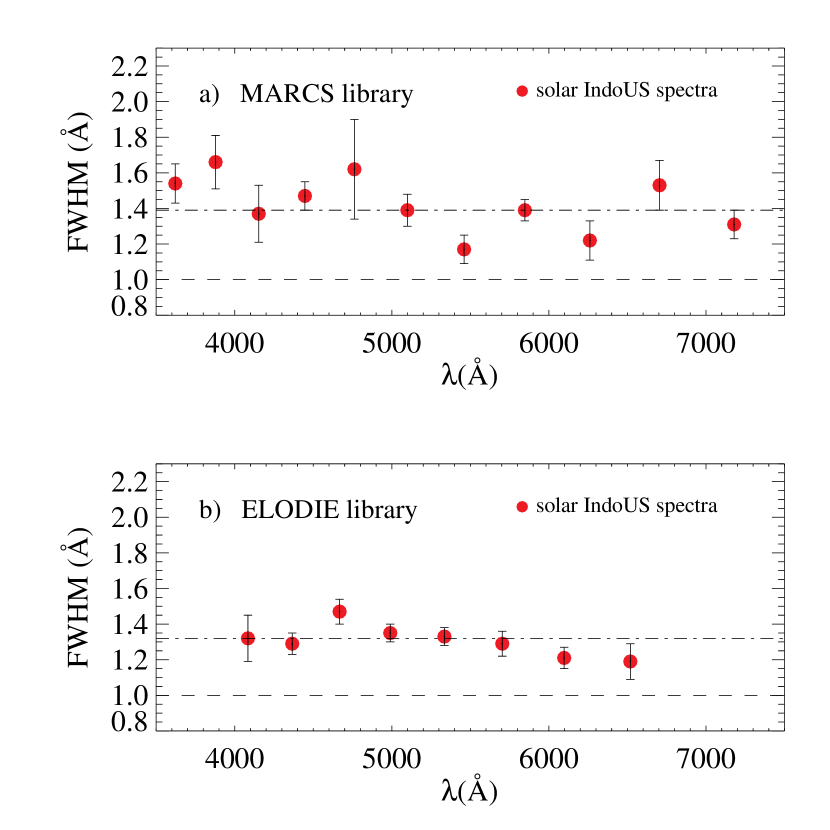
To test this conclusion we re-evaluate the spectral resolution of the Indo-U.S. library following the same procedure as described above. We fitted the solar metallicity Indo-U.S. stars with the two high resolution libraries MARCS and ELODIE. The results are shown in Fig. 3. The resulting median resolution of the Indo-U.S. library turns out to be Å FWHM and Å for the MARCS and ELODIE templates, respectively. This is significantly lower than the Å FWHM value specified in Valdes et al. (2004). We conclude that the spectral resolution derived by Sánchez-Blázquez et al. (2006) for MILES was too high, mainly because the spectral resolution of the library used for the fit was overestimated. The true spectral resolutions of the MILES and Indo-U.S. libraries are Å FWHM and Å FWHM, respectively.
5 Conclusions
Over the last few years, empirical stellar libraries have been extensively used to build stellar population models in combination with theoretical spectra. A very accurate knowledge of the spectral resolution is fundamental to avoid propagation errors and wrong estimation of the intrinsic stellar velocity dispersion of galaxies.
In this research note we report results from tests aimed at verifying the spectral resolution of MILES library and the SSP models based on them. This exercise was done because in Maraston & Strömbäck (2010) and Thomas et al. (2010) it was found that the spectral resolution of stellar population models based on MILES appeared to be somewhat coarser than generally assumed.
We base our test on the comparison of MILES stars with three different sets of templates, one theoretical, from the high-resolution MARCS library, and two empirical, the Indo-U.S. library initially used for assessing the spectral resolution of MILES by (Sánchez-Blázquez et al. 2006) and ELODIE v3.1. The key to our analysis is that the theoretical template has a very high and well-defined resolution, implying that any error on this theoretical value would not affect our conclusion. The MARCS library was crucial to constrain the values of the resolution also for the other two empirical templates.
The results we obtained with both ELODIE and MARCS templates agree very well with each other and indicate a resolution of Å FWHM for both the MILES stars and the stellar population models based on those stars. This is somewhat smaller than the nominal value for the MILES resolution of Å FWHM. We found that the difference is due to the uncertainties on the Indo-U.S. library FWHM. By applying the same method and using ELODIE and MARCS as templates for Indo-US, we find a resulting median resolution of Å FWHM. This implies a significantly lower spectral resolution than the Å FWHM specified in Valdes et al. (2004), which has propagated into the derivation of the MILES spectral resolution.
Acknowledgements.
We are grateful to Harald Kuntschner, Patricia Sánchez-Blázquez, and Jesús Falcón-Barroso for useful discussions. AB, CM and JJ acknowledge support by the Marie Curie Excellence Team Grant UniMass (PI C. Maraston) MEXT-CT-2006-042754 of the Training and Mobility of Researchers programme financed by the European Community.References
- Bruzual & Charlot (2003) Bruzual, G. & Charlot, S. 2003, MNRAS, 344, 1000
- Cappellari & Emsellem (2004) Cappellari, M. & Emsellem, E. 2004, PASP, 116, 138
- Gustafsson et al. (2008) Gustafsson, B., Edvardsson, B., Eriksson, K., et al. 2008, A&A, 486, 951
- Johansson et al. (2010) Johansson, J., Thomas, D., & Maraston, C. 2010, MNRAS, 406, 165
- Kauffmann et al. (2003) Kauffmann, G., Heckman, T. M., White, S. D. M., et al. 2003, MNRAS, 341, 33
- Korn et al. (2005) Korn, A. J., Maraston, C., & Thomas, D. 2005, A&A, 438, 685
- Le Borgne et al. (2003) Le Borgne, J., Bruzual, G., Pelló, R., et al. 2003, A&A, 402, 433
- MacArthur et al. (2009) MacArthur, L. A., González, J. J., & Courteau, S. 2009, MNRAS, 395, 28
- Maraston et al. (2009a) Maraston, C., Nieves Colmenárez, L., Bender, R., & Thomas, D. 2009a, A&A, 493, 425
- Maraston & Strömbäck (2010) Maraston, C. & Strömbäck, G. 2010, MNRAS, submitted
- Maraston et al. (2009b) Maraston, C., Strömbäck, G., Thomas, D., Wake, D. A., & Nichol, R. C. 2009b, MNRAS, 394, L107
- Prugniel & Soubiran (2001) Prugniel, P. & Soubiran, C. 2001, A&A, 369, 1048
- Prugniel et al. (2007) Prugniel, P., Soubiran, C., Koleva, M., & Le Borgne, D. 2007, VizieR Online Data Catalog, 3251, 0
- Sánchez-Blázquez et al. (2006) Sánchez-Blázquez, P., Peletier, R. F., Jiménez-Vicente, J., et al. 2006, MNRAS, 371, 703
- Thomas et al. (2010) Thomas, D., Maraston, C., & Johansson, J. 2010, MNRAS, in press, arXiv:1010.4569
- Tremonti et al. (2004) Tremonti, C. A., Heckman, T. M., Kauffmann, G., et al. 2004, ApJ, 613, 898
- Valdes et al. (2004) Valdes, F., Gupta, R., Rose, J. A., Singh, H. P., & Bell, D. J. 2004, ApJS, 152, 251
- Vazdekis (1999) Vazdekis, A. 1999, ApJ, 513, 224
- Vazdekis et al. (1996) Vazdekis, A., Casuso, E., Peletier, R. F., & Beckman, J. E. 1996, ApJS, 106, 307
- Vazdekis et al. (2010) Vazdekis, A., Sánchez-Blázquez, P., Falcón-Barroso, J., et al. 2010, MNRAS, 404, 1639
- York et al. (2000) York, D. G., Adelman, J., Anderson, Jr., J. E., et al. 2000, AJ, 120, 1579