SN 2010jl in UGC 5189: Yet Another Luminous Type IIn Supernova in a Metal-Poor Galaxy
Abstract
We present All-Sky Automated Survey data starting 25 days before the discovery of the recent type IIn SN 2010jl, and we compare its light curve to other luminous IIn SNe, showing that it is a luminous () event. Its host galaxy, UGC 5189, has a low gas-phase oxygen abundance (), which reinforces the emerging trend that over-luminous core-collapse supernovae are found in the low-metallicity tail of the galaxy distribution, similar to the known trend for the hosts of long GRBs. We compile oxygen abundances from the literature and from our own observations of UGC 5189, and we present an unpublished spectrum of the luminous type Ic SN 2010gx that we use to estimate its host metallicity. We discuss these in the context of host metallicity trends for different classes of core-collapse objects. The earliest generations of stars are known to be enhanced in [O/Fe] relative to the Solar mixture; it is therefore likely that the stellar progenitors of these overluminous supernovae are even more iron-poor than they are oxygen-poor. A number of mechanisms and massive star progenitor systems have been proposed to explain the most luminous core-collapse supernovae. Any successful theory that tries to explain these very luminous events will need to include the emerging trend that points towards low-metallicity for the massive progenitor stars. This trend for very luminous supernovae to strongly prefer low-metallicity galaxies should be taken into account when considering various aspects of the evolution of the metal-poor early universe, such as enrichment and reionization.
1 Introduction
The bright SN 2010jl, discovered on UTC 2010 November 3.5 (Newton & Puckett, 2010) was classified as a type IIn supernova (Benetti et al., 2010; Yamanaka et al., 2010). A possible luminous blue progenitor has been identified in archival HST WFPC2 data (Smith et al., 2010b). If this detection is of a massive compact cluster, the turnoff mass is constrained to be M⊙. If it is a single star, it is either a massive Carinae-like star or something fainter that has been caught in an LBV-like eruption phase, possibly a precursor explosion. Spectropolarimetric observations indicate possible asymmetry in the explosion geometry and limit the amount of dust in the progenitor environment (Patat et al., 2010).
Prieto & Stanek (2010) point out that the supernova’s host galaxy, UGC 5189, has been shown to be metal-poor based on a spectrum obtained by the SDSS survey a few arcseconds away from the site of the supernova. It is included in the Tremonti et al. (2004) DR4 catalog of galaxy metallicities, which estimates dex based on strong recombination and forbidden emission lines in the spectrum. Pilyugin & Thuan (2007) estimate dex from the same spectrum based on the “direct” photoionization-based abundance method using an estimate of the electron temperature () from the [O III]Å auroral line.
Throughout this paper, as above, we will adopt O/H as a proxy for the “metallicity” of the host galaxy, because only gas-phase oxygen abundance estimates are available. In Section 4 we will discuss how this relates to total metal abundance and iron abundances.
There is mounting evidence showing that the majority of the most optically luminous supernovae explode in low-luminosity, star-forming galaxies, which are likely to be metal-poor environments. Circumstantial evidence comes from the fact that most of these objects have been discovered in new rolling searches that are not targeted to bright galaxies, even though they were bright enough to be discovered in galaxy-targeted searches (the only exception is the recently discovered SN 2010jl). Some of the rolling searches that are discovering the most energetic supernovae include the Texas Supernova Search (TSS; Quimby, 2006), the Catalina Real-Time Transient Survey (CRTS; Drake et al., 2009), the Palomar Transient Factory (PTF; Rau et al., 2009), and the Panoramic Survey Telescope & Rapid Response System (Pan-STARRS). Neill et al. (2010) find that luminous SNe occur predominantly in the faintest, bluest galaxies. Li et al. (2010) find that SNe IIn may preferentially occur in smaller, less-luminous, later-type galaxies than SNe II-P. The mass-metallicity relationship implies that such small, faint galaxies should tend to be low-metallicity (Tremonti et al., 2004).
Kozłowski et al. (2010) presented the first host galaxy luminosity vs. oxygen abundance diagram with a small sample of three energetic type IIn and type Ic core-collapse supernovae (CCSNe) compiled from published work in the literature (two objects) and new data for SN 2007va. These initial results suggest that the host galaxy environments of the most energetic CCSNe are on average metal-poor (metallicities ) compared to the bulk of star-forming galaxies in SDSS, and are similar in metallicity to the hosts of local GRBs (Stanek et al., 2006). It has now been well-established that long GRBs are accompanied by broad-line type Ic SNe (e.g. Stanek et al., 2003), firmly connecting these very energetic explosions to the deaths of massive stars. In contrast, luminous type IIn SNe are not shown to be connected with local GRBs (although see Germany et al., 2000; Rigon et al., 2003). The sample of luminous supernovae with measured abundances is small and incomplete because only some of the brightest host galaxies have been targeted, which hinders the interpretation and comparison of the results.
In this paper we expand this sample with metallicities of the hosts of SN 2010gx and SN 2010jl and put all metallicity measurements on a common scale to confirm the emerging trend that these optically luminous core-collapse events appear to occur in low-metallicity or low-luminosity hosts.
2 Observations
2.1 Photometry
Photometric data were obtained with the 10-cm All-Sky Automated Survey (ASAS) North telescope in Hawaii (Pojmanski, 2002; Pigulski et al., 2009). These data were processed with the reduction pipeline described in detail in Pojmanski (1998, 2002). The magnitudes are tied to the Johnson scale using Tycho (Høg et al., 2000) and Landolt (Landolt, 1983) standard stars. The magnitudes were calibrated using transformed SDSS DR7 (Abazajian et al., 2009) magnitudes of standards in the field. The magnitudes were measured using aperture photometry with a 2 pixel (30 arcsec) aperture radius. We subtract the contribution from the host galaxy measuring the median magnitude of the host in the same aperture using all archival ASAS images before the supernova, which give mag and mag.
We obtained images of SN 2010jl with the SITe-3 CCD camera mounted on the Swope 1-m telescope at Las Campanas Observatory on three consecutive nights from UT November 2010. The images were reduced with standard tasks in the IRAF111IRAF is distributed by the National Optical Astronomy Observatory, which is operated by the Association of Universities for Research in Astronomy (AURA) under cooperative agreement with the National Science Foundation. ccdproc package. The data were flat-fielded using domeflats obtained for images and twilight skyflats for -band images. We applied a linearity correction using the prescription and coefficients from Hamuy et al. (2006). The photometry of the supernova was obtained using aperture photometry and a radius aperture with the phot task in IRAF. The magnitudes were calibrated using field stars with SDSS DR7 photometry, converted to standard magnitudes through standard equations on the SDSS website. We subtracted the contribution from the host galaxy fluxes measuring the magnitudes in the same aperture using the pre-explosion SDSS images. In Table 1 we gather all optical photometry presented in this paper.
| HJD | U | B | V | R | I | Telescope / | |||||
|---|---|---|---|---|---|---|---|---|---|---|---|
| -2450000 | (mag) | (mag) | (mag) | (mag) | (mag) | Instrument | |||||
| 5479.14 | 13.79 | 0.10 | ASAS | ||||||||
| 5484.13 | 13.73 | 0.10 | 13.28 | 0.10 | ASAS | ||||||
| 5488.12 | 13.67 | 0.10 | 13.09 | 0.10 | ASAS | ||||||
| 5493.14 | 13.73 | 0.10 | ASAS | ||||||||
| 5494.12 | 13.00 | 0.10 | ASAS | ||||||||
| 5504.10 | 13.78 | 0.10 | 13.10 | 0.10 | ASAS | ||||||
| 5509.10 | 13.86 | 0.10 | ASAS | ||||||||
| 5509.13 | 13.18 | 0.10 | ASAS | ||||||||
| 5515.75 | 13.83 | 0.05 | 14.24 | 0.05 | 13.46 | 0.05 | 13.85 | 0.05 | 13.19 | 0.05 | Swope |
| 5516.75 | 13.83 | 0.05 | 14.26 | 0.05 | 13.45 | 0.05 | 13.87 | 0.05 | Swope | ||
| 5517.13 | 13.28 | 0.10 | ASAS | ||||||||
| 5517.75 | 13.86 | 0.05 | 14.26 | 0.05 | 13.87 | 0.05 | 13.20 | 0.05 | Swope |
2.2 Spectroscopy
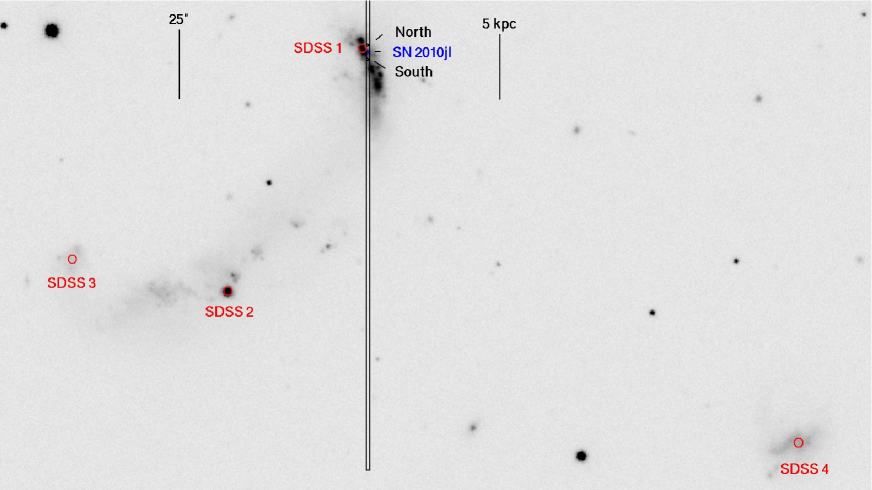
Spectra were obtained on November 5 and November 11 2010 with the Ohio State Multi-Object Spectrograph (OSMOS, Martini et al., 2011; Stoll et al., 2010) on the 2.4-m Hiltner telescope. The OSMOS slit was oriented N/S. Although the instrument supports a 20 arcmin longslit, we observed the target with the CCD readout in a subframe that limited the effective slit length to 5 arcmin to reduce the readout time. A schematic of the slit coverage on the field is shown in Figure 1. The 1.2 arcsec slits we used in the OSMOS observations are shown with black rectangles. The irregular galaxy has four archival SDSS spectra; the locations of the SDSS fiber apertures are shown with red circles.
 |
We processed the raw CCD data using standard techniques in IRAF, including cosmic ray rejection using L.A.Cosmic (van Dokkum, 2001). Each source was extracted individually with apall, extracting a sky spectrum simultaneously. The range of extraction apertures was pixels, corresponding to arcsec, or kpc at the distance of UGC 5189. With the 1.2 arcsec slit used in our observations, the OSMOS VPH grism provides at 5000 Å. The red slit position we used provides a wavelength coverage of Å. Wavelength calibration was done with Ar arclamp observations, and a spectrophotometric standard from Oke (1990) was observed each night, with which we performed relative flux calibrations.
The top panel of Figure 2 shows a spectrum of SN 2010jl obtained on Nov. 5. Taking advantage of the N/S slit, we extract host galaxy spectra centered arcsec on either side of the SN, corresponding to kpc at the distance of UGC 5189. In Section 3.2 we use strong-line abundance diagnostics on these host galaxy spectra to estimate the gas-phase oxygen abundances of the progenitor environment.
 |
We also present in this paper a previously unpublished spectrum of the luminous () type Ic SN 2010gx (Pastorello et al., 2010) obtained with the WFCCD imager and spectrograph on the du Pont 2.5-m telescope at Las Campanas Observatory using a longslit mask (slit width ) and the 300 l/mm grism. We obtained -sec spectra on three consecutive nights (UT March 2010), or days (rest frame) prior to the -band peak. The WFCCD data were reduced using standard tools in IRAF. We derived the wavelength solutions with HeNeAr arclamps obtained after each spectrum and did independent relative flux calibration using spectrophotometric standards observed each night. The final spectrum in Figure 3 is a combination of the three individual exposures, obtained in order to increase the S/N. The spectrum covers the wavelength range Å and has a FWHM resolution of Å. Assuming a Galactic reddening law with , the total -band extinction was estimated to be mag using the ratio of H to H fluxes and correcting to the theoretical case-B recombination value of 2.85. The spectrum was corrected for this reddening before calculating line ratios. The continuum was subtracted locally to each emission line before measuring the flux; the effect of the SN contamination on the metallicity determination should be small. We estimate the oxygen abundance to be using the diagnostic of Kobulnicky & Kewley (2004), which uses ([O II][O III])/H and ([O III][O III][O II]. These are highly sensitive to reddening, so the correction is crucial. (In subsequent discussion we convert this metallicity to the scale of Pettini & Pagel (2004) for uniformity.)
 |
3 Results and analysis
3.1 SN 2010jl light curve
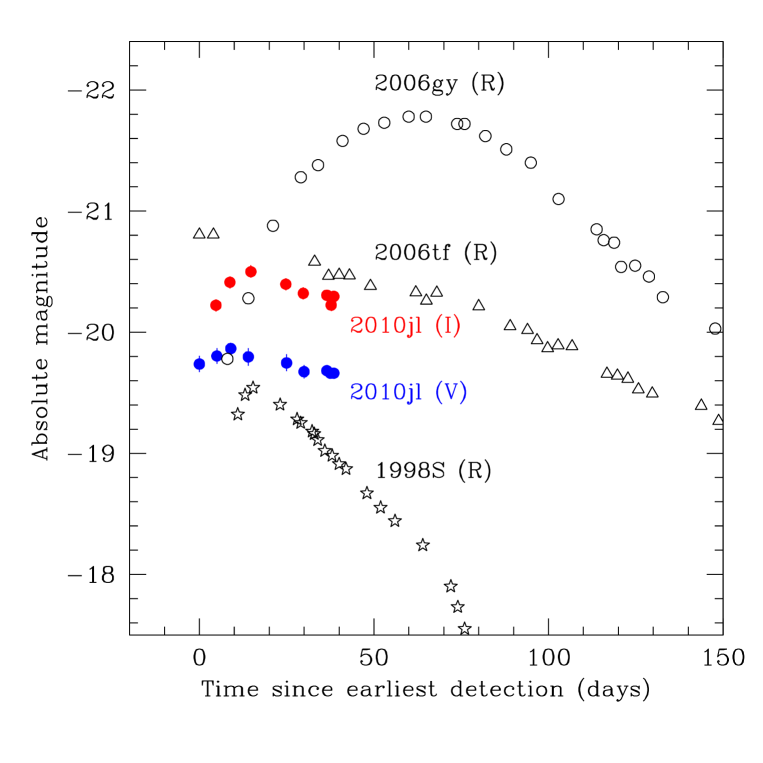
The ASAS light curves of SN 2010jl include several pre-peak observations beginning 25 days before discovery. We plot them in Figure 4 along with the and -band Swope data. For comparison, we plot -band light curves from the literature of the ultraluminous SN 2006gy (Smith et al., 2007) and SN 2006tf (Smith et al., 2008), and the luminous type IIn SN 1998S (Fassia et al., 2000). UGC 5189 was behind the Sun and unobservable prior to the first ASAS observations. The color of the supernova changed from mag at the epoch of ASAS discovery to mag at the latest epochs. The photometry from Swope is consistent with a K blackbody, as Smith et al. (2010b) conclude from a fit to the spectrum. The normal range for peak luminosities of type IIn SNe is (Kiewe et al., 2010). The pre-discovery ASAS data constrain the peak luminosity of SN 2010jl (, ), placing it firmly in the class of luminous (peak ) type IIn supernovae.
 |
3.2 Metallicity near SN 2010jl
We use the empirical O3N2 and N2 diagnostics of Pettini & Pagel (2004) and the theoretical and empirical N2 diagnostic of Denicoló et al. (2002) to determine the metallicity of the OSMOS-observed H II regions south and north of SN 2010jl. We choose these diagnostics based on the S/N and wavelength coverage of our observations. The N2 diagnostic of Pettini & Pagel (2004) and of Denicoló et al. (2002) each depend solely on [N II]/H. This ratio is very insensitive to reddening due to the proximity of the lines. The O3N2 diagnostic of Pettini & Pagel (2004) also depends on [O III]/H, another closely-spaced pair of lines. Although we do not correct these spectra for reddening, any reddening effect is very small compared to the scatter in each abundance diagnostic. For subsequent analysis in Section 3.4, we convert metallicities of other galaxies determined using other diagnostics to these scales to enable direct comparison, using the empirical conversions of Kewley & Ellison (2008).
For the galactic H II regions arcsec ( kpc) south and north of the SN site, using the Pettini & Pagel (2004) O3N2 diagnostic, we find dex. Using the N2 diagnostic, we find dex for the H II region north of the SN and dex for the one to the south. Using the Denicoló et al. (2002) diagnostic, we find dex and dex for the north and south regions, respectively.
Our estimates of the oxygen abundance are consistent with previously published estimates for UGC 5189 based on the SDSS spectrum from arcsec ( kpc) to the northeast of the SN site. Tremonti et al. (2004) report dex for this galaxy, based on strong recombination and forbidden emission lines. Pilyugin & Thuan (2007) report dex from the same spectrum based on direct electron temperature using the [O III] auroral line. For our analysis in Section 3.4 we convert the Tremonti et al. (2004) metallicities, but for lack of an established empirical conversion, we omit the Pilyugin & Thuan (2007) metallicities.
3.3 Metallicity elsewhere in the host galaxy
There are two other SDSS spectra of the galaxy (see Figure 1), including a bright point source in the south, approximately 20 kpc from the location of the supernova, marked in Figure 1 as SDSS 2. Pilyugin & Thuan (2007) report dex for this spectrum. The detection of He II Å indicates that the ionizing continuum is hard (e.g. Garnett et al., 1991), outside the regime where the Pettini & Pagel (2004) and Denicoló et al. (2002) diagnostics are valid. Brinchmann et al. (2008) include this spectrum in their SDSS-based study of nearby galaxies with Wolf-Rayet features. Tremonti et al. (2004) do not fit a metallicity to this spectrum despite the high S/N, presumably because of the peculiar line ratios.
The other SDSS spectrum is of the eastern-most clump of UGC 5189, approximately 30 projected kpc from the location of the supernova (marked in Figure 1 as SDSS 3). Neither Tremonti et al. (2004) or Pilyugin & Thuan (2007) derive metallicities from this spectrum, which has lower S/N. We find dex with all three line ratio diagnostics using the SDSS spectrum.
Approximately 40 projected kpc from SN 2010jl is another blue galaxy at the same redshift (0.0106), which also has an SDSS spectrum, marked in Figure 1 as SDSS 4. The redshift of the spectrum from the supernova site is 0.0107; these redshifts are consistent within the estimated 0.0001 redshift error for this lower S/N spectrum. From the shape and orientation of the wildly irregular UGC 5189, it seems very likely that this neighbor is a part of the interacting system. Using the SDSS spectrum, we find dex with both Pettini & Pagel (2004) diagnostics and dex with Denicoló et al. (2002).
UGC 5189 appears to be a high-mass, metal-poor outlier from the mass-metallicity relationship (e.g. Peeples et al., 2009). Such similar metallicity measurements from widely spaced locations and widely varying diagnostics provide reassurance that there are no significant metallicity variations in UGC 5189, and that the three metallicity measurements described in Sec. 3.2 from a kpc or more away from the supernova site are likely to well-describe the supernova progenitor region. All evidence points toward a SN 2010jl metallicity of Z⊙.
3.4 Host metallicity trends
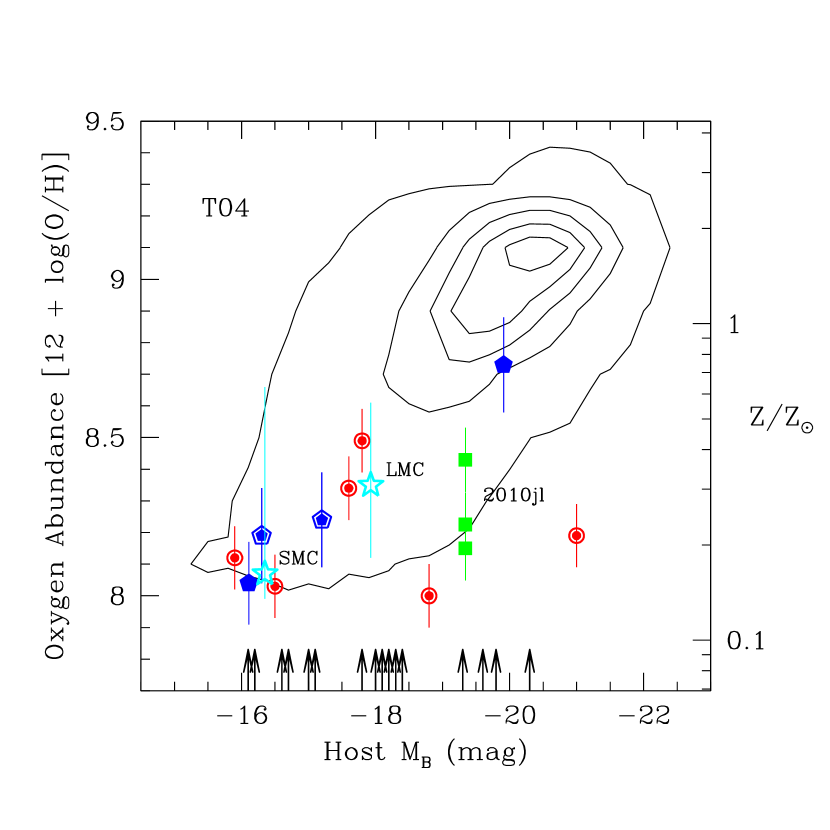
The low metallicity of the host of SN 2010jl is another confirmation of the emerging trend of low-metallicity hosts of very luminous supernovae (Kozłowski et al., 2010). In Figure 5 we show this trend for SN 2010jl (green squares) and other luminous SNe (blue pentagons; SN 2003ma, SN 2007bi, SN 2007va, and SN 2010gx). The oxygen abundance measurement for the host of SN 2010gx was obtained from our own spectroscopic observations, which we present here. The luminous supernovae without detected hydrogen (SN 2010gx and SN 2007bi) are indicated with double pentagons. We plot three metallicity measurements for the the host region of SN 2010jl with green squares: two from our OSMOS spectra of the regions 1 kpc north and south of the supernova and one from the SDSS spectrum 1 kpc northeast of the supernova; the value from strong line fitting published by Tremonti et al. (2004). We cannot convert the Pilyugin & Thuan (2007) measurement of 8.3 to the scale of the Pettini & Pagel (2004) N2 diagnostic and so to maintain a strictly uniform abundance scale we do not plot it here. All four are consistent to within the errors, indicating that there is no strong metallicity variation in the area and that the strong line diagnostics are well-behaved and not in the poorly-calibrated regime of very hard radiation fields. For comparison, we also plot contours showing the distribution of the measured SDSS galaxy metallicities from Tremonti et al. (2004). We also plot for comparison the medians and ranges of nebular abundances measured in the LMC and SMC with strong line diagnostics from H II flux ratios reported by Russell & Dopita (1990) and absolute B magnitudes from Karachentsev (2005). We stress that the actual range in the LMC and SMC metallicities is likely lower than the range given by applying the Pettini & Pagel (2004) N2 diagnostic to these H II regions; there is a fairly large scatter inherent in the diagnostic. We plot six low- GRB/SN hosts (red circles) to show the similarity in metallicity trends for luminous SNe and GRB hosts (Chornock et al., 2010; Levesque et al., 2010a).
For high-luminosity SNe which do not yet have direct host metallicity measurements, we plot arrows at the host absolute magnitudes or at the upper limit the host absolute magnitude (from left to right: SN 2005ap, SN 2006tf, SN 2008fz, SN 2005gj, PTF 10hgi, SN 2008es, PTF 10heh, PTF 09cnd, SCP06F6, PTF 10vqv, SN 2009jh, SN 1999as, PTF 09atu, and SN 2006gy). By comparing the distribution of these to the Tremonti et al. (2004) contours, it is clear that the host galaxies of these luminous SNe are in fainter galaxies. Neill et al. (2010) have also shown that the host galaxies of the most luminous SNe are the faintest, bluest galaxies. These hosts for which the metallicity have not yet been determined themselves provide support for the low-metallicity trend among luminous SNe hosts, because the faintest galaxies tend to be the most metal-poor (e.g. Tremonti et al., 2004).
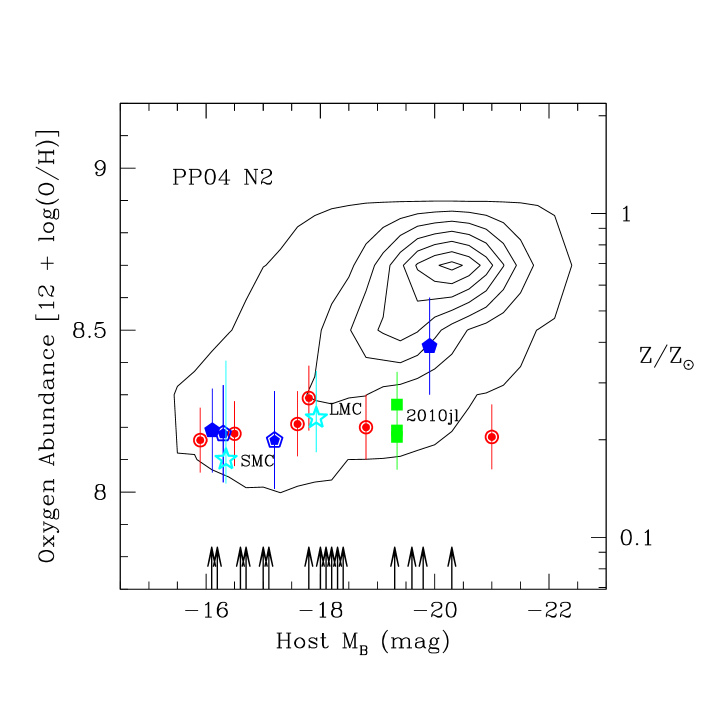 |
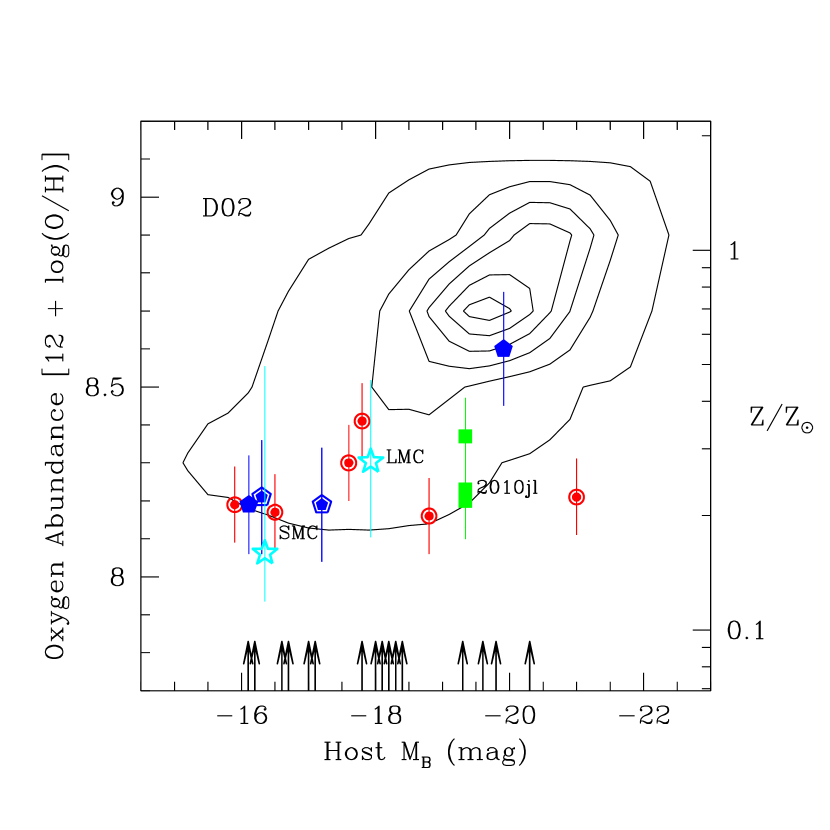
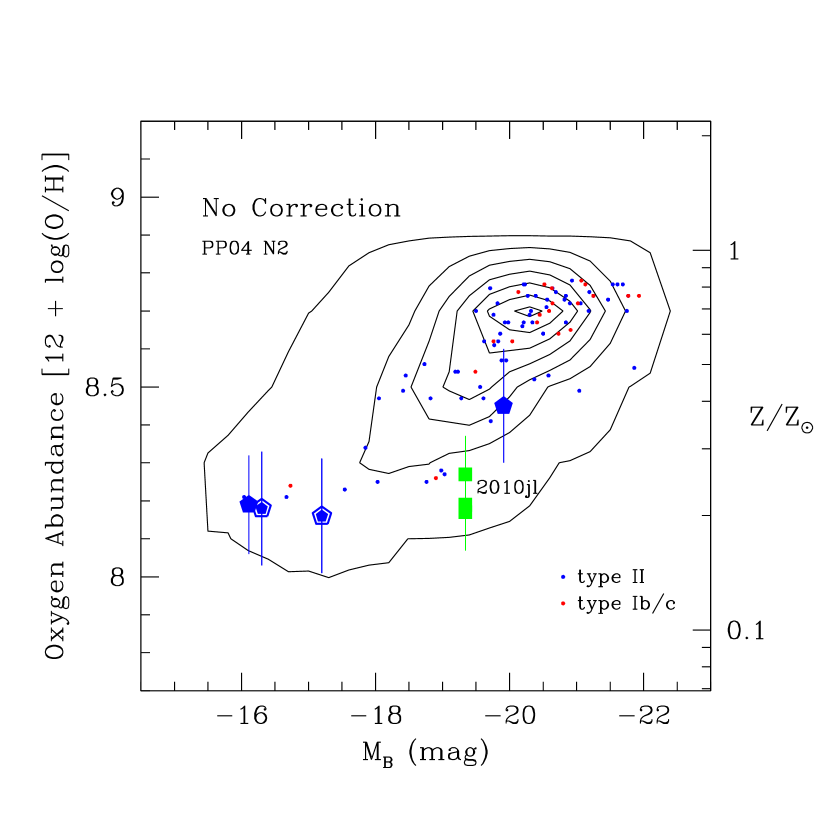
These metallicity determinations were made with a number of different diagnostics, and so we have converted all to a single scale using the empirical conversions of Kewley & Ellison (2008). To emphasize that the low-metallicity trend is not an artifact of the particular common scale we choose, we plot the same thing on two different scales, that of the N2 diagnostic of Pettini & Pagel (2004) in Figure 5 and that of Denicoló et al. (2002) and Tremonti et al. (2004) in Figure 6. These were chosen to avoid a gap in the range where the Kewley & Ellison (2008) conversions from Tremonti et al. (2004) are valid. Slightly under 2% of the galaxies plotted have Tremonti et al. (2004) metallicities outside the 8.05–9.2 span where the Kewley & Ellison (2008) conversions are valid (mostly ), and these are excluded from the contour plot; the flat contour at the top of each plot is due to this exclusion. In Figure 6, we approximated the Kewley & Dopita (2002) metallicity of GRB020903 as 8.1 instead of in order for the Kewley & Ellison (2008) conversion to be valid, and averaged the converted metallicities from the N2 scale of Pettini & Pagel (2004) and Denicoló et al. (2002) for the LMC, the SMC, and the north and south galaxy regions of the host of SN 2010jl observed by OSMOS. On each of these three scales, the low-metallicity trend is clear.
  |
Prieto et al. (2008) found that SN Ib/c occur more frequently in higher-metallicity galaxies compared to SN II and SN Ia. The highly luminous SNe we show in Figure 5 appear to show a larger bias towards low-metallicity hosts than normal SN Ib/c. For comparison, in Figure 7 we plot host metallicities for type II and type Ib/c SNe that have hosts that have SDSS spectra and are in the redshift range . We caution that these SNe are from many different surveys, each of which has its own selection biases. On the left, the galactic metallicities are provided as observed, in the central three arcseconds of the galaxy. On the right, they have been approximately corrected to the position of the supernova for the expected metallicity gradient often observed in similar galaxies. We use an empirical formula for the metallicity gradient in dex/kpc as a function of absolute magnitude of the host galaxy that is derived from the data published in Moustakas & Kennicutt (2006). We assume that dwarf galaxies with mag are chemically homogeneous, and we assume no correction to the metallicity for supernovae within the 1.5 radius of the SDSS fiber.
 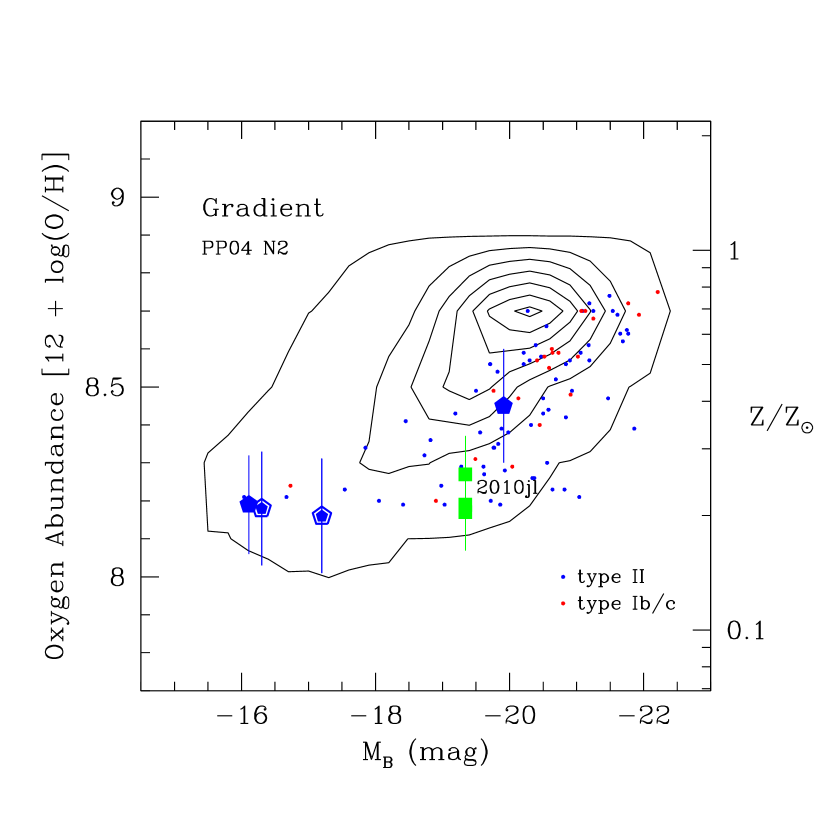 |
To roughly quantify the difference, we performed KS tests and found that for the naive (and likely incorrect) assumption of uniform selection, the probability of the luminous SNe and the type II or type Ib/c SNe progenitor regions being drawn from the same distribution in metallicity ranges from to . Given the very different selection functions of these samples, though, this is in no way statistically rigorous, and should merely be taken as thought-provoking. Some related results have been recently shown to hold for homogeneous and untargeted samples; Arcavi et al. (2010) show that there is a significant excess of SNe IIb in dwarf hosts, and that while normal SNe Ic dominate in giant galaxies, all type I core-collapse events in dwarf galaxies are type Ib or broad-lined type Ic.
4 Discussion
The metallicity of the hosts of SN 2010jl and SN 2010gx support and strengthen the emerging trend that luminous supernovae occur preferentially in metal-poor hosts. This result suggests that luminous SNe have low-metallicity progenitors. It is an interesting parallel to the similar trend observed for the hosts of long GRBs. The trend is not an artifact of which metallicity diagnostic is chosen for the host galaxies.
The relative iron abundance of these metal-poor hosts is expected to be even lower than suggested by the oxygen abundance that we use as a proxy for metallicity. At low metallicity, -elements like oxygen are enhanced relative to iron, compared to the solar mixture. In the galactic disk and halo, at [Fe/H] , [O/Fe] is approximately inversely proportional to [Fe/H], while below [Fe/H] = , the relationship flattens out at a constant (and lower) relative iron abundance (e.g Tinsley, 1979; McWilliam, 1997; Johnson et al., 2007). The iron abundance is more fundamentally important for the late-stage evolution of massive stars because iron provides much of the opacity for radiation-driven stellar winds (e.g. Pauldrach et al., 1986; Vink & de Koter, 2005). By using oxygen abundance as a metallicity tracer, we are in fact underestimating the magnitude of the effect of low-metallicity on mass-loss. If there is a threshold in iron abundance for certain types of luminous SNe, the observed effect in oxygen abundance will be less pronounced. The substantial preference we see for these SNe to occur in hosts with low nebular abundance of oxygen points to a more stringent constraint in iron abundance.
Nebular oxygen abundances determined by electron temperature methods appear to track the stellar abundances of massive young stars very closely, as Bresolin et al. (2009) demonstrate by comparing the gas-phase metallicity gradient from H II regions to the gradient in stellar abundances in NGC 300, so the gas-phase oxygen abundances we discuss should well characterize the stellar abundances of the massive young progenitors of these supernovae.
A number of observational results for normal SN Ib/c and SN II support a change in their number ratios as a function of metallicity. In an early study, Prantzos & Boissier (2003) used the absolute magnitudes of supernova host galaxies as a proxy for their average metallicities from the luminosity-metallicity relationship, and found that the number ratio of normal SN Ib/c to SN II increases with metallicity. Prieto et al. (2008) took advantage of the large sample of well-observed and typed supernovae in the literature with star-forming host galaxies that have high S/N spectra obtained by the Sloan Digital Sky Survey (SDSS). They found strong evidence that normal SN Ib/c, dominated in rates by SN Ic, occur more frequently in higher-metallicity galaxies compared to SN II and SN Ia. Recently, Modjaz et al. (2010) found that the local metallicity of the hosts of SN Ic is on average higher than for hosts of SN Ib (but see Anderson et al., 2010). All these results are consistent with state-of-the-art stellar evolution models of massive stars with rotation, either single or in binaries (e.g. Eldridge et al., 2008; Georgy et al., 2009, 2010).
Studies of local and cosmological long-duration GRBs find that their host galaxies have low metallicity compared to the general population of star-forming galaxies and other CCSNe. These results help put constraints on progenitor models and the physics of production of the GRB jet, and they have fundamental implications for the use of GRBs as star-formation tracers at high redshift (e.g. Kistler et al., 2009). Fruchter et al. (2006) initially pointed out that the host environments of cosmological GRBs were different from CCSNe, with GRBs being hosted by strongly star-forming dwarf galaxies (see also Le Floc’h et al., 2003). Stanek et al. (2006) compared direct host metallicity measurements of five local GRBs with those of star-forming galaxies in SDSS, and found that long GRBs prefer low-metallicity environments. This result has recently been confirmed using a larger sample of events (Levesque et al., 2010b). Modjaz et al. (2008) used direct host galaxy metallicity estimates to study nearby broad-lined SN Ic. They find that the metallicities of hosts of SN Ic without GRB are higher than the metallicities of hosts of SN Ic associated with GRBs.
4.1 Luminous supernovae
One of the most surprising results of the new transient surveys that are monitoring many square degrees of the sky every few nights has been the discovery of very luminous supernovae in the nearby Universe that are times more luminous than normal core-collapse supernovae and can release ergs in UV-optical light.
The first events of this kind were SN 2005ap (Quimby et al., 2007) and SN 2006gy (Smith et al., 2007), discovered by TSS. Their light curves, spectral properties, and environments are remarkably different, although they both share extreme energetics compared to normal CCSNe. SN 2005ap was discovered in a low-luminosity galaxy at z = 0.28. It showed a relatively fast evolution in its light curve, but with an extreme peak absolute magnitude of mag never before seen in a supernova. The spectra had very broad features that were mainly associated with CNO events. The absence of hydrogen in the spectrum, the features at high velocity, and the extreme energetics led Quimby et al. (2007) to propose that SN 2005ap could be associated with long GRBs, which connected this event with a high-mass progenitor star.
SN 2006gy was discovered close to the center of a nearby (z = 0.02) S0 galaxy with recent star formation. Its spectrum and light curve were similar to type IIn SNe, but they were much more extreme, with a peak absolute magnitude of and clear signs of interaction between the supernova ejecta and a massive, hydrogen-rich circumstellar shell. This led Smith et al. (2007) to propose that the progenitor of SN 2006gy had been a very massive star (initial mass M⊙) similar to the well-studied galactic Luminous Blue Variable (LBV) -Carinae. The explosion mechanism of SN 2006gy might be explained by the pulsational pair-instability model (Woosley et al., 2007).
van Marle et al. (2010) explore possible models for luminous type IIn SNe, and find within the parameter space that they explore that sustained high luminosity requires massive circumstellar shells. Metzger (2010) consider interaction with a relic protostellar disk, finding that when the disk is massive and compact and the cooling time is long compared to the expansion timescale, more of the energy is radiated in the optical, which they suggest is a possible explanation of luminous type IIn events. Murase et al. (2010) explore potential consequences of such interactions with circumstellar shells for the production of gamma rays and neutrinos.
If LBV-like stars are the progenitors of these extremely luminous supernovae, that does not constrain them to live in high-metallicity environments; LBVs have been identified in galaxies with (Izotov & Thuan, 2009; Herrero et al., 2010). The progenitor of the luminous type IIn SN 2010jl is constrained by Smith et al. (2010b) be a massive LBV, a less massive object temporarily experiencing an LBV-like eruption in a precursor explosion, or a member of a compact, massive cluster with turnoff mass M⊙. The progenitors of two less luminous type IIn events have been identified. One of these, SN 2005gl, occurred in a region with gas-phase metallicity of , and its progenitor was identified as an LBV with (Gal-Yam & Leonard, 2009). The other, SN 1961V, a low-metallicity, normal-luminosity type IIn (Kochanek et al., 2010; Smith et al., 2010a), had a progenitor with , which must have been greater than M⊙ at the time of explosion to retain any hydrogen (Kochanek et al., 2010).
Since the discovery of SN 2005ap and SN 2006gy, there have been several very energetic supernovae (peak ) discovered by different surveys out to redshift . We present a list in Table 2; we include whether each event is classified as type I (without hydrogen) or type II (with hydrogen). Many host absolute B magnitudes are converted and errors might be mag or larger. The new discoveries include objects with a variety of properties. Some events are similar to SN 2005ap, including SCP06F6, PTF 09cnd, PTF 09atu, and SN 2009jh (Quimby et al., 2009), SN 2010gx (Mahabal et al., 2010; Quimby et al., 2010b; Mahabal & Drake, 2010; Pastorello et al., 2010), PTF 10hgi (Quimby et al., 2010c), and PTF 10vqv (Quimby et al., 2010d), and to SN 2006gy, including SN 2003ma (Rest et al., 2009), SN 2005gj (Aldering et al., 2006; Prieto et al., 2007), SN 2006tf (Smith et al., 2008), SN 2008es (Miller et al., 2009; Gezari et al., 2009), SN 2008fz (Drake et al., 2010), and PTF 10heh (Quimby et al., 2010a). Others are more similar to broad-lined SN Ic in spectroscopic properties, but with extreme luminosity, such as SN 1999as and SN 2007bi (Gal-Yam et al., 2009). We also include a unique event, SN 2007va, that was completely enshrouded in its own circumstellar dust and only observable at mid-infrared wavelengths; its infrared luminosity indicated high reprocessed optical luminosity (Kozłowski et al., 2010). The most recent example (and nearest, at ) is the type IIn SN 2010jl, the main subject of this paper. The variety of observed properties in these luminous CCSNe likely represents different explosion mechanisms (e.g. normal collapse of the core vs. pair instability vs. pulsational pair-instability), different mechanisms that power the energetics of the light curves (e.g. circumstellar interaction vs. radioactive decay vs. magnetar spindown), and different progenitor mass-loss histories and masses (e.g. LBV vs. Wolf-Rayet stars vs. red supergiants).
| SN Name | RA | Dec | SN Spectral | Redshift | (host) | Host Metallicity? |
|---|---|---|---|---|---|---|
| (J2000.0) | (J2000.0) | Type | (mag) | (12+log[O/H], PP04N2) | ||
| SN 1995av | 02:01:36.7 | 03:38:55 | IIn | 0.3 | No | |
| SN 1997cy | 04:32:54.8 | –61:42:57 | IIn | 0.063 | No | |
| SN 1999as | 09:16:30.8 | +13:39:02 | Ic | 0.13 | No | |
| SN 1999bd | 09:30:29.2 | +16:26:08 | IIn | 0.151 | No | |
| SN 2000ei | 04:17:07.2 | +05:45:53 | IIn | 0.600 | No | |
| SN 2003ma | 05:31:01.9 | –70:04:16 | IIn | 0.29 | ||
| SN 2005ap | 13:01:14.8 | +27:43:31 | Ic? | 0.28 | No | |
| SN 2005gj | 03:01:12.0 | +00:33:14 | Ia/IIn | 0.06 | -16.7 | No |
| SCP06F6 | 14:32:27.4 | +33:32:25 | Ic? | 1.19 | No | |
| SN 2006gy | 03:17:27.0 | +41:24:20 | IIn | 0.02 | No | |
| SN 2006tf | 11:56:49.1 | +54:27:26 | IIn | 0.07 | No | |
| SN 2007bi | 13:19:20.2 | +08:55:44 | Ic | 0.13 | ||
| SN 2007va | 14:26:23.2 | +35:35:29 | IIn? | 0.19 | ||
| SN 2008am | 12:28:36.2 | +15:34:49 | IIn | 0.234 | No | |
| SN 2008es | 12:46:15.8 | +11:25:56 | IIL | 0.21 | No | |
| SN 2008fz | 23:16:16.6 | +11:42:48 | IIn | 0.13 | No | |
| PTF 09atu | 16:30:24.6 | +23:38:25 | Ic? | 0.50 | No | |
| PTF 09cnd | 16:12:08.9 | +51:29:16 | Ic? | 0.26 | No | |
| SN 2009jh | 14:49:10.1 | +29:25:11 | Ic? | 0.35 | No | |
| SN 2010gx | 11:25:46.7 | –08:49:41 | Ic? | 0.23 | ||
| PTF 10heh | 12:48:52.0 | +13:26:24.5 | IIn | 0.34 | No | |
| PTF 10hgi | 16:37:47.0 | +06:12:32.3 | Ic? | 0.10 | No | |
| PTF 10vqv | 03:03:06.8 | –01:32:34.9 | Ic? | 0.45 | No | |
| SN 2010jl | 09:42:53.3 | +09:29:41.8 | IIn | 0.01 |
4.2 Metallicity diagnostics
The forbidden and recombination lines in the optical spectra of star-forming galaxies provide the observables needed to estimate chemical abundances, star-formation rates, and other physical properties of the H II regions, like electron temperature and density. These emission lines are produced by collisional excitation and recombination processes in gaseous nebulae where massive ( M⊙) stars form, thanks to the interactions of the ionizing UV photons provided by the stars and the surrounding gas (e.g. Osterbrock & Ferland, 2006).
There is a vast literature on a number of techniques that have been developed over the last three decades to estimate the oxygen abundances and physical conditions of H II regions in star-forming galaxies (e.g. Kewley & Ellison, 2008, and references therein). The methods can be divided into four different categories: direct (uses an estimate of the electron temperature measured from the faint [O III]Å auroral line), empirical (e.g. Pettini & Pagel, 2004), theoretical (e.g. Kobulnicky & Kewley, 2004), and a combination of empirical and theoretical (e.g. Denicoló et al., 2002). All these methods are based on high S/N measurements of the line ratios of different combinations of emission lines from ions present in the optical region of the spectrum (Å): [O II], [O III], [N II], [S II], H, and H.
Each method has relative advantages and shortcomings that have been investigated in a number of studies in the literature (e.g. Yin et al., 2007; Moustakas et al., 2010), and there are known discrepancies of as much as dex between different estimates of the oxygen abundances. For example, the estimated oxygen abundance of the host galaxy of the luminous SN 2007va (Kozłowski et al., 2010) obtained from the direct electron temperature method is 0.3 dex lower than the value obtained from the theoretical calibration of ([O II][O III])/Hβ (Kobulnicky & Kewley, 2004). Bresolin et al. (2009) demonstrate the offsets between the various techniques for their determination of the metallicity gradient in NGC 300. The abundances estimated with one diagnostic, the N2 diagnostic of Pettini & Pagel (2004), essentially track the stellar and () nebular abundances they measure, albeit with rather more scatter. Because the effective zero points and scales vary somewhat, regardless of which method is used, it is important to use (or convert to) just one.
With the S/N and wavelength coverage of our observations, we content ourselves in this paper with the empirical O3N2 and N2 diagnostics of Pettini & Pagel (2004) and the theoretical and empirical N2 diagnostic of Denicoló et al. (2002). We use the empirical conversions of Kewley & Ellison (2008) to convert metallicities determined on other scales to these for the purpose of direct comparison.
5 Conclusions
Recent observations of the environments of supernovae and GRBs show that metallicity is a key parameter in the lives and deaths of massive stars. Our finding that the hosts of luminous SNe lie in the low-metallicity extremes of the distribution of star-forming galaxies supports this emerging picture. Verifying and constraining this emerging relationship with metallicity may be an important probe of the mechanisms of the most luminous supernovae, and this trend may be an important factor in various aspects of the evolution of the metal-poor early universe.
References
- Abazajian et al. (2009) Abazajian, K. N., et al. 2009, ApJS, 182, 543
- Aldering et al. (2006) Aldering, G., et al. 2006, ApJ, 650, 510
- Anderson et al. (2010) Anderson, J. P., Covarrubias, R. A., James, P. A., Hamuy, M., & Habergham, S. M. 2010, MNRAS, 407, 2660
- Arcavi et al. (2010) Arcavi, I., et al. 2010, ApJ, 721, 777
- Benetti et al. (2010) Benetti, S., Bufano, F., Vinko, J., Marion, G. H., Pritchard, T., Wheeler, J. C., Chatzopoulos, E., & Shetrone, M. 2010, Central Bureau Electronic Telegrams, 2536, 1
- Bresolin et al. (2009) Bresolin, F., Gieren, W., Kudritzki, R., Pietrzyński, G., Urbaneja, M. A., & Carraro, G. 2009, ApJ, 700, 309
- Brinchmann et al. (2008) Brinchmann, J., Kunth, D., & Durret, F. 2008, A&A, 485, 657
- Chornock et al. (2010) Chornock, R., et al. 2010, arXiv:1004.2262
- Delahaye & Pinsonneault (2006) Delahaye, F., & Pinsonneault, M. H. 2006, ApJ, 649, 529
- Denicoló et al. (2002) Denicoló, G., Terlevich, R., & Terlevich, E. 2002, MNRAS, 330, 69
- Drake et al. (2009) Drake, A. J., et al. 2009, ApJ, 696, 870
- Drake et al. (2010) —. 2010, ApJ, 718, L127
- Eldridge et al. (2008) Eldridge, J. J., Izzard, R. G., & Tout, C. A. 2008, MNRAS, 384, 1109
- Fassia et al. (2000) Fassia, A., et al. 2000, MNRAS, 318, 1093
- Fruchter et al. (2006) Fruchter, A. S., et al. 2006, Nature, 441, 463
- Gal-Yam & Leonard (2009) Gal-Yam, A., & Leonard, D. C. 2009, Nature, 458, 865
- Gal-Yam et al. (2009) Gal-Yam, A., et al. 2009, Nature, 462, 624
- Garnett et al. (1991) Garnett, D. R., Kennicutt, Jr., R. C., Chu, Y., & Skillman, E. D. 1991, ApJ, 373, 458
- Georgy et al. (2010) Georgy, C., Meynet, G., & Maeder, A. 2010, arXiv:1011.6581
- Georgy et al. (2009) Georgy, C., Meynet, G., Walder, R., Folini, D., & Maeder, A. 2009, A&A, 502, 611
- Germany et al. (2000) Germany, L. M., Reiss, D. J., Sadler, E. M., Schmidt, B. P., & Stubbs, C. W. 2000, ApJ, 533, 320
- Gezari et al. (2009) Gezari, S., et al. 2009, ApJ, 690, 1313
- Hamuy et al. (2006) Hamuy, M., et al. 2006, PASP, 118, 2
- Herrero et al. (2010) Herrero, A., Garcia, M., Uytterhoeven, K., Najarro, F., Lennon, D. J., Vink, J. S., & Castro, N. 2010, A&A, 513, A70+
- Høg et al. (2000) Høg, E., et al. 2000, A&A, 355, L27
- Izotov & Thuan (2009) Izotov, Y. I., & Thuan, T. X. 2009, ApJ, 690, 1797
- Johnson et al. (2007) Johnson, J. A., Gal-Yam, A., Leonard, D. C., Simon, J. D., Udalski, A., & Gould, A. 2007, ApJ, 655, L33
- Karachentsev (2005) Karachentsev, I. D. 2005, AJ, 129, 178
- Kewley & Dopita (2002) Kewley, L. J., & Dopita, M. A. 2002, ApJS, 142, 35
- Kewley & Ellison (2008) Kewley, L. J., & Ellison, S. L. 2008, ApJ, 681, 1183
- Kiewe et al. (2010) Kiewe, M., et al. 2010, arXiv:1010.2689
- Kistler et al. (2009) Kistler, M. D., Yüksel, H., Beacom, J. F., Hopkins, A. M., & Wyithe, J. S. B. 2009, ApJ, 705, L104
- Kobulnicky & Kewley (2004) Kobulnicky, H. A., & Kewley, L. J. 2004, ApJ, 617, 240
- Kochanek et al. (2010) Kochanek, C. S., Szczygiel, D. M., & Stanek, K. Z. 2010, arXiv:1010.3704
- Kozłowski et al. (2010) Kozłowski, S., et al. 2010, ApJ, 722, 1624
- Landolt (1983) Landolt, A. U. 1983, AJ, 88, 439
- Le Floc’h et al. (2003) Le Floc’h, E., et al. 2003, A&A, 400, 499
- Levesque et al. (2010a) Levesque, E. M., Berger, E., Kewley, L. J., & Bagley, M. M. 2010a, AJ, 139, 694
- Levesque et al. (2010b) Levesque, E. M., Kewley, L. J., Berger, E., & Jabran Zahid, H. 2010b, AJ, 140, 1557
- Li et al. (2010) Li, W., et al. 2010, arXiv:1006.4612
- Mahabal & Drake (2010) Mahabal, A. A., & Drake, A. J. 2010, The Astronomer’s Telegram, 2508, 1
- Mahabal et al. (2010) Mahabal, A. A., et al. 2010, The Astronomer’s Telegram, 2490, 1
- Martini et al. (2011) Martini, P., et al. 2011, PASP, in press
- McWilliam (1997) McWilliam, A. 1997, ARA&A, 35, 503
- Metzger (2010) Metzger, B. D. 2010, MNRAS, 409, 284
- Miller et al. (2009) Miller, A. A., et al. 2009, ApJ, 690, 1303
- Modjaz et al. (2010) Modjaz, M., Bloom, J. S., Filippenko, A. V., Kewley, L., Perley, D., & Silverman, J. M. 2010, arXiv:1007.0661
- Modjaz et al. (2008) Modjaz, M., et al. 2008, AJ, 135, 1136
- Moustakas & Kennicutt (2006) Moustakas, J., & Kennicutt, Jr., R. C. 2006, ApJ, 651, 155
- Moustakas et al. (2010) Moustakas, J., Kennicutt, Jr., R. C., Tremonti, C. A., Dale, D. A., Smith, J., & Calzetti, D. 2010, ApJS, 190, 233
- Murase et al. (2010) Murase, K., Thompson, T. A., Lacki, B. C., & Beacom, J. F. 2010, arXiv:1012.2834
- Neill et al. (2010) Neill, J. D., et al. 2010, arXiv:1011.3512
- Newton & Puckett (2010) Newton, J., & Puckett, T. 2010, Central Bureau Electronic Telegrams, 2532, 1
- Oke (1990) Oke, J. B. 1990, AJ, 99, 1621
- Osterbrock & Ferland (2006) Osterbrock, D. E., & Ferland, G. J. 2006, Astrophysics of gaseous nebulae and active galactic nuclei, ed. Osterbrock, D. E. & Ferland, G. J.
- Pastorello et al. (2010) Pastorello, A., et al. 2010, ApJ, 724, L16
- Patat et al. (2010) Patat, F., Taubenberger, S., Benetti, S., Pastorello, A., & Harutyunyan, A. 2010, arXiv:1011.5926
- Pauldrach et al. (1986) Pauldrach, A., Puls, J., & Kudritzki, R. P. 1986, A&A, 164, 86
- Peeples et al. (2009) Peeples, M. S., Pogge, R. W., & Stanek, K. Z. 2009, ApJ, 695, 259
- Pettini & Pagel (2004) Pettini, M., & Pagel, B. E. J. 2004, MNRAS, 348, L59
- Pigulski et al. (2009) Pigulski, A., Pojmański, G., Pilecki, B., & Szczygieł, D. M. 2009, Acta Astron., 59, 33
- Pilyugin & Thuan (2007) Pilyugin, L. S., & Thuan, T. X. 2007, ApJ, 669, 299
- Pojmanski (1998) Pojmanski, G. 1998, Acta Astron., 48, 35
- Pojmanski (2002) —. 2002, Acta Astron., 52, 397
- Prantzos & Boissier (2003) Prantzos, N., & Boissier, S. 2003, A&A, 406, 259
- Prieto & Stanek (2010) Prieto, J. L., & Stanek, K. Z. 2010, The Astronomer’s Telegram, 3010, 1
- Prieto et al. (2008) Prieto, J. L., Stanek, K. Z., & Beacom, J. F. 2008, ApJ, 673, 999
- Prieto et al. (2007) Prieto, J. L., et al. 2007, arXiv:0706.4088
- Quimby et al. (2010a) Quimby, R., et al. 2010a, The Astronomer’s Telegram, 2634, 1
- Quimby (2006) Quimby, R. M. 2006, PhD thesis, The University of Texas at Austin
- Quimby et al. (2007) Quimby, R. M., Aldering, G., Wheeler, J. C., Höflich, P., Akerlof, C. W., & Rykoff, E. S. 2007, ApJ, 668, L99
- Quimby et al. (2010b) Quimby, R. M., Kulkarni, S. R., Ofek, E., Kasliwal, M. M., Levitan, D., Gal-Yam, A., & Cenko, S. B. 2010b, The Astronomer’s Telegram, 2492, 1
- Quimby et al. (2009) Quimby, R. M., et al. 2009, arXiv:0910.0059
- Quimby et al. (2010c) —. 2010c, The Astronomer’s Telegram, 2740, 1
- Quimby et al. (2010d) —. 2010d, The Astronomer’s Telegram, 2979, 1
- Rau et al. (2009) Rau, A., et al. 2009, PASP, 121, 1334
- Rest et al. (2009) Rest, A., et al. 2009, arXiv:0911.2002
- Rigon et al. (2003) Rigon, L., et al. 2003, MNRAS, 340, 191
- Russell & Dopita (1990) Russell, S. C., & Dopita, M. A. 1990, ApJS, 74, 93
- Smith et al. (2008) Smith, N., Chornock, R., Li, W., Ganeshalingam, M., Silverman, J. M., Foley, R. J., Filippenko, A. V., & Barth, A. J. 2008, ApJ, 686, 467
- Smith et al. (2010a) Smith, N., Li, W., Silverman, J. M., Ganeshalingam, M., & Filippenko, A. V. 2010a, arXiv:1010.3718
- Smith et al. (2007) Smith, N., et al. 2007, ApJ, 666, 1116
- Smith et al. (2010b) —. 2010b, arXiv:1011.4150
- Stanek et al. (2003) Stanek, K. Z., et al. 2003, ApJ, 591, L17
- Stanek et al. (2006) —. 2006, Acta Astron., 56, 333
- Stoll et al. (2010) Stoll, R., et al. 2010, in Proc. SPIE, Vol. 7735
- Tinsley (1979) Tinsley, B. M. 1979, ApJ, 229, 1046
- Tremonti et al. (2004) Tremonti, C. A., et al. 2004, ApJ, 613, 898
- van Dokkum (2001) van Dokkum, P. G. 2001, PASP, 113, 1420
- van Marle et al. (2010) van Marle, A. J., Smith, N., Owocki, S. P., & van Veelen, B. 2010, MNRAS, 407, 2305
- Vink & de Koter (2005) Vink, J. S., & de Koter, A. 2005, A&A, 442, 587
- Woosley et al. (2007) Woosley, S. E., Blinnikov, S., & Heger, A. 2007, Nature, 450, 390
- Yamanaka et al. (2010) Yamanaka, M., Okushima, T., Arai, A., Sasada, M., & Sato, H. 2010, Central Bureau Electronic Telegrams, 2539, 1
- Yin et al. (2007) Yin, S. Y., Liang, Y. C., Hammer, F., Brinchmann, J., Zhang, B., Deng, L. C., & Flores, H. 2007, A&A, 462, 535