789\Yearpublication2006\Yearsubmission2005\Month11\Volume999\Issue88
later
Inference from adiabatic analysis of solar-like oscillations in Red giants
Abstract
The clear detection with CoRoT and KEPLER of radial and non-radial solar-like oscillations in many red giants paves the way to seismic inferences on the structure of such stars. We present an overview of the properties of the adiabatic frequencies and frequency separations of radial and non-radial oscillation modes, highlighting how their detection allows a deeper insight into the properties of the internal structure of red giants. In our study we consider models of red giants in different evolutionary stages, as well as of different masses and chemical composition. We describe how the large and small separations computed with radial modes and with non-radial modes mostly trapped in the envelope depend on the stellar global parameters and evolutionary state, and we compare our theoretical predictions and first KEPLER data.Finally, we find that the properties of dipole modes constitute a promising seismic diagnostic of the evolutionary state of red-giant stars.
keywords:
Stars: evolution – stars: interiors – stars: oscillations – stars: late-type1 Introduction
Red giants are cool stars with an extended convective envelope, which can, as in main sequence solar-like stars, stochastically excite pressure modes of oscillation. Although stochastic oscillations in a few red giants have already been detected from ground and space observations (e.g. Frandsen et al. 2002; De Ridder et al. 2006; Barban et al. 2007) it has been only after the photometric space mission COROT (Baglin et al. 2002) that an unambiguous detection of radial and non-radial modes in a large number of red-giant stars have been achieved (De Ridder et al. 2009; Hekker et al. 2009; Carrier et al. 2010). That confirmation has opened the way to the seismic study of the structure and evolution of these objects that play a fundamental role in fields such as stellar age determination and chemical evolution of galaxies.
About 2000 of the targets observed by CoRoT in the two first runs of 150 days have been identified as red giants with solar-like oscillations in the frequency domain expected from theoretical scalings by Kjeldsen & Bedding (1995). Their spectra show regular patterns that allowed Mosser et al. (2010) to derive precise values of the large frequency separation. The analysis of the light curve of the sismo-CoRoT target HR 7349 has revealed a rich solar-like spectrum with 19 identified modes of degrees , 1 and 2 (Carrier et al. 2010). Moreover, the first 34 days of science operations of the KEPLER satellite (Borucki et al. 2009), have also revealed the presence of solar-like oscillations in a sample of 50 stars whose frequency at maximum power () indicates that they are low-luminosity red-giants (Bedding et al. 2010). The mean large () and small frequency separations (), classically used in the asymptotic interpretation of solar-like oscillations, were also derived for that sample. All these new and high quality data, together with all those we expect in the next years thanks to KEPLER and CoRoT missions, are the motivation for the present study about the physical interpretation of the oscillation spectrum of red-giant stars.
In the next sections we present: first the properties of the stellar models we computed for different sets of fundamental parameters and input physics; second, the properties of the corresponding adiabatic spectra; and third, the predicted values for the frequency separations of acoustic modes, as well as the inferences about the physical properties of red-giant stars that we can extract from these separations .
2 Stellar Models
Stellar models were computed with the code ATON3.1 (Ventura et al. 2008, and references therein) for masses between 1.0 and 5.0 with a step of 0.5, and different chemical compositions: He mass fraction, =0.25 and 0.278, and metal mass fraction, =0.006, 0.01, 0.015, 0.02 and 0.03. The energy transport in the convective regions was modeled with the classic mixing length treatment with . For a given chemical composition, models with and FST treatment of convection (Canuto et al. 1996) were also computed. The evolution of these models were followed from the pre-main sequence until the exhaustion of He in the center for models more massive than 2.5, and until the helium flash for the less massive ones. The core He-burning phase for low-mass () stars has been also followed starting from zero age horizontal branch models for different values of the mass of the He-core (Red clump stars). Microscopic diffusion was not included in these computations but its effects on red giant models (Michaud et al. 2010) are not relevant for the present study.
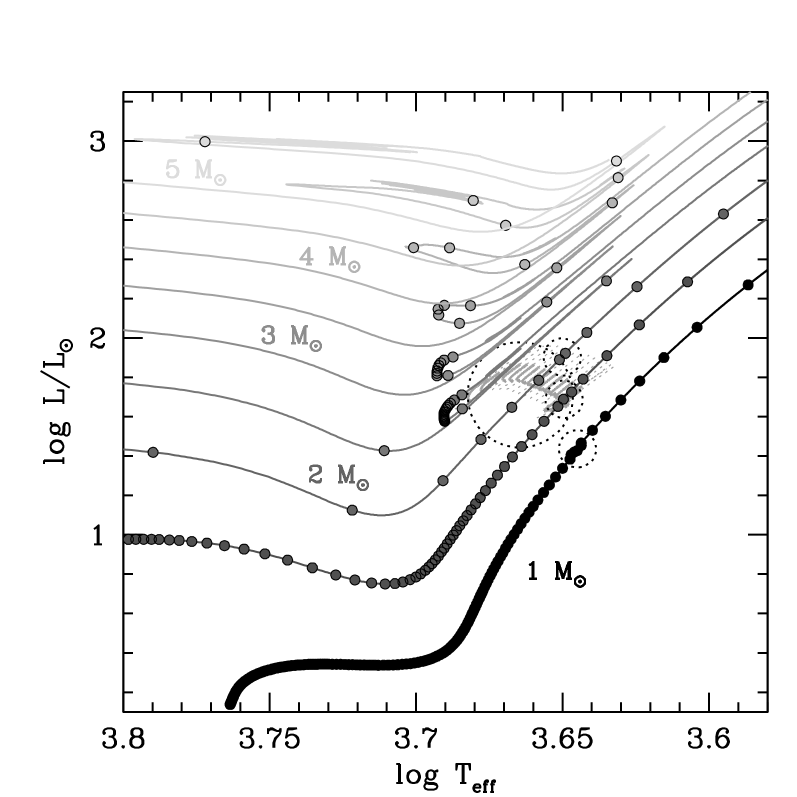
The rate of evolution during ascending RGB, descending RGB and core He-burning phases is very different and strongly depends on the stellar mass. For low-mass stars the time scale in the RGB may be comparable with that of core He-burning of more massive stars (see Fig. 1). As a consequence, observing stars in both evolutionary stages would be equally likely. Concerning the internal structure of these models, it is worth mentioning that for a low-mass model (1.5 , for instance) the density contrast (, central to mean density ratio) changes from at the bottom of its RGB to at . Models in the core He-burning phase, on the other hand, have a value of of the order of , and due to the high dependence on temperature of the 3 nuclear reactions, have developed a small convective core. At a given luminosity, that of the Red-Clump for instance, for a 1.5 RGB model is more than 10 times larger than for He-burning one. So different structures should imply significant effects on the oscillation properties.
3 Adiabatic oscillation properties
Adiabatic oscillation frequencies were computed with an Eulerian version of the code LOSC (Scuflaire et al. 2008) for models from the bottom of the RGB until a maximum luminosity (, depending on mass) and also during the phase of core He-burning. In this paper we deal with adiabatic computations and we do not consider the problem of excitation and damping of solar-like oscillations in red giants Dziembowski et al. (2001); Houdek & Gough (2002); Dupret et al. (2009). We use the scaling laws (Brown et al. 1991; Kjeldsen & Bedding 1995) to derive the frequency domain in which solar like oscillations are expected, and the value of the mode inertia as an estimate of the expected mode amplitude (Christensen-Dalsgaard 2004). We search oscillation modes with angular degree , 1 and 2, in the domain of frequencies defined by an interval around (Eq. (10) of Kjeldsen & Bedding 1995). The width of the solar-like frequency domain is taken to be 20% larger than the difference between the acoustic cutoff frequency in the stellar atmosphere and .
The properties of oscillation modes depend on the behaviour of the Brunt-Väisälä () and Lamb () frequencies. In red-giant models, reaches large values in the central regions and therefore the frequency of gravity modes (g modes) and the number of g-modes by frequency interval () increase with respect to main sequence models. The value of can be estimated from the asymptotic theory (Tassoul 1980) as:
| (1) |
with the integral performed on the radiative region. On the other hand, the low mean density makes the frequency of pressure modes (p-modes) to decrease. All that leads to an oscillation spectrum for red-giants where in addition to radial modes, there is a large number of non-radial modes with mixed g-p properties. The dominant character of these non-radial modes depends on the separation between gravity and acoustic cavities, and may be estimated from the value of the normalized mode inertia () (see e.g. Christensen-Dalsgaard 2004, and references therein). Therefore, some non-radial modes may be well trapped in the acoustic cavity and behave as p-modes presenting a mode inertia close to that of radial modes, while modes with strong mixed g-p character have larger value. Hereafter, we will use the term p-modes in quotation marks to refer to mixed modes with a dominant p-character.
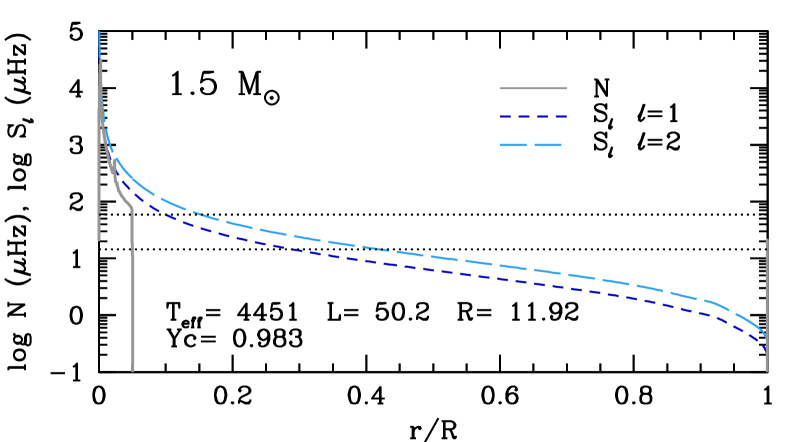
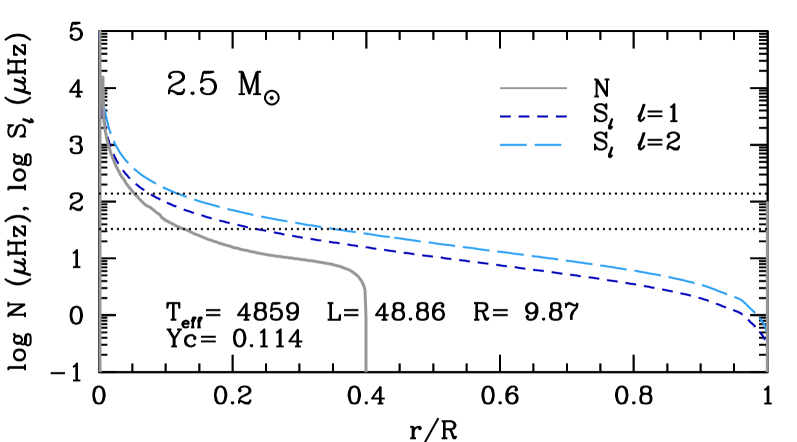
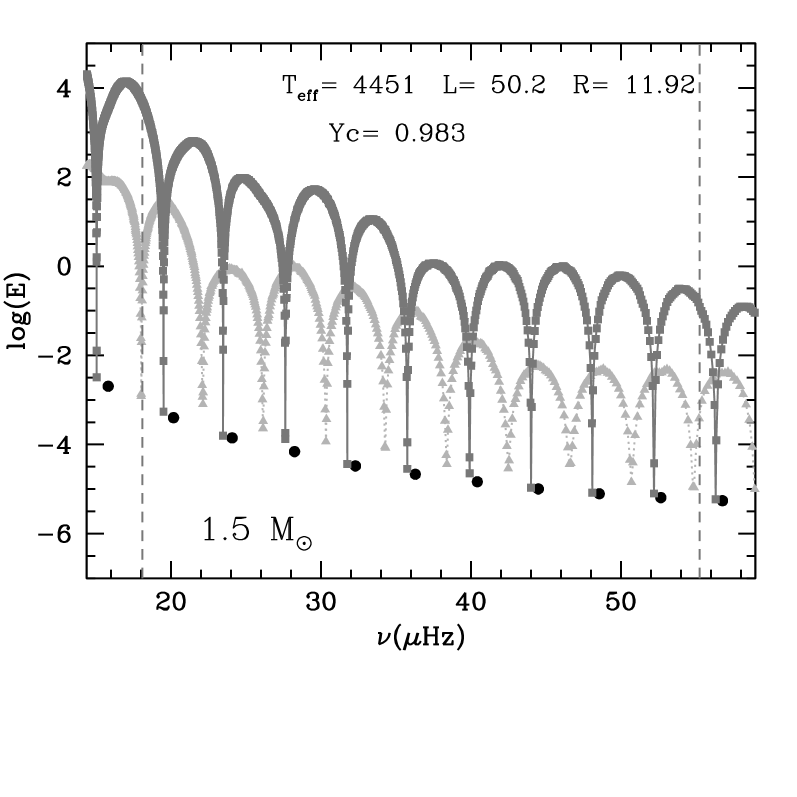
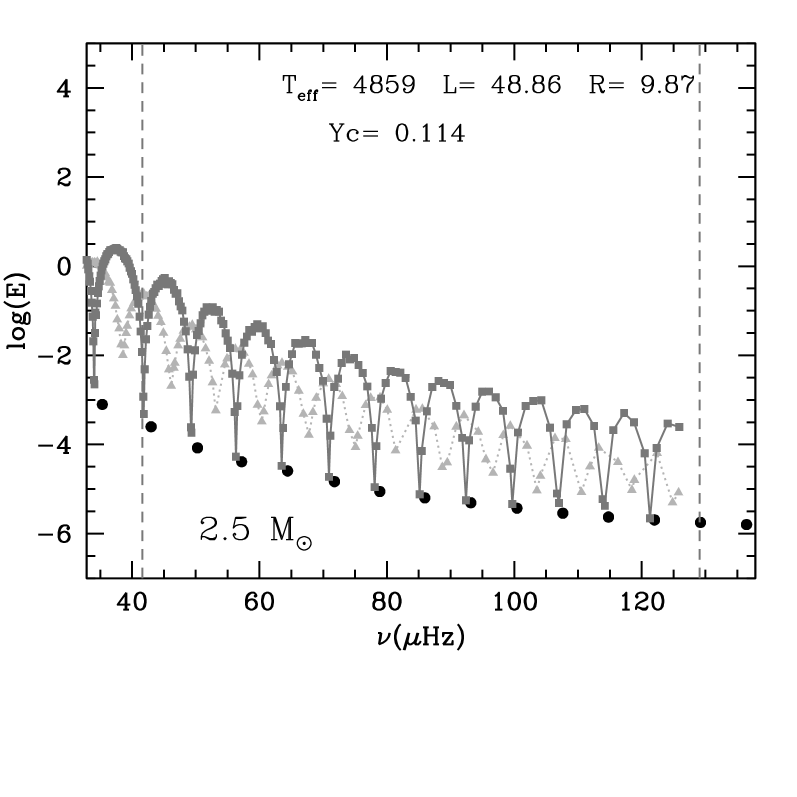
In Fig. 2 we present, in top panels, the , 2 propagation diagrams for a RGB 1.5 model (left) and for a core He-burning (He-B) model of 2.5 (right). In the bottom panels we plot the variation of the mode inertia with frequency for radial and non-radial modes (). The RGB model is ten times more centrally condensed than the He-B one ( and , respectively). Furthermore, the He-B model has a small convective core (too small to be seen at the scale of Fig. 2). Both ingredients contribute to decrease the value of in the central regions and therefore the density of non-radial modes (Eq. 1). While the number of eigenfrequencies between two radial ones is of the order of 200 for the RGB model, it is only 6 for the He-B one. The huge difference in density between the central region and the convective envelope entails a high potential barrier between the acoustic and the gravity cavities reducing the interaction between p and g modes. As a consequence, we find modes with that are quite regularly spaced in frequency for RGB models. For He-B ones, the coupling between these cavities is more important and modes are mixed modes with . Nevertheless, presents still a minimum value for modes between two consecutive radial ones showing a somewhat regular pattern. Even if is larger than that corresponding to the radial modes we can consider those modes, based on the value of , as still observable “p-modes”. For modes, the interaction between g- and p-cavity is smaller than for and hence the trapping more efficient. Therefore, independently of the central condensation of the model, a spectrum of regularly spaced “p-modes” with is expected. Finally, note that the turning points for acoustic modes ( defined as point where ) are inside the convective envelope for RGB model and in the radiative region for the He-B one.
In the asymptotic theory for p-modes (Vandakurov 1967; Tassoul 1980; Gough 1986) the frequency of two consecutive modes of same degree are separated by a constant value and that value is approximately independent of . Of course, the asymptotic theory is no longer valid for mixed modes nor in regions with rapid variation of physical quantities, but we can, nevertheless, try to apply it to the modes well or partially trapped in the acoustic cavity, with a dominant p-character (“p-modes”). We select then as “p-modes” of degree the modes with the minimum inertia between two consecutive radial modes, and we use them to derive the values of the large and small frequency separations and to analyse the dependence of these asymptotic quantities on the stellar parameters and evolutionary state.
3.1 Large Separation:
The mean value of the large frequency separation () averaged over the radial order is, according to the asymptotic theory, related to the mean density of the star, and its value is approximately independent of for low-degree modes. Therefore, for a given mass, decreases as the stars ascends in the RGB with a core more and more dense and an envelope more and more diffuse, but it is not possible to distinguish, on the base of value, among different evolutionary states, ascending RGB, descending RGB, or core He-burning. Nevertheless, there is an indirect information about the evolutionary state not in , but on the deviation of as function of frequency with respect to its mean value (). Radial and “p-modes”, as mentioned above, show a very regular pattern, and the mean quadratic deviation of with respect to its mean value over the solar-like frequency domain () is always below 5% for all the evolutionary states and masses considered. On the contrary, strongly depends on the evolutionary state and while its value remains small for more concentrated models, it may get values as large as 30% for core He-burning models.
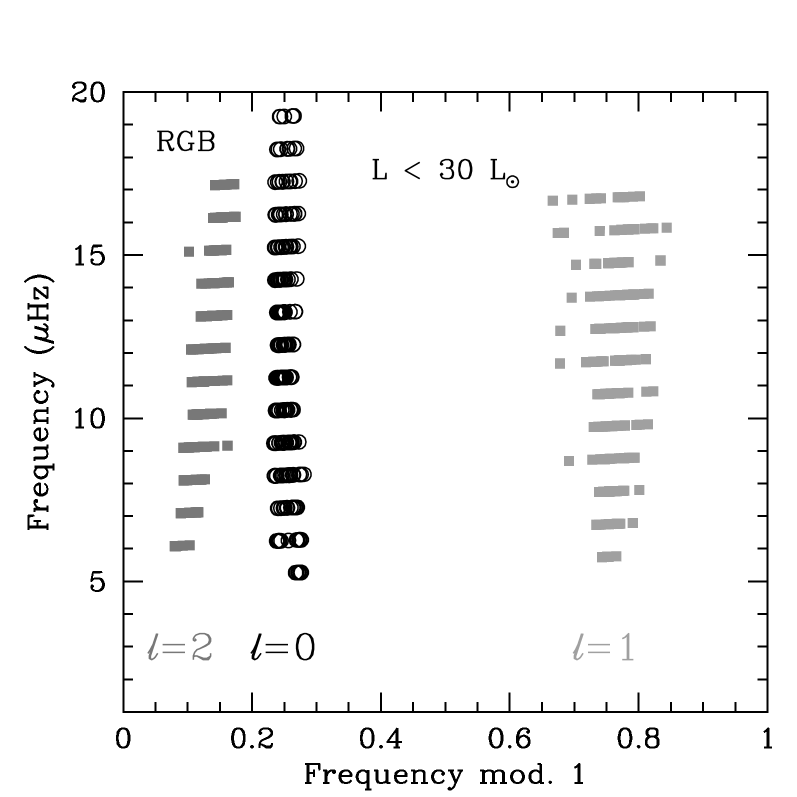
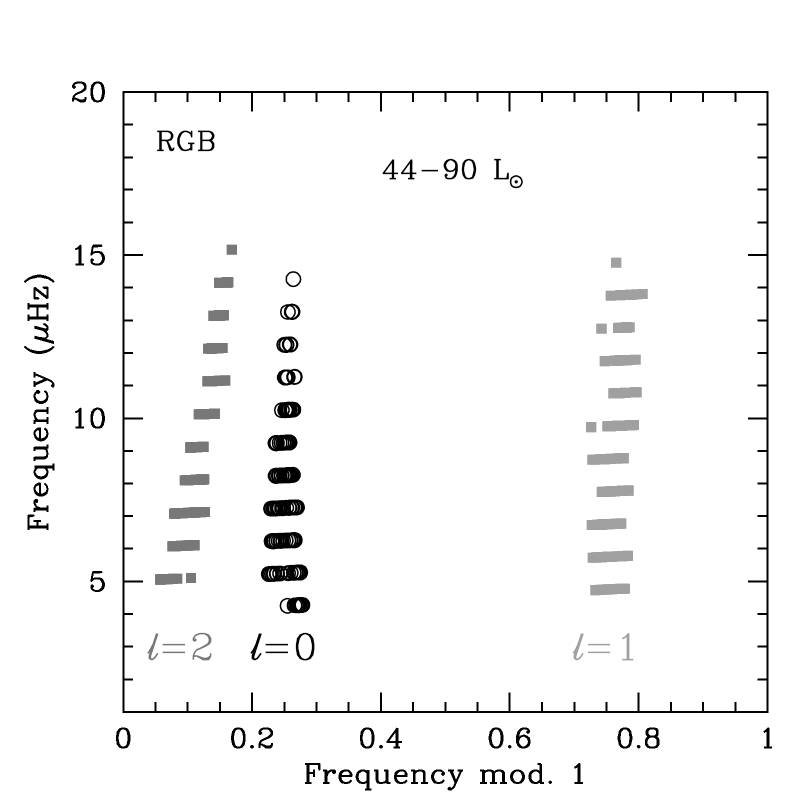
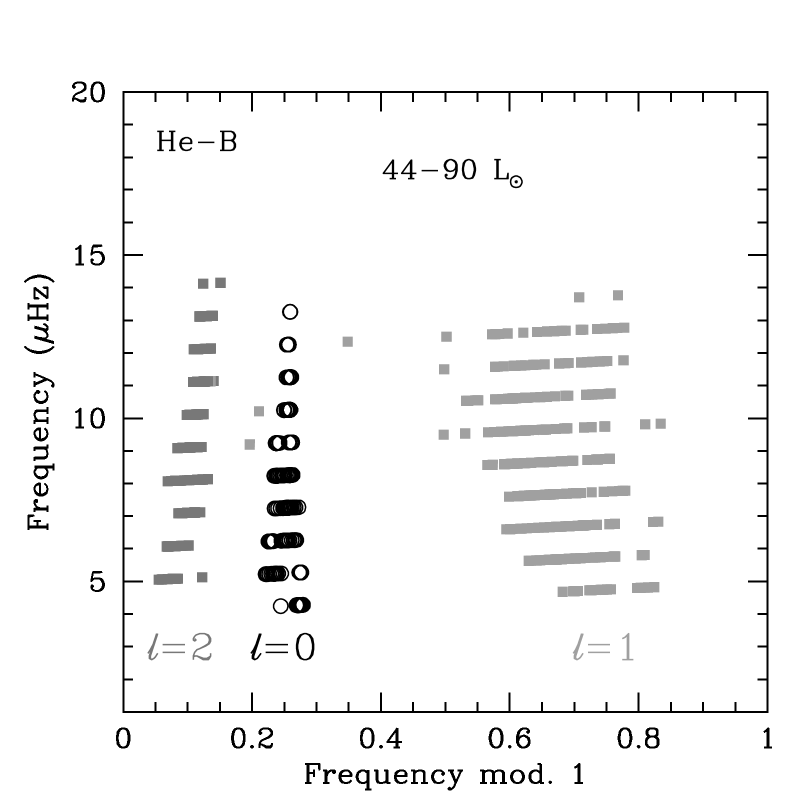
Following the Method 2 in Bedding & Kjeldsen (2010), we plot the adiabatic frequencies of trapped “p-modes” for models with 1 and 1.5 in the form of folded échelle diagram. The left panel in Fig. 3 presents the spectrum for models with luminosity between the bottom of the RGB and 30. As found in the observational results obtained by Bedding et al. (2010) for the first 34 days of KEPLER observations, radial and quadruple modes show a low scatter, while for dipole modes that one is significantly larger. As the star goes up in the RGB, the modes are better trapped in the acoustic cavity and the spectra of dipole modes are more regular. That is shown in the central panel of Fig. 3 where the folded échelle diagram for RGB models at the luminosity of the Red Clump show a smaller scatter for modes than in left panel. At the same luminosity, models with 1 and 1.5 may be burning He in their core. That implies a decrease of the central density as well as the development of a small convective core. Furthermore, following the expansion of the core, the external convective zone recedes increasing the interaction between the gravity and acoustic cavities (see. Fig. 2) and the mixed character of oscillation modes. The spectrum of “trapped” modes is then much less regular as is made evident in the échelle diagram in the right panel of Fig. 3.
3.2 Small separations: and
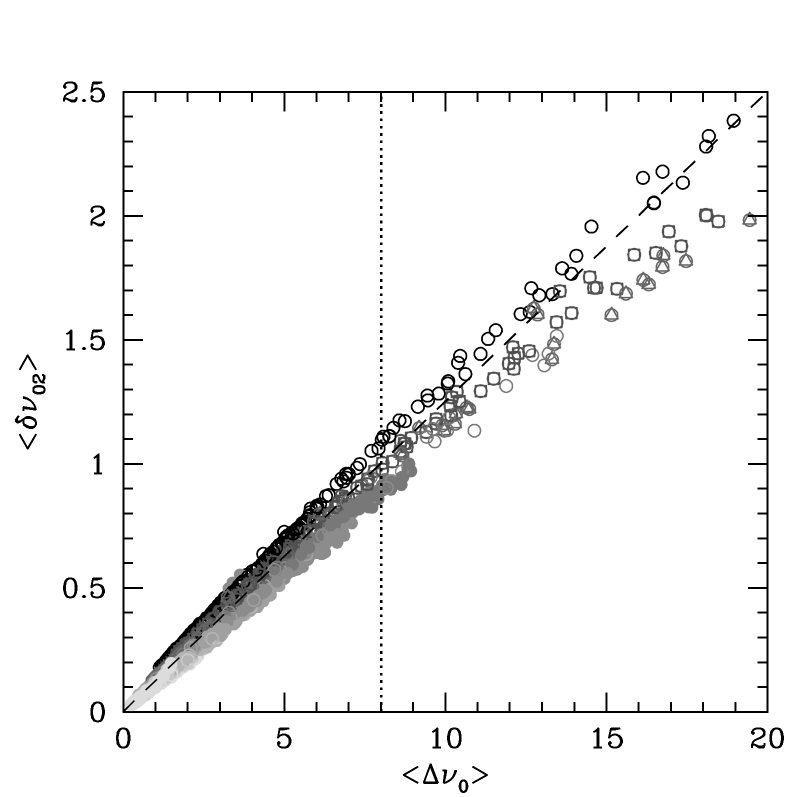
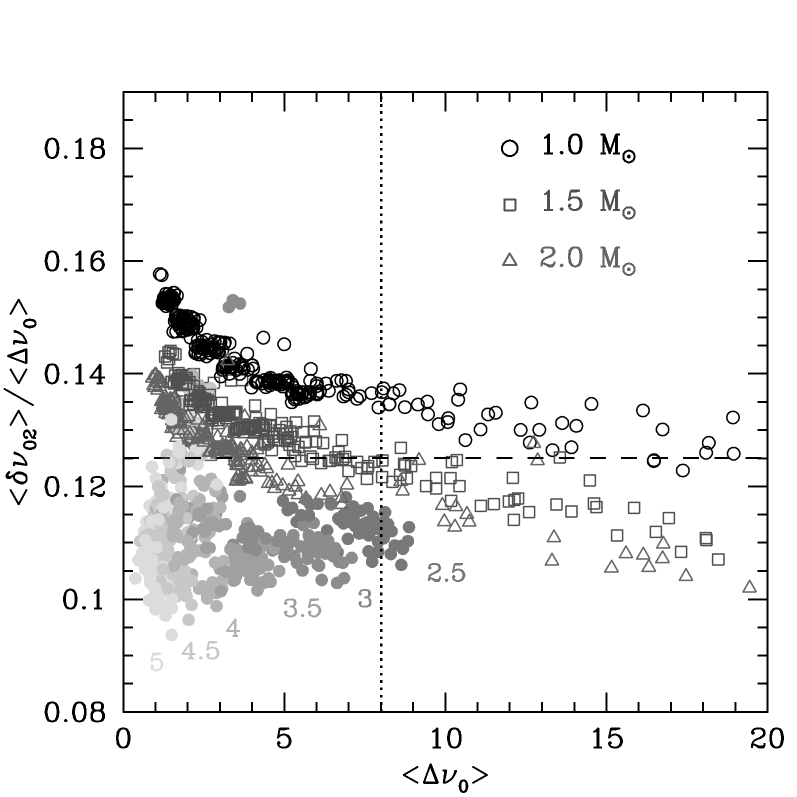
The mean small frequency separation () is, according to the asymptotic theory, related to the behaviour of the sound speed () mostly in the central regions, and hence to the stellar evolutionary state. The representation of vs. is in fact considered as a seismic diagnostic diagram allowing to derive stellar mass and age for main-sequence solar-like pulsators (Christensen-Dalsgaard 1988). The corresponding seismic diagram for red-giant models is drawn in Fig. 4.a which shows a linear dependence of on , with a slope that increases as mass decreases for RGB models. In Fig. 4.b we plot the normalized quantity that in main-sequence stars is known to depend mostly on central physical conditions (Roxburgh & Vorontsov 2003). It is worth noticing that in these figures we plotted for models computed with different chemical compositions and convection treatment and, nevertheless, a predominant dependence on mass and radius appears. For a given mass increases with density contrast, its value decreases as mass increases and it does not change significantly during the core He-burning phase.
In Fig. 4.a and b a vertical dotted line indicates the lower limit of measured from the first 34d of KEPLER mission, and the dashed-line corresponds to the fit proposed by Bedding et al. (2010) for those observations. The comparison between these figures and Fig.4 in Bedding et al. (2010) indicates that predictions from theoretical models are consistent with observational data corresponding to low-mass stars (1-1.5) in the low-luminosity part of the ascending RGB, such as the scaling based on and also suggests.
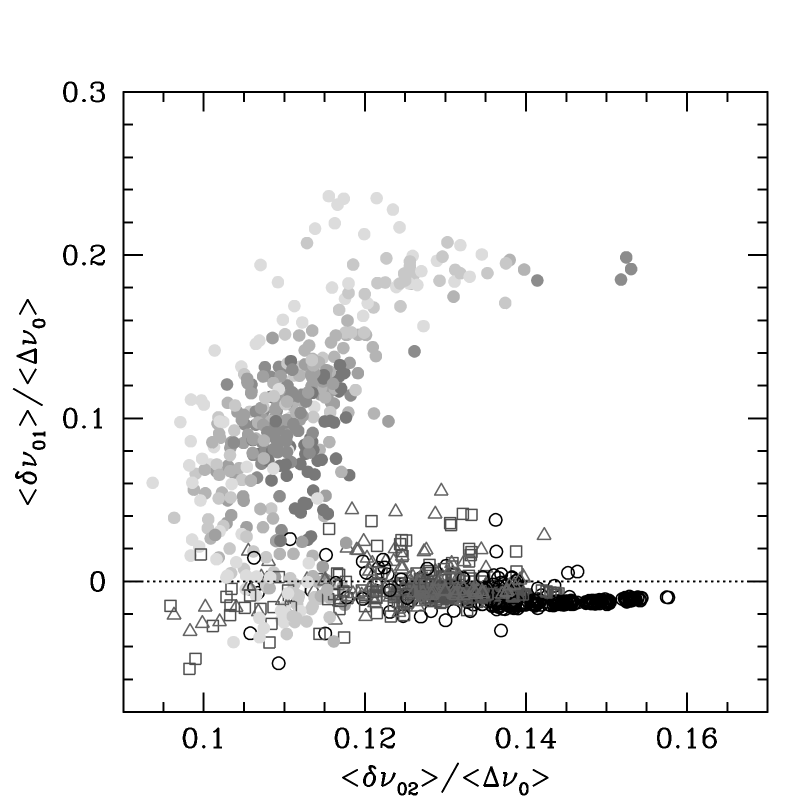
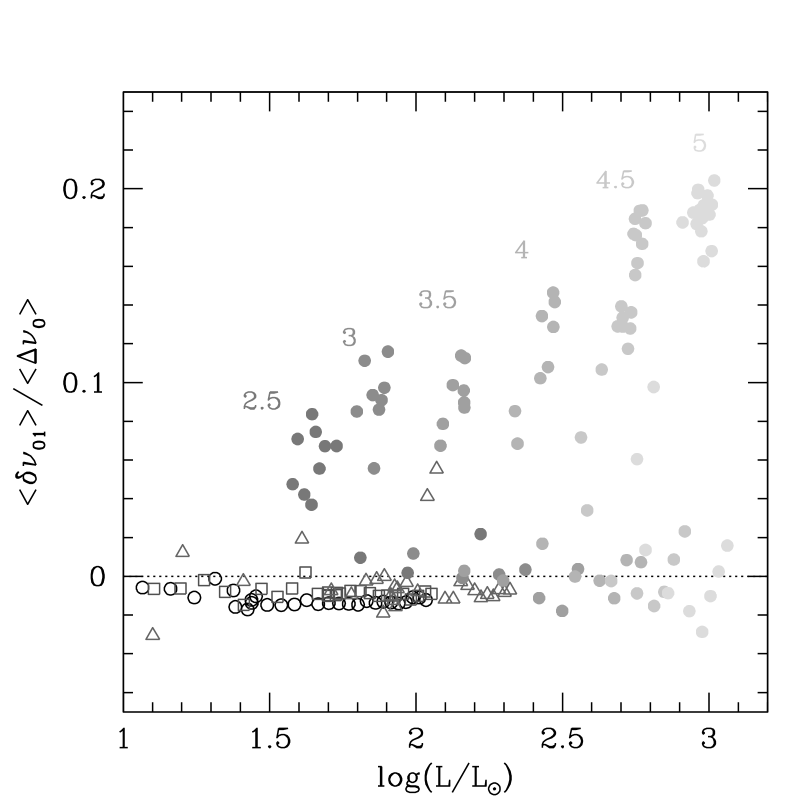
The small frequency separation in main-sequence stars is also known to be sensitive to the center physical conditions and it is mainly useful when only radial and dipole modes are observed. The asymptotic theory predicts a relationship. As it is evident in Fig. 4.c the “p-mode” spectrum for red-giant models does not follow those predictions. In particular, a large number of models have negative or very small values of independently of . Very small or negative values of have also been observed in the KEPLER data (Bedding et al. 2010) and in the oscillation spectrum of the CoRoT red-giant HR 7349 (Carrier et al. 2010). We note that the largest concentration of negative/small values correspond to low-mass models in the RGB. A plot of vs. luminosity (Fig. 5.a) suggest in fact that models with negative or small value are in or close to the RGB.
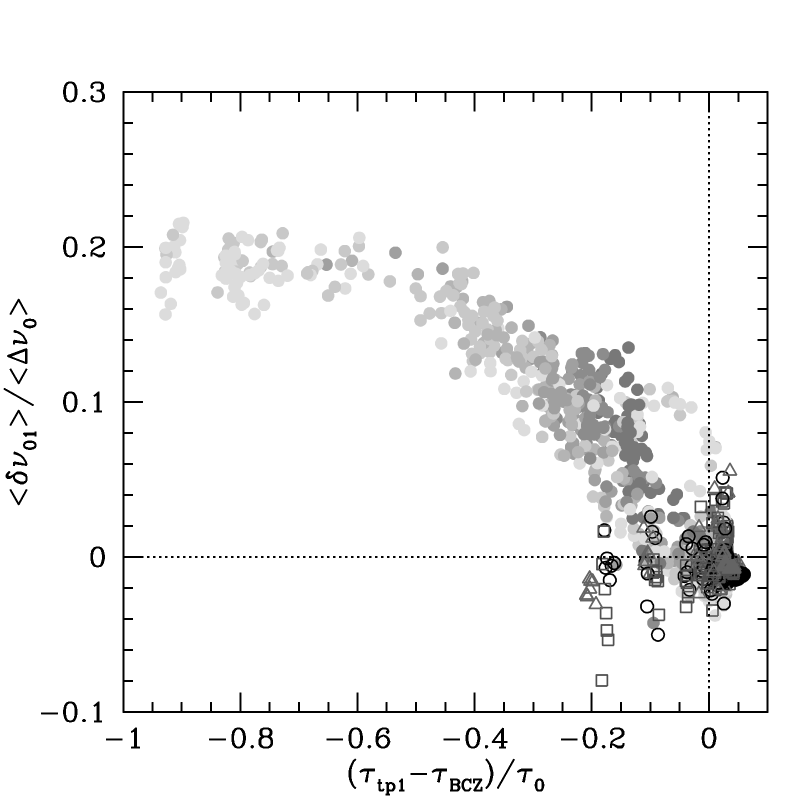
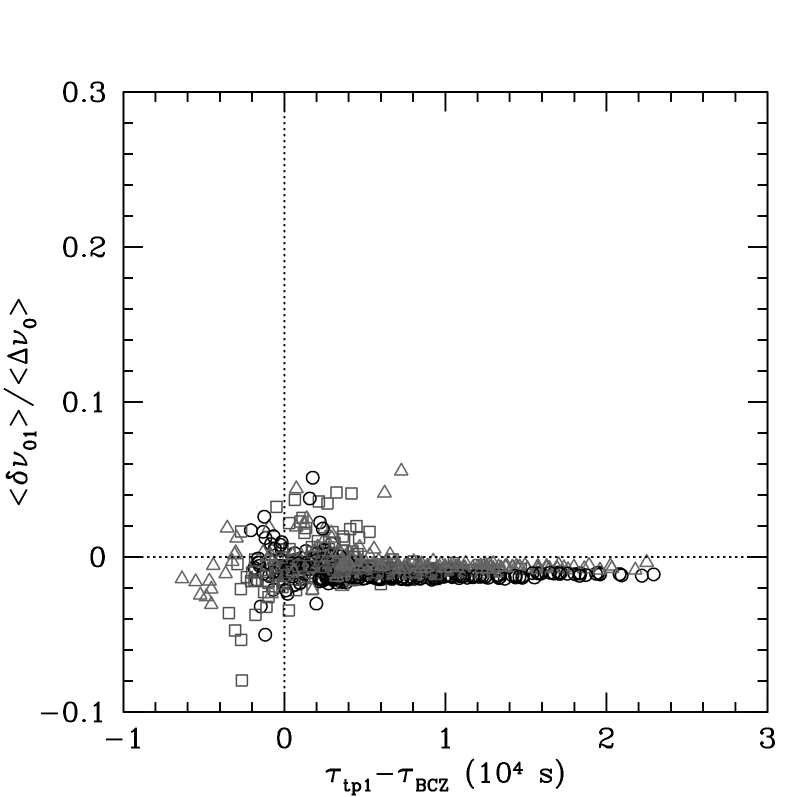
Searching for a common characteristic in the structure of these models, we find that during the ascending and descending RGB the turning points of modes are well inside the convective envelop. The steady He-burning models have a shallower convective envelope and the turning points of modes are inside the radiative region. Fig. 5.b shows the variation of with the distance (in relative acoustic radius ) between the bottom of the convective zone (BCZ) and the turning point for a mode with frequency close to (). In Fig. 5.c we highlight the behaviour of for low-mass models in the RGB as a function of the difference (in seconds) between the acoustic radius of and that of the BCZ. We see that the scatter of rapidly decreases as increases (deep convective envelope) and takes negative values for models in which the is well inside the convective envelope.
4 Concluding remarks
In this paper we presented the properties of the oscillation spectrum of solar-like oscillations during the RGB and core He-burning phases of red-giant evolution, and analyzed the behaviour of large and small frequency separations derived for modes well trapped in the acoustic cavity of these stars. The main results of this global overview are the followings:
-
•
Independently of the evolutionary state, modes trapped in the acoustic cavity have an inertia of the same order as that of the corresponding radial mode and behave as “p-modes” with frequencies regularly spaced by . As a consequence, the scatter of modes in the folded échelle diagrams is rather small.
-
•
The trapping of modes in the acoustic cavity depends on the evolutionary state. While a regular pattern of dipole modes is expected in more centrally condensed models, the scatter significantly increases for models in the core He-burning phase. The scatter of “p-modes” decreases as model concentration increases. Therefore the regularity of spectrum could be used to discriminate between different evolutionary phases.
-
•
depends almost linearly on the large separation, hence on the mean density of the model, with a slope that slightly depends on the mass. The value of for a given mass increases with the density contrast and thus with luminosity, and for a given luminosity, it decreases as the mass of the model increases.
-
•
seems to reflect the distance between the turning point and the bottom of convective envelope. It takes negative (or small) values if tp1 is well inside the convective envelope, what occurs in RGB models.
-
•
The theoretical predictions based on stellar models are in good agreement with the observational results obtained in the first 34 days of KEPLER observations. Comparison of their values with the population simulations presented in Miglio et al. (2009) suggests that these red giants are in fact stars with masses lower than 2 in the low-luminosity part of the ascending RGB. On the other hand, the same simulations concluded that the sample of red giants analysed in the CoRoT exo-field are “Red Clump” ones. That is, the sample is dominated by low-mass stars in the core He-burning phase. From the theoretical analysis of standard models presented in that paper, we would expect that the corresponding folded échelle diagram will show a significant scatter for modes.
Acknowledgements.
A.M. and J.M. acknowledge financial support from the Prodex-ESA Contract Prodex 8 COROT (C90199) and FNRS. The authors thank M.A. Dupret for useful suggestions concerning oscillation frequency computations.References
- Baglin et al. (2002) Baglin, A., Auvergne, M., Barge, P., et al. 2002, in ESA Special Publication, Vol. 485, Stellar Structure and Habitable Planet Finding, ed. B. Battrick, F. Favata, I. W. Roxburgh, & D. Galadi, 17–24
- Barban et al. (2007) Barban, C., Matthews, J. M., De Ridder, J., et al. 2007, A&A, 468, 1033
- Bedding et al. (2010) Bedding, T. R., Huber, D., Stello, D., et al. 2010, ApJ, 713, L176
- Bedding & Kjeldsen (2010) Bedding, T. R. & Kjeldsen, H. 2010, Communications in Asteroseismology, 161, 3
- Borucki et al. (2009) Borucki, W., Koch, D., Batalha, N., et al. 2009, in IAU Symposium, Vol. 253, IAU Symposium, 289–299
- Brown et al. (1991) Brown, T. M., Gilliland, R. L., Noyes, R. W., & Ramsey, L. W. 1991, ApJ, 368, 599
- Canuto et al. (1996) Canuto, V. M., Goldman, I., & Mazzitelli, I. 1996, ApJ, 473, 550
- Carrier et al. (2010) Carrier, F., De Ridder, J., Baudin, F., et al. 2010, A&A, 509, A73+
- Christensen-Dalsgaard (1988) Christensen-Dalsgaard, J. 1988, in IAU Symposium, Vol. 123, Advances in Helio- and Asteroseismology, ed. J. Christensen-Dalsgaard & S. Frandsen, 295–+
- Christensen-Dalsgaard (2004) Christensen-Dalsgaard, J. 2004, Sol. Phys., 220, 137
- De Ridder et al. (2009) De Ridder, J., Barban, C., Baudin, F., et al. 2009, Nature, 459, 398
- De Ridder et al. (2006) De Ridder, J., Barban, C., Carrier, F., et al. 2006, A&A, 448, 689
- Dupret et al. (2009) Dupret, M., Belkacem, K., Samadi, R., et al. 2009, A&A, 506, 57
- Dziembowski et al. (2001) Dziembowski, W. A., Gough, D. O., Houdek, G., & Sienkiewicz, R. 2001, MNRAS, 328, 601
- Frandsen et al. (2002) Frandsen, S., Carrier, F., Aerts, C., et al. 2002, A&A, 394, L5
- Gough (1986) Gough, D. O. 1986, in Hydrodynamic and Magnetodynamic Problems in the Sun and Stars, ed. Y. Osaki, 117–+
- Hekker et al. (2009) Hekker, S., Kallinger, T., Baudin, F., et al. 2009, A&A, 506, 465
- Houdek & Gough (2002) Houdek, G. & Gough, D. O. 2002, MNRAS, 336, L65
- Kjeldsen & Bedding (1995) Kjeldsen, H. & Bedding, T. R. 1995, A&A, 293, 87
- Michaud et al. (2010) Michaud, G., Richer, J., & Richard, O. 2010, A&A, 510, A104+
- Miglio et al. (2009) Miglio, A., Montalbán, J., Baudin, F., et al. 2009, A&A, 503, L21
- Mosser et al. (2010) Mosser, B., Belkacem, K., Goupil, M. J., et al. 2010, ArXiv e-prints
- Roxburgh & Vorontsov (2003) Roxburgh, I. W. & Vorontsov, S. V. 2003, A&A, 411, 215
- Scuflaire et al. (2008) Scuflaire, R., Montalbán, J., Théado, S., et al. 2008, Ap&SS, 316, 149
- Tassoul (1980) Tassoul, M. 1980, ApJS, 43, 469
- Vandakurov (1967) Vandakurov, Y. V. 1967, AZh, 44, 786
- Ventura et al. (2008) Ventura, P., D’Antona, F., & Mazzitelli, I. 2008, Ap&SS, 316, 93