System Size Dependence of Particle Production at the SPS
Abstract
Recent results on the system size dependence of net-baryon and hyperon production as measured at the CERN SPS are discussed. The observed dependences of yields, but also of dynamical properties, such as average transverse momenta, can be described in the context of the core corona approach. Other observables, such as antiproton yields and net-protons at forward rapidities, do not follow the predictions of this model. Possible implications for a search for a critical point in the QCD phase diagram are discussed. Event-by-event fluctuations of the relative core to corona source contributions might influence fluctuation observables (e.g. multiplicity fluctuations). The magnitude of this effect is investigated.
I Introduction
The system size dependence of particle production in heavy ion collisions can be measured in two ways: either by comparing central reactions of nuclei of different size, or by analyzing centrality selected minimum bias collisions of nuclei of fixed size. It turns out that many observables follow a very similar dependence, if their centrality dependence is studied. Usually a rapid change for very peripheral reactions is followed by only a weak variation towards very central collisions. This indicates that many features of system size dependences are dominated by the same underlying geometrically effects. It is therefore important to find a reliable way of modeling them in order to extract non-trivial effects.
II Core Corona Separation
A quite successful way of describing the main features of system size dependences of particle production is the core corona approach BOZEK ; BECATTINI1 ; BECATTINI2 ; AICHELIN1 . In this model a nucleus-nucleus collision is decomposed into a central core, which corresponds to the large fireball produced in central A+A collisions, and a surrounding corona, which is equivalent to independent nucleon-nucleon reactions. To quantify the relative contribution of the two components the fraction of nucleons that scatter more than once, , can be used. can simply be calculated within a Glauber model GLAUBER ; REYGERS . This quantity allows for a natural interpolation between the yields measured in elementary p+p () and in central nucleus-nucleus collisions ():
| (1) |
The left panel of Fig. 1 shows for various symmetric reaction systems. Due to their different surface to volume ratio, the dependence of is much steeper for smaller reaction systems than for larger ones. This feature of the model allows, for instance, to describe the centrality dependences of strange particle production measured for Cu+Cu and Au+Au collisions at RHIC TIMMINS . An important feature of the curves shown in the left panel of Fig. 1 is that the maximum value of depends on the size of the nuclei. While for very central Pb+Pb collisions can be reached, the maximum value for very central C+C reactions is significantly lower: . This dependence of is illustrated by the dashed red line. It has the important consequence that the different relative core corona contributions have to be taken into account when comparing even very central nucleus-nucleus collisions of different size, which usually are considered to represent only the core-like fireball. This effect might explain any observed system size dependence of the chemical freeze-out parameters and , as derived from statistical model fits to central A+A collisions for nuclei of different size (e.g. BECATTINI3 ). As a consequence of this it therefore follows that the system size does not provide a good control parameter to probe different regions of the QCD phase diagram via the production of fireballs of different temperature BLUME1 . It is thus more likely that one only observes a change in the relative admixture of central fireball (core) and peripheral p+p like corona, whose freeze-out parameters are different, but independent of the size of the involved nuclei. In any case the underlying effect from the core corona separation should be taken into account when chemical freeze-out parameters are extracted.
Another interesting aspect of the core corona approach is shown in the right panel of Fig. 1. Here, the dependence of is shown for asymmetric collisions. In this case quite distinct centrality dependences can be observed. While for symmetric collisions this dependence is following a continuous rise (left panel of Fig. 1), for asymmetric collision systems with a small projectile nucleus (e.g. O+Pb or Si+Pb) a rapid rise followed by a maximum and a subsequent decrease of is seen. Therefore, a similar centrality dependence of particle yields can be expected for these type of collisions and its measurement would constitute a test for the validity of the core-corona model BLUME1 .
III Strangeness Production
The left panel of Fig. 2 shows the system size dependence of the strangeness enhancement factors measured by the NA49 collaboration at = 17.3 GeV NA49HYSDEP ; BLUME2 . For this measurement is defined relative to p+p reactions as baseline:
| (2) |
As a general feature a rapid rise of for is seen, which then turns into a slow increase with for , , and , or even into a saturation (). Comparable observations have been made by the NA57 experiment NA57ENHANCE at the same and by the STAR collaboration at = 200 GeV STARENHANCE .
In the context of statistical models, the system size dependence of strange particle production was expected to be described by the transition from a canonical to a grand canonical ensemble HAMIEH . This effect provides a natural explanation of the hierarchy of the suppression pattern, which depends on the strangeness content of the particles (). However, the onset of the enhancement is predicted to happen for smaller systems (), than observed in the data. Also, this model does not explain the slow rise with seen for and for mid-central and central collisions. However, within the core corona model this behavior can be described naturally, as described in the previous section. This is illustrated by the solid lines shown in the left panel of Fig. 2.
It is interesting to note that this approach not only matches the observed centrality dependences of yields, but does also describe dynamical quantities such as the average transverse momenta . This is shown in the right panel of Fig. 2 for strange particles and (anti-)protons NA49HYSDEP ; NA49SDPR1 . A similar observation has been made for elliptic flow at RHIC AICHELIN2 .
IV Centrality Dependence of Net Protons
Recent data on proton and antiproton production allow to study the system size dependence of stopping NA49SDPR2 . In this analysis the rapidity spectra of net-protons () have been determined in several bins of centrality for minimum bias Pb+Pb collisions at 40 and 158 GeV. Based on this data the centrality evolution of net-proton yields at different rapidities can be investigated. The left panel of Fig. 3 shows a comparison of the net-proton yields normalized by () as measured at midrapidity and at forward rapidity at 158 GeV. While the midrapidity net-proton yields are slightly rising from peripheral to central Pb+Pb collisions, the forward yields exhibit a significantly different centrality dependence. Here the normalized yields are constant from very peripheral on or even drop towards very central collisions. In contrast to the net-protons at midrapidity, the forward yields can therefore also not be described by the core corona approach. This implies that for the system size dependence of stopping, i.e. the processes that transport baryon number along the longitudinal axis and which dominate the net-proton spectra at forward rapidities, the distinction between core and corona is not important. These processes do not seem to depend to strongly on the number of collisions that a single nucleon experiences.
For the yield of antiprotons a different centrality dependence is observed than for other particles NA49SDPR2 (right panel of Fig. 3). In this case the yield per participant is decreasing from p+p collisions towards central Pb+Pb reactions. This is most likely caused by absorption antibaryons in the fireball medium. Also this effect is difficult to describe in the core corona framework, since it rather depends on the average path length of the antiprotons inside the fireball medium than on relative size of core and corona. The resulting antiproton yields will thus be rather a complicated interplay between the system size dependences of production and absorption mechanism.
V Multiplicity Fluctuations
The system size dependence of multiplicity fluctuations was measured by the NA49 experiment NA49SDMFLUC . The fluctuations, quantified by the variance of the event-by-event measured multiplicity normalized by its mean , exhibit a quite distinct centrality dependence. While at = 17.3 GeV is found for p+p collisions, very peripheral Pb+Pb reactions result in much higher fluctuations ( for all charged particles) which then decrease towards very central collisions where close to unity is observed again. In the following we investigate to what extend these fluctuations could be caused by geometry fluctuations that are intrinsic to the core corona approach. This source of fluctuations is of special interest, since it will be present even in the idealized situation of a perfect centrality selection, corresponding to the hypothetical situation where the number of participants could be fixed exactly in the experiment. Also in the case = fixed, the relative contribution of the core and the corona, as given by , will still fluctuate from event to event. The upper left panel of Fig. 4 shows the distribution of versus , as calculated within a Glauber model GLAUBER ; REYGERS . The event-by-event distribution of is much wider for peripheral reactions than for central ones. The resulting variance (see upper right panel of Fig. 4) has a dependence that is quite similar to the one observed for multiplicity fluctuations. Since the particle yield per participating nucleon is smaller for the corona than for the core part, the fluctuations in will translate into multiplicity fluctuations that should be part of the observed ones. To evaluate how large this contribution can be, a simple Monte Carlo model was constructed. In this model the multiplicity of a given event is calculated according to Eq. (1). The event-by-event yields of the core and corona sources, and , are generated from Poisson distributions, whose means have been adjusted to the measured midrapidity yields per participating nucleon of charged pions in central Pb+Pb (core) NA49PIPBPB and p+p (corona) NA49PIPP collisions. The value of for a given is sampled from the distribution shown in Fig. 4. In the lower left panel of Fig. 4 the result of this simulation is shown. This way one obtains multiplicity fluctuations whose centrality dependence has the same shape as the one observed in the data. However, the magnitude of the fluctuations is much higher in the data than what results from this model study (see the comparison in the lower right panel of Fig. 4). The difference between the yields and would need to be two orders of magnitude higher to reach the level of the measurement.
VI Conclusions
Many observables measured in heavy ion reactions turn out to follow a very similar centrality dependence, which is characterized by a rapid rise in the region of very peripheral collisions followed by a significantly slower increase towards very central ones. This include the yields per participant of strange particles, but also their mean transverse mass and even elliptic flow . It is found that the core corona model provides a very effective way to describe the main features of this geometry driven behavior and thus constitutes a good comparison baseline which allows to separate non-trivial effects. Observed exceptions to this general picture are, for instance, the centrality dependence of antiproton yields and net-proton at forward rapidities, where more complicated physical processes are involved (absorption of antibaryons, baryon number transport) which cannot easily be described by the core corona approach. For asymmetric collisions a significantly different centrality dependence than for symmetric ones is predicted by this model, which is characterized by a maximum for mid-central and a drop towards central collisions. Therefore the investigation of asymmetric collisions might provide a good test for the core corona approach. Another consequence of this model is that the observed change of the chemical freeze-out temperature as derived from statistical model analyses is basically only due to a change of the relative admixture of the core and corona contributions. Therefore, the system size might not provide a good control parameter to scan the QCD phase diagram, since the properties of the central core fireball might in fact not change and the system always follows the same trajectories through the phase diagram. Event-by-event fluctuations of the relative core and corona contribution, which must be present even in the case of an ideal centrality selection (i.e. = fixed), do contribute to multiplicity fluctuations. However, the magnitude of this effect is way too small to explain the measured data. Still, further studies might help to understand the system size dependences of fluctuations of non-intensive quantities, such as K/ fluctuations.
Acknowledgements.
The author would like to thank K. Reygers for the help with the Glauber model calculations and acknowledges many stimulating and helpful discussions with J. Aichelin and F. Becattini.References
- (1) P. Bozek, Acta Phys. Polon. B 36, 3071 (2005).
- (2) F. Becattini and J. Manninen, J. Phys. G 35, 104013 (2008).
- (3) F. Becattini and J. Manninen, Phys. Lett. B 673, 19 (2009).
- (4) J. Aichelin and K. Werner, Phys. Rev. C 79, 064907 (2009).
- (5) R.J. Glauber, Phys. Rev. 100, 242 (1955).
- (6) M.L. Miller, K. Reygers, S.J. Sanders, and P. Steinberg, Ann. Rev. Nucl. Part. Sci. 57, 205 (2007).
- (7) A.R. Timmins et al. (for the STAR Collaboration), Nucl. Phys. A 830, 829c (2009).
- (8) F. Becattini, J. Manninen, and M. Gaździcki, Phys. Rev. C 73, 044905 (2006).
- (9) C. Blume, J. Phys.: Conf. Ser. 230, 012003 (2010).
- (10) T. Anticic et al. (NA49 Collaboration), Phys. Rev. C 80, 034906 (2009).
- (11) C. Blume (for the NA49 Collaboration), J. Phys. G 35, 044004 (2008).
- (12) F. Antinori et al. (NA57 Collaboration), J. Phys. G 32, 427 (2006).
- (13) B.I. Abelev et al. (STAR Collaboration), Phys. Rev C 77, 044908 (2008).
- (14) S. Hamieh, K. Redlich, and A. Tounsi, Phys. Lett. B 486, 61 (2000).
- (15) T. Anticic et al. (NA49 Collaboration), Phys. Rev. C 69, 024902 (2004).
- (16) J. Aichelin and K. Werner, J. Phys. G 37, 094006 (2010).
- (17) T. Anticic et al. (NA49 Collaboration), arXiv:1009.1747.
- (18) C. Alt et al. (NA49 Collaboration), Phys. Rev. C 73, 044910 (2006).
- (19) C. Alt at al. (NA49 Collaboration), Phys. Rev. C 75, 064904 (2007).
- (20) S.V. Afanasiev et al. (NA49 Collaboration), Phys. Rev. C 66, 054902 (2002).
- (21) C. Alt et al. (NA49 Collaboration), Eur. Phys. J. C 45, 343 (2006).
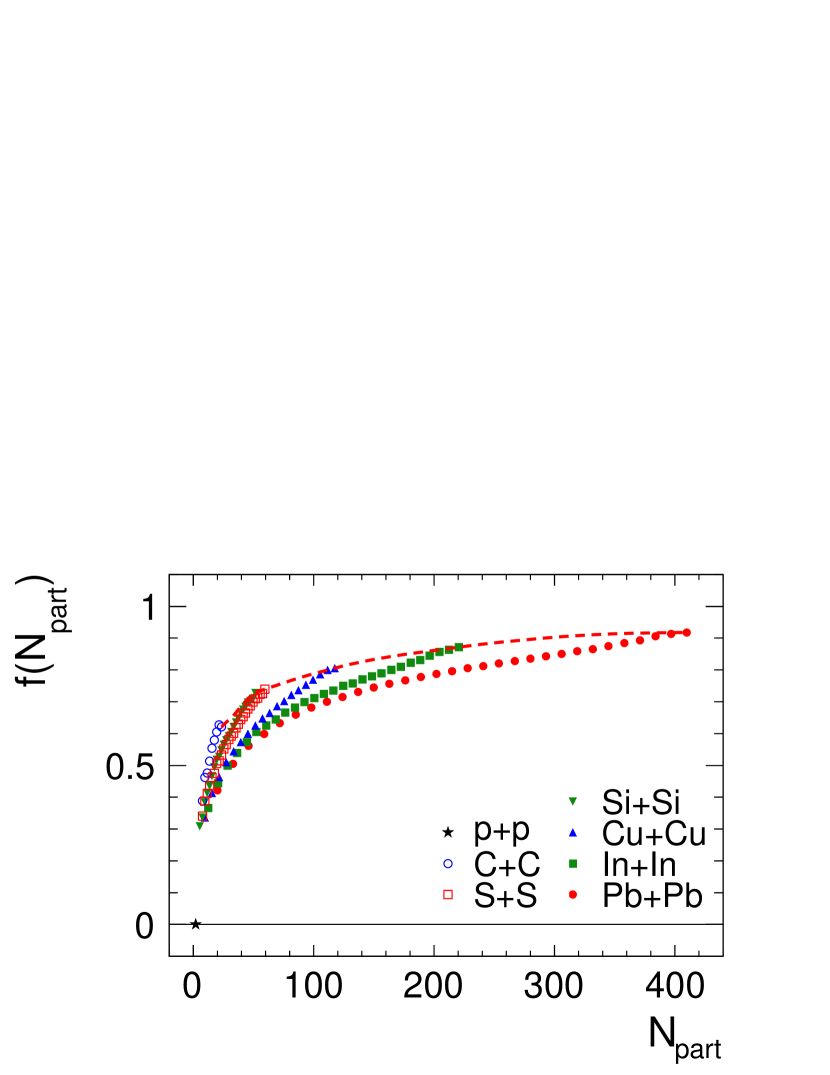
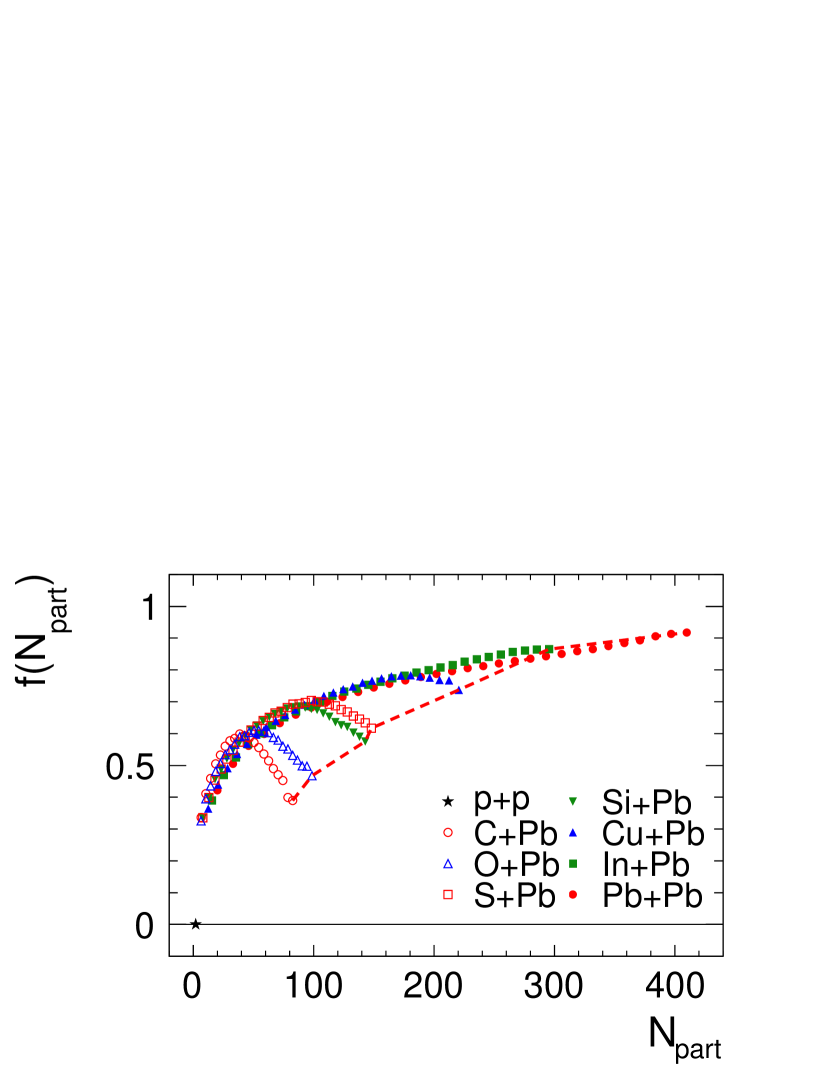
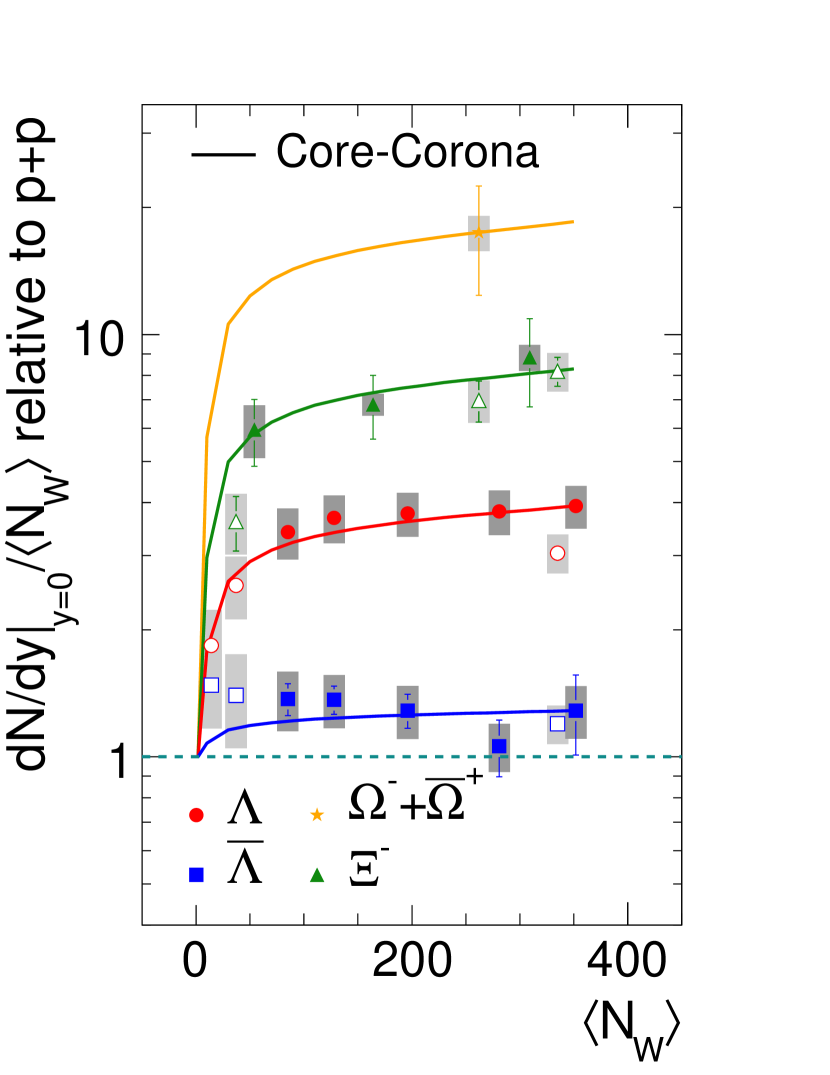
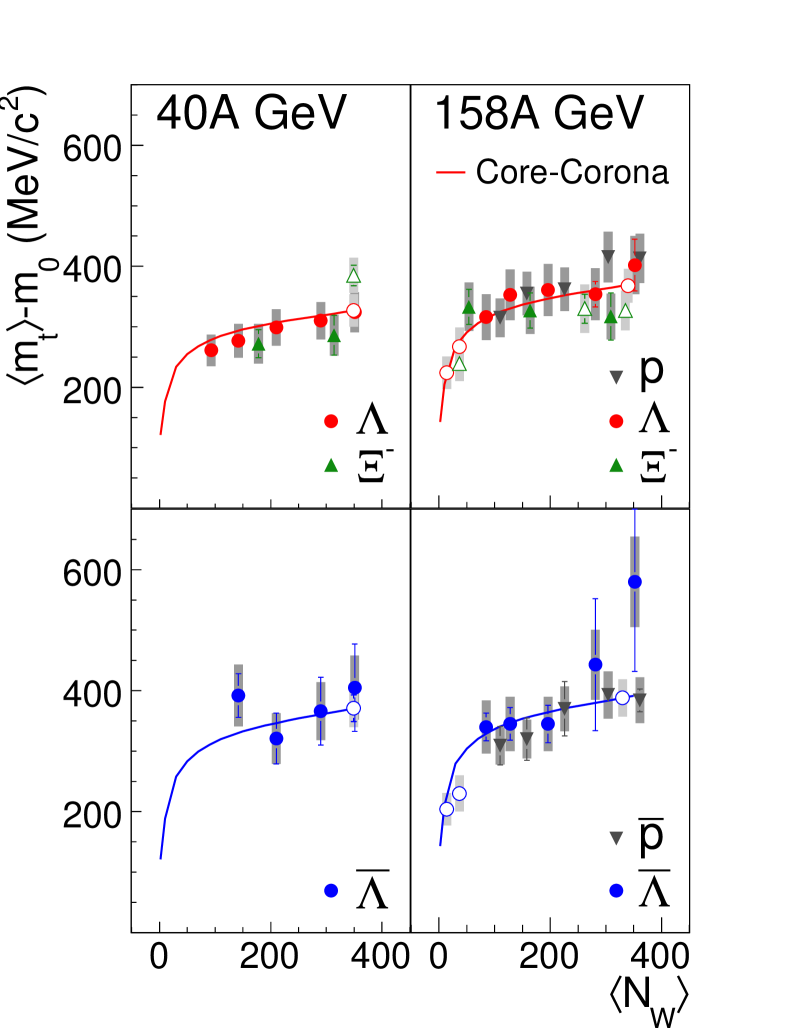
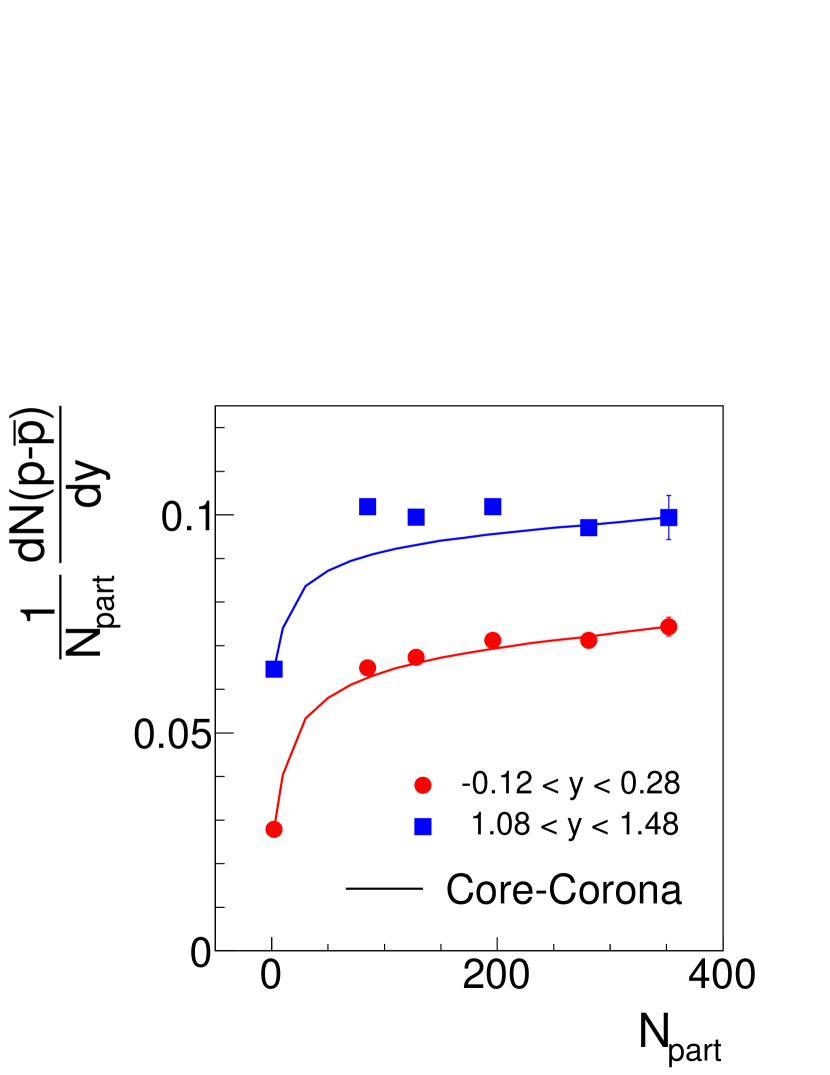
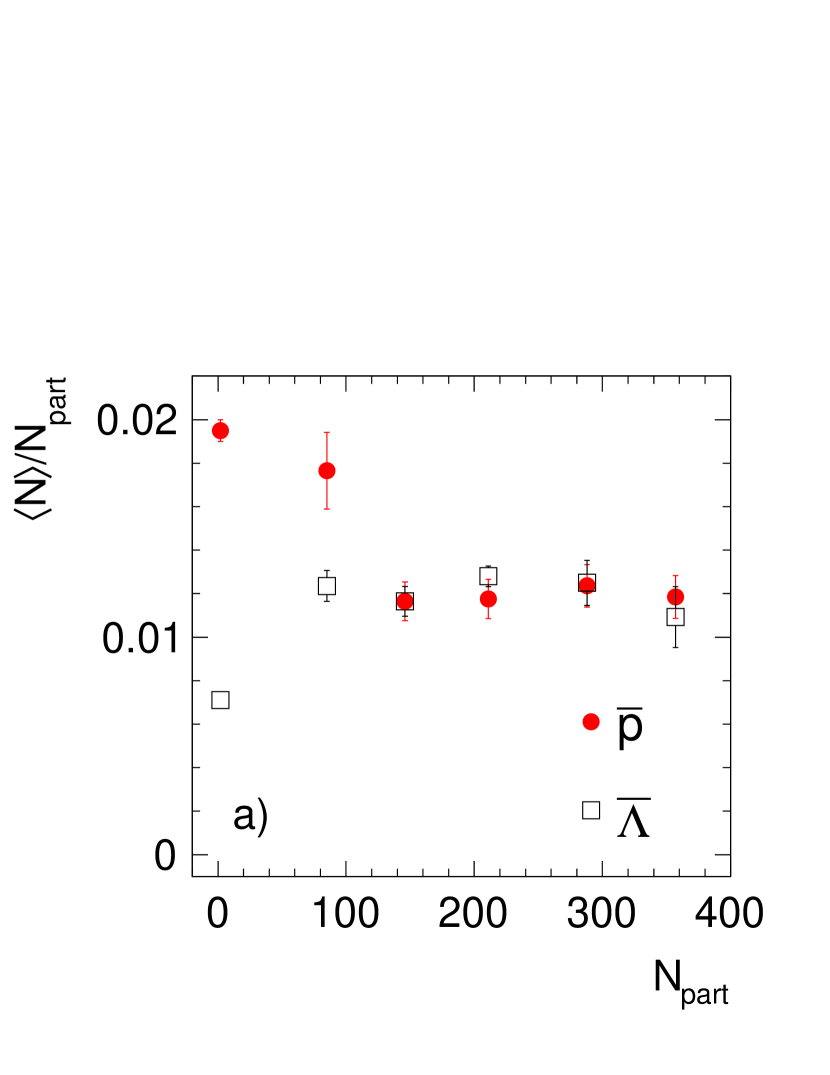
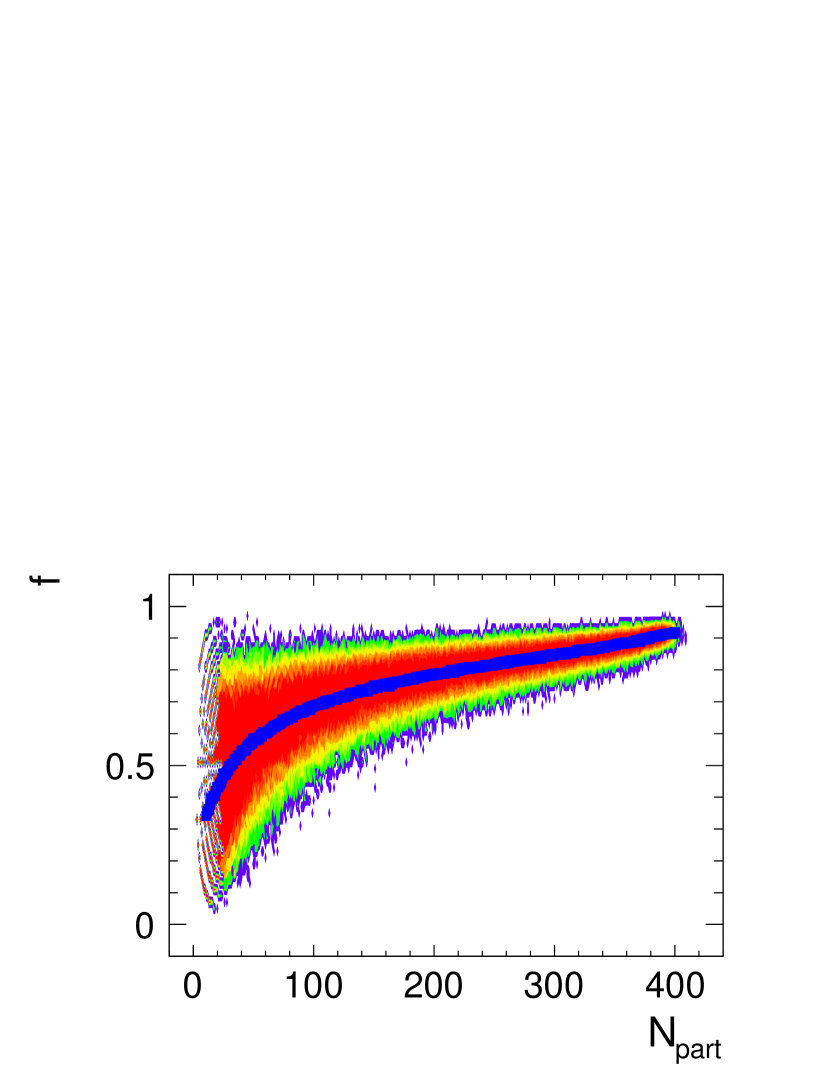
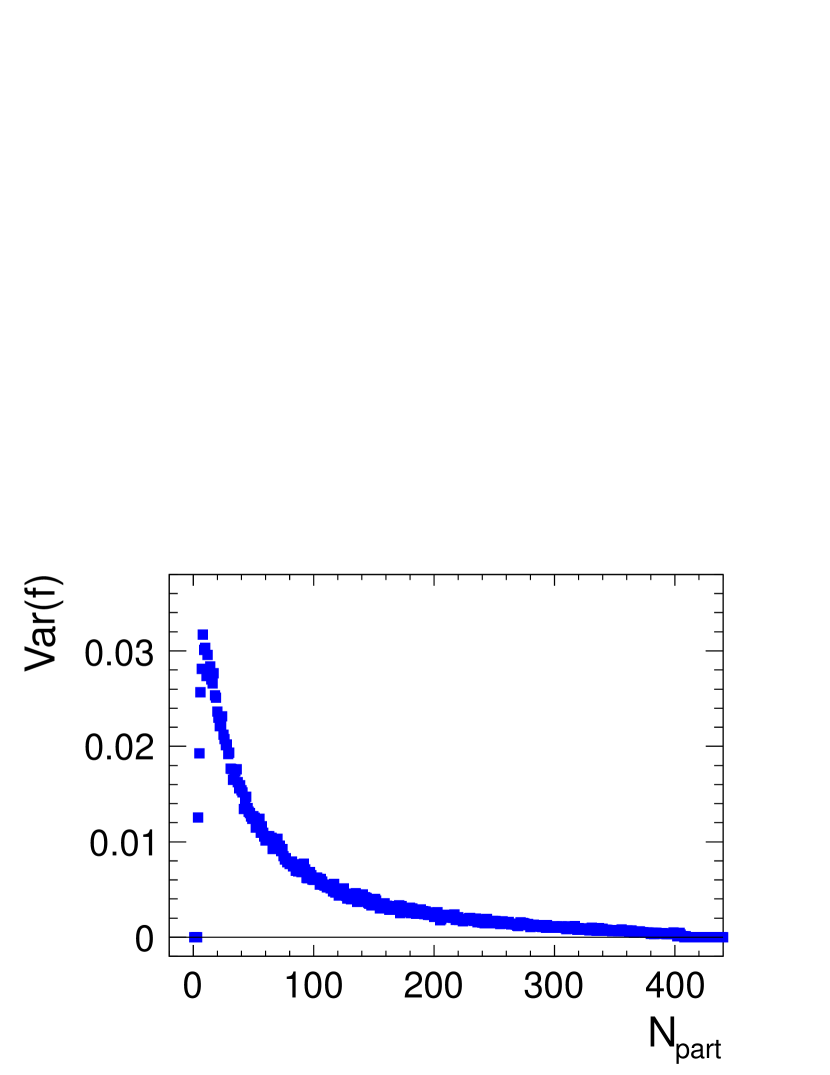
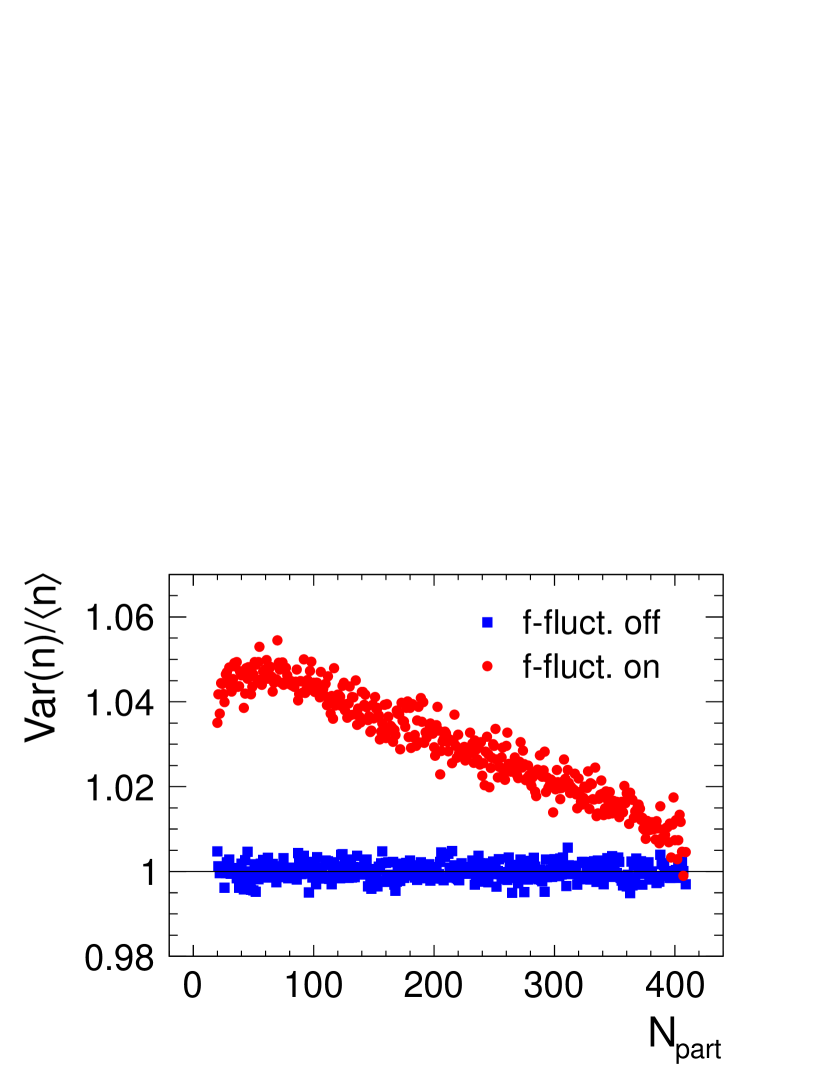
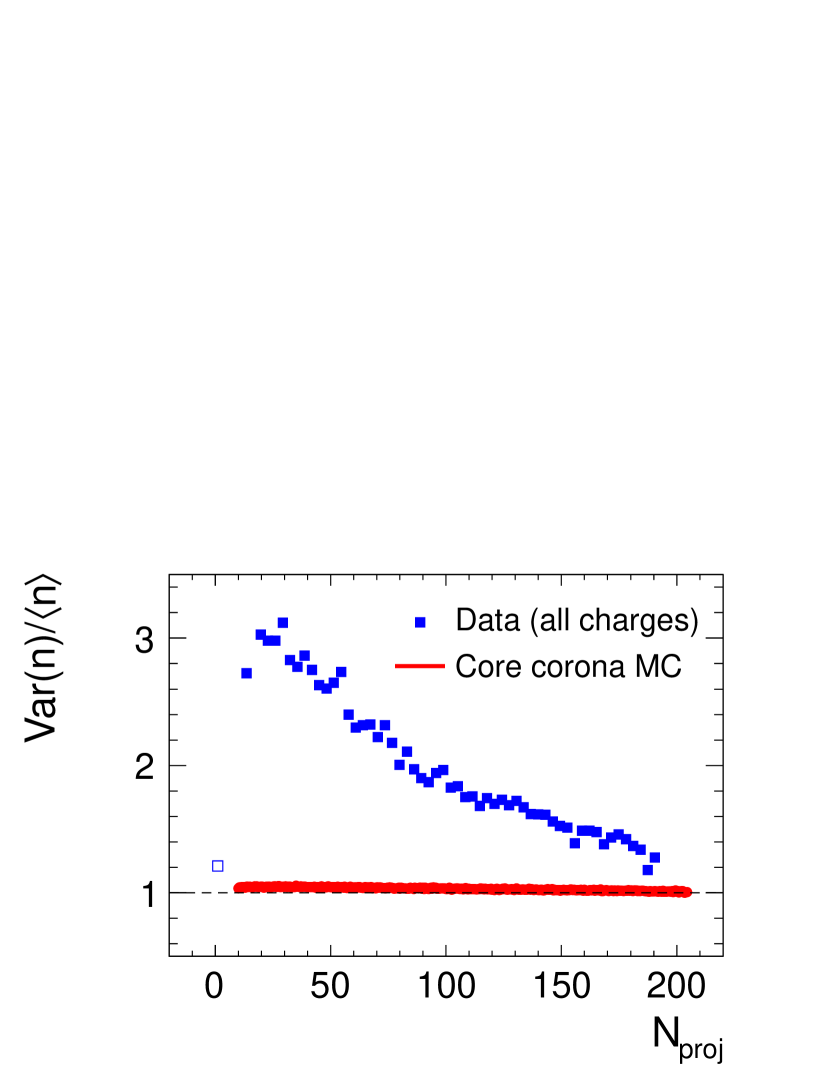
FIGURE CAPTIONS
-
FIG. 1:
The fraction of participating nucleons that scatter more than once as a function of the number of participants . was calculated within a Glauber model GLAUBER ; REYGERS . The left panel shows results for symmetric systems, the right panel for asymmetric ones. The dashed lines connect the values for the most central collisions.
-
FIG. 2:
Left: The midrapidity yields of , , , and per wounded nucleon relative to p+p yields for central C+C, Si+Si and minimum bias Pb+Pb reactions at 158 GeV NA49HYSDEP ; BLUME2 . Right: The values of strange particles and (anti-)protons at mid-rapidity for Pb+Pb collisions at 40 and 158 GeV, as well as for near-central C+C and Si+Si reactions at 158 GeV NA49HYSDEP . The (anti-)proton data are taken from NA49SDPR1 . Also shown are the results from a fit for and with the core-corona approach (solid lines).
-
FIG. 3:
Left: The net-proton yields per number of wounded nucleons at forward rapidity and at midrapidity for centrality selected Pb+Pb collisions at 158 GeV. Right: The total antiproton and antilambda yields per number of wounded nucleon at midrapidity for centrality selected Pb+Pb collisions at 158 GeV NA49SDPR2 .
-
FIG. 4:
The distribution of the fraction of nucleons that scatter more than once (upper left) and the corresponding variance (upper right), both as a function of as calculated for Pb+Pb collisions at 158 GeV. The lower left panel shows the multiplicity fluctuations generated with the MC model (see text for details). The red circles display the result if event-by-event fluctuations of are included, while the blue boxes correspond to the case where they are switched off. The lower right panel shows multiplicity fluctuations for all charges versus the number of projectile participants as measured in Pb+Pb collisions at 158 GeV NA49SDMFLUC (blue boxes). The red line is the same MC result as shown in the left panel.