11email: zejda@physics.muni.cz 22institutetext: Astronomical Institute, Faculty of Mathematics and Physics, Charles University Prague, V Holešovičkách 2,
CZ-180 00 Praha 8, Czech Republic 33institutetext: Astronomical Institute, Academy of Science of CR, Ondřejov, Czech Republic 44institutetext: Observatory and Planetarium of J. Palisa, VŠB – Technical University, Ostrava, Czech Republic 55institutetext: Astronomical Institute of Slovak Academy of Science, Tatranská Lomnica, Slovakia 66institutetext: private observatory, Brno, Czech Republic 77institutetext: Hvar Observatory, Faculty of Geodesy, Zagreb University, Zagreb, Croatia
Photometric and spectroscopic investigation of TW Draconis
Abstract
Context. TW Draconis is one of the best studied Algol-type eclipsing binaries. There is significant evidence for miscellaneous physical processes between interacting binary components manifesting themselves by period and light curve changes.
Aims. Obtaining new set of photometric and spectroscopic observations, we analysed them together with the older spectroscopic and photometric data to build model of this eclipsing system with respect to observed changes of O-C diagram and light curve.
Methods. Reduction of new spectra was carried out in the IRAF and SPEFO programs. Radial velocities were determined manually using SPEFO, by CCF and from the program KOREL. Orbital elements were derived with the FOTEL program and via disentangling with KOREL. The final combined solution was obtained with the programs PHOEBE and FOTEL.
Results. Photometry shows small irregularities in light curves as a results of pulsating of one component and spot activity. Using net of KOREL outputs we found the mass ratio q=0.405(3). We confirm the presence of stellar matter around the primary. Even after subtraction of ADS 9706B influence, light curve solutions show third light in the system. Models in FOTEL and Phoebe are presented.
Conclusions. TW Dra is an astrophysically very interesting eclipsing binary. Future combination of interferometry, spectroscopy, and photometry is promising. It could definitely confirm the hypothesis of quadruple system for TW Dra and explain behaviour of this system in complex.
Key Words.:
stars: binaries: eclipsing – stars: fundamental parameters – stars: individual: TW Dra1 Introduction
TW Draconis (=15, =63°54′26″(2000.0)) is a well-known and often observed Algol-type eclipsing binary. The variability of the star was discovered by Cannon (see Pickering, 1910). The variable star is an A-component of visual binary ADS 9706. The main light changes with amplitude in 2.3 mag in primary minimum are caused by 11.5 hours eclipses of the hot main sequence A8V star by the cooler and fainter K0III giant component.
First light curve solution based on photometric observations was made by Baglow (1952), who also mentioned large distortion of the secondary component. However, to obtained good solutions with low residuals he assumed very low values of limb darkening coefficients and he obtained also surprisingly low reflection parameters. During further and longer monitoring of TW Dra behaviour Walter (1978) found large changes of orbital period and changes of the light curve outside the minima, especially around secondary minimum caused by gas stream and a large hot spot in the target area of it. Observations made by Baglow (1952); Walter (1978) were reprocessed by e.g. Giuricin et al. (1980) or Al-Naimiy & Al-Sikab (1984). Papoušek et al. (1984) made several years to obtain light curve solution of the system. They mentioned larger scatter of the phased light curved but without any discussion in detail.
Although TW Dra was studied spectroscopically several times since 1919, secondary component was firstly detected in spectrum by Smith (1949) and the radial velocity of both components were measured only by Popper (1989). The published values of mass ratio of the components differs from 0.28 (Pearce, 1937) to 0.47 Richards & Albright (1994).
TW Dra was also included in several surveys. Singh et al. (1995) studied X-ray radiation in five Algol-like stars using ASCA and ROSAT satellites. He obtained first X-ray spektrum of TW Dra and confirmed previous paper revealing TW Draconis as a X-ray source (White & Marshall, 1983). Umana et al. (1991) studied microwave radiation among Algols. They found radio-fluxes of Algols are generally comparable to them emitting from the RS CVn stars. During this study in the interval 1984–1989 went the radio-flux of TW Draconis down by factor 10. In summary although TW Draconis is known and studied the satisfactory complex solution of this unique system has not been published up to now. Zejda et al. (2008) published detailed study of period changes in the system.
The main goal of this study is to find the correct spectroscopic mass ratio of the main components and to calculate new light curve and radial velocity curve solutions based on our new measurements.
2 Observations and reduction
2.1 Photometry
TW Dra was monitored during photometric campaign in 2001–2007. Almost 50 000 usable measurements in UBVRI bands were collected (see journal of observations in Tab. 1). However, only Hvar measurements were transformed into the standard magnitudes. Suhora observations are only in differential magnitudes as well as all CCD measurements.
| Observer(s); place | Year(s) | Equipment(s) | |||||
| CCD | |||||||
| Brát; Pec pod Sněžkou | 2005 | 200/1850 | - | - | - | 154 | - |
| privat observatory, CZ | |||||||
| Hroch; Brno, Masaryk | 2006 | 620/2780 | - | 57 | 57 | - | - |
| university Observ.,CZ | |||||||
| Chrastina, Szász; obs. | 2005 | 179/1000 | - | 300 | 300 | 299 | 301 |
| Hlohovec, Slovakia | |||||||
| Svoboda; Brno, | 2006-7 | 15/116 | - | 147 | - | - | - |
| privat observatory,CZ | 35/135 | - | 688 | - | - | 513 | |
| Zejda; N. Copernicus | 2001-7 | 400/1750 | - | 225 | 6213 | 6089 | 6073 |
| Obs. and planet. Brno, CZ | 40/360 | - | - | - | 900 | 3301 | |
| 40/360 | - | 1662 | 639 | 715 | - | ||
| 200/1000 | - | 7452 | 5017 | 5028 | 5021 | ||
| PEP | |||||||
| Zejda, Janík, Božić; | 2005 | 650/7280 | 136 | 136 | 136 | - | - |
| Hvar observatory, Croatia | |||||||
| Zejda, Janík, Ogloza; | 2006 | 600/7500 | - | 2547 | 2552 | 2547 | 406 |
| Mt. Suhora obs., Poland |
The period of the system is changing in at least two modes (Zejda et al., 2008). The present photometric data were all obtained in the epoch after the last great period change. Thus the period in the epoch of our observations is almost constant and light ephemeris in a linear approximation for this epoch could be used. Mikulášek’s method based on Principal Component Analysis (hereafter PCA) (Mikulášek, 2007) was used to combine all our photometric measurements on different magnitude scale made in different time intervals to determine following light ephemeris:
| (1) |
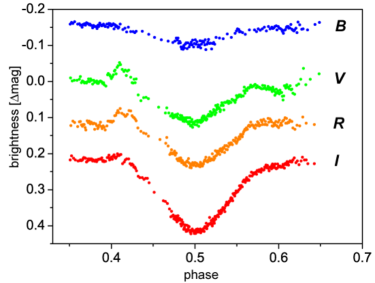
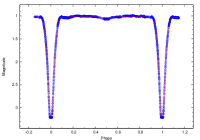
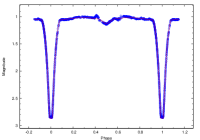
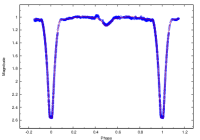
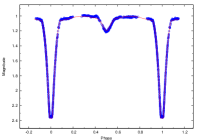
Despite of our CCD observations lower accuracy, small oscillations were detected on light curve, in and filters, respectively. Pulsation period 0.0519(3) d and semi-amplitude mmag (Zejda et al., 2006) found in our B measurements and 0.0501(13)d with mmag in B measurements of Papoušek et al. (1984) are in agreement with Kusakin et al. (2001) (0.0556 d, mmag in ) and Kim et al. (2003) (0.053 d, mmag). Change in pulsations amplitude is probably due to superposition of different pulsation modes as described in RZ Cas (Mkrtichian et al., 2008). Large scatter in maximum of brightness in eclipsing phased light curve is also caused by oscillations and their superpositions from different orbital cycles.
Regardless of confirmed oscillations, deformations of light curve, which persist at least during several orbital cycles, can be easily seen as well. Our measurements show a small decrease (0.04 mag in ) after the egress from primary eclipse (phase 0.10–0.19) previously mentioned by Baglow (1952) and Walter (1978) and a bump of 0.055 mag (), 0.030 mag (), 0.02 mag () before the secondary eclipse (phase 0.40–0.43) (see Fig. 1).
The most obvious light curve phenomenon is a dependence of the secondary minimum depth on wavelength. While in band the secondary minimum is scarcely visible (=0.063 mag), in filter is easily detectable (=0.196 mag) (see Fig. 1).
2.2 Spectroscopy
The spectroscopic observations (46 spectra) were made in JD interval 2453111–2454218 using Coudé spectrograph of the 2.0-m Ondřejov reflector, equipped with a SITe-005 800x2000 CCD; the spectra cover the H region from 628.0 to 672.0 nm, with a linear dispersion of 17 nm mm-1, two-pixel resolution of 12700, and ranging up to 478. Spectra with an average signal-to-noise (S/N) ratio lower than 95 in continuum near H line were excluded. Finally 37 spectra were analysed (see journal of our spectroscopic observations in Tab. 2).
In all cases, the wavelength calibration was based on ThAr comparison spectra taken before and after the stellar exposure. Mean flatfield images from the same night as the stellar spectrum were always applied.
3 Radial velocities
We used three methods to obtain RV curves of components of this binary system. Unfortunately the lines of the secondary component being poorly resolved. The secondary component was detectable only on some well exposed spectrograms. In SPEFO the RV’s were measured interactively, comparing the direct and flipped images of the line profiles. The zero point of RV scale was corrected through the use of reliable telluric lines – see Horn et al. (1996) for details.
To obtain RVs we also used the code based on cross-corelation method (see Zverko et al., 2007). The needed synthetic spectra were calculated according to the parameters from Al-Naimiy & Al-Sikab (1984) by the code SYNTHE (see Sbordone et al., 2004)111For the most recent update of the program and its manual see Sbordone & Bonifacio 2005, and the code SYNSPEC, which is able to calculate spectra from TLUSTY (Lanz & Hubeny, 2007) and ATLAS model atmospheres.
Results of the two first methods are shown in Table 2. Finally we used also the spectral disentangling technique (see relevant section) to obtain radial velocities.
| No. | Phase | S/N | Weight | phase | |||||
|---|---|---|---|---|---|---|---|---|---|
| 1 | 53111.5121 | 0.6008 | 162.4 | 0.365 | 35.4(1.0) | -90(4) | 34.13(3) | 0.6008 | |
| 2 | 53145.3644 | 0.6615 | 227.1 | 0.713 | 53.8(1.8) | -106(3) | 56.80(3) | -129.33(49) | 0.6615 |
| 3 | 53153.3578 | 0.5093 | 489.3 | 3.311 | 4.8(1.2) | 2(3) | 5.67(3) | 3.06(30) | 0.5093 |
| 4 | 53254.3689 | 0.4969 | 311.6 | 1.343 | 1.1(0.9) | -4(4) | 3.10(3) | 7.73(32) | 0.4969 |
| 5 | 53454.4151 | 0.7681 | 389.0 | 2.093 | 66.0(1.3) | -103(5) | 63.05(3) | -134.91(49) | 0.7681 |
| 6 | 53459.4299 | 0.5547 | 98.8 | 0.135 | 16.9(1.3) | -61(10) | 19.65(4) | 0.5547 | |
| 7 | 53460.3532 | 0.8837 | 195.6 | 0.529 | 42.3(1.7) | -98(4) | 41.46(3) | 0.8837 | |
| 8 | 53461.5080 | 0.2951 | 219.9 | 0.669 | -58.7(1.5) | 131(8) | -60.71(3) | 133.83(51) | 0.2951 |
| 9 | 53463.4444 | 0.9850 | 106.8 | 0.158 | -1.5(2.7) | -14(4) | 9.94(19) | -7.24(07) | 0.9850 |
| 10 | 53463.4912 | 0.0016 | 359.4 | 1.786 | 2.2(1.1) | 2(2) | 4.50(29) | 2.29(07) | 0.0016 |
| 11 | 53464.4606 | 0.3470 | 304.5 | 1.282 | -50.7(1.4) | 108(13) | -52.39(3) | 99.43(50) | 0.3470 |
| 12 | 53465.5142 | 0.7224 | 224.6 | 0.698 | 61.8(1.5) | -110(6) | 65.20(3) | -134.91(47) | 0.7224 |
| 13 | 53504.4166 | 0.5823 | 262.5 | 0.953 | 28.1(1.0) | -101(5) | 27.75(3) | 0.5823 | |
| 14 | 53510.4323 | 0.7255 | 305.8 | 1.293 | 59.3(1.5) | -108(5) | 62.24(3) | -134.91(53) | 0.7255 |
| 15 | 53511.4030 | 0.0713 | 274.5 | 1.042 | -23.1(2.6) | 38(7) | -23.02(4) | -4.41(28) | 0.0713 |
| 16 | 53516.5391 | 0.9012 | 183.3 | 0.465 | 37.9(1.8) | -97(4) | 43.22(4) | 0.9012 | |
| 17 | 53538.3802 | 0.6826 | 243.9 | 0.823 | 57.2(1.8) | -107(3) | 59.18(4) | -129.42(48) | 0.6826 |
| 18 | 53542.4899 | 0.1468 | 270.9 | 1.015 | -44.7(1.8) | 102(7) | -49.02(4) | 120 | 0.1468 |
| 19 | 53550.4130 | 0.9696 | 137.5 | 0.261 | 11.8(3.7) | -9(4) | 30.08(6) | 2.56(19) | 0.9696 |
| 20 | 53550.4357 | 0.9777 | 114.9 | 0.183 | 4.1(2.7) | -13(4) | 17.54(9) | -4.63(13) | 0.9777 |
| 21 | 53619.3175 | 0.5184 | 386.4 | 2.065 | 7.7(1.3) | -10(4) | 9.08(3) | 0.5184 | |
| 22 | 53764.6405 | 0.2932 | 189.4 | 0.496 | -61.3(2.0) | 129(5) | -55.49(3) | 146.73(52) | 0.2932 |
| 23 | 53764.6771 | 0.3062 | 223.0 | 0.688 | -54.2(1.4) | 130(8) | -54.14(3) | 132.75(55) | 0.3062 |
| 24 | 53765.6086 | 0.6381 | 372.3 | 1.917 | 45.7(1.2) | -102(4) | 49.51(3) | -93.09(51) | 0.6381 |
| 25 | 53846.3238 | 0.3948 | 351.6 | 1.710 | -35.8(0.9) | 109(4) | -36.33(3) | 0.3948 | |
| 26 | 53860.3570 | 0.3944 | 364.9 | 1.841 | -34.6(1.0) | 103(7) | -33.91(3) | 0.3944 | |
| 27 | 53991.3876 | 0.0772 | 196.2 | 0.532 | -27.3(1.3) | 61(3) | -24.87(4) | -7.60(29) | 0.0772 |
| 28 | 54000.4012 | 0.2885 | 330.3 | 1.509 | -62.0(1.4) | 144(5) | -64.17(4) | 140.44(51) | 0.2885 |
| 29 | 54017.3270 | 0.3187 | 175.8 | 0.427 | -56.3(1.1) | 118(7) | -59.18(4) | 125.60(52) | 0.3187 |
| 30 | 54026.3265 | 0.5250 | 211.0 | 0.616 | 8.5(1.2) | -8(4) | 9.94(3) | 3.10(28) | 0.5250 |
| 31 | 54115.6199 | 0.3378 | 187.9 | 0.488 | -45.4(1.7) | 94(11) | -45.37(3) | 97.30(49) | 0.3378 |
| 32 | 54191.4998 | 0.3718 | 149.7 | 0.310 | -37.8(2.7) | 78(11) | -40.29(3) | 0.3718 | |
| 33 | 54192.4449 | 0.7086 | 319.6 | 1.413 | 61.7(2.6) | -94(5) | 64.13(3) | -142.46(48) | 0.7086 |
| 34 | 54192.4913 | 0.7251 | 191.9 | 0.509 | 58.7(2.9) | -100(8) | 64.76(3) | -144.31(49) | 0.7251 |
| 35 | 54203.3567 | 0.5961 | 364.4 | 1.836 | 39.8(1.3) | -101(3) | 38.76(3) | 0.5961 | |
| 36 | 54217.3376 | 0.5772 | 214.2 | 0.634 | 31.6(1.1) | -92(4) | 30.62(3) | 0.5772 | |
| 37 | 54218.4308 | 0.9666 | 254.2 | 0.894 | 29.0(2.1) | -36(6) | 27.34(5) | -0.49(21) | 0.9666 |
Notes: Phases were calculated using ephemeris 1.
3.1 Spectral disentangling
As a third approach for determination of radial velocity curves the code KOREL was used (Hadrava, 1997, 2004b). This code enables decomposition of light joint from several sources using Fourier disentangling with intrinsic line-profile variations. Twelve short regions in wavelength interval 626–677 nm and later on 5 regions from them joint in one multiple solution were used (see Tab. 3).
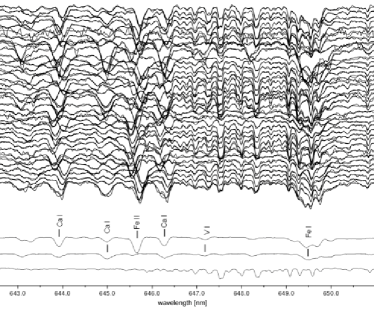
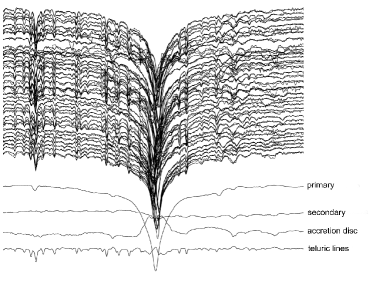
We first measured the for all spectra in the region 661.5–662.0 nm and weighted them with weights proportional to and normalized to one for the mean value. These weights were used in the control file of the auxiliary program PREKOR (Hadrava, 2004b) that prepares the input data for KOREL. Firstly we derived the line strengths of the telluric spectra for the wavelength range 646.5 – 651.0 nm, which contains a number of strong water vapour lines and then kept these strengths fixed in all subsequent solutions with KOREL. We derived the KOREL solutions separately for the regions shown in the Tab. 3. See an example of done disentagled region in Fig. 3.
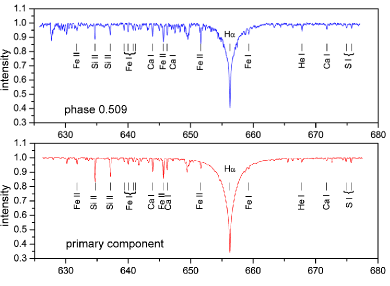
In the process of trial solutions was found that in wavelength interval 650–662 nm the H line profile is deformed by presence of emission (see Fig. 4), probably caused by the accretion disc, which is in agreements with preliminary result in Richards & Albright (1999). However, this region was not included into following solutions.
| No. | Region | Primary comp. | Secondary comp. | |||
|---|---|---|---|---|---|---|
| [nm] | line | line | ||||
| [nm] | [nm] | |||||
| 1* | 632.50-636.97 | Si II | 634.7109 | Ca I | 633.0850 | |
| Fe I | 636.2338 | |||||
| 2 | 633.97-642.69 | Si II | 634.7109 | Fe I | 636.2338 | |
| Si II | 637.1371 | Fe I | 638.0743 | |||
| Fe I | 639.3601 | Fe I | 641.4980 | |||
| Fe I | 640.0001 | |||||
| Fe I | 640.8018 | |||||
| Fe I | 641.1649 | |||||
| 3 | 634.90-642.76 | Si II | 637.1371 | Fe I | 636.2338 | |
| Fe I | 639.3601 | Fe I | 638.0743 | |||
| Fe I | 640.0001 | Fe I | 641.4980 | |||
| Fe I | 640.8018 | |||||
| Fe I | 641.1649 | |||||
| 4* | 636.85-641.35 | Si II | 637.1371 | Fe I | 638.0743 | |
| Fe I | 639.3601 | |||||
| Fe I | 640.0001 | |||||
| Fe I | 640.8018 | |||||
| Fe I | 641.1649 | |||||
| 5 | 641.50-646.03 | Ca I | 643.9075 | Ca I | 644.9808 | |
| Fe II | 645.6383 | |||||
| 6* | 642.60-651.00 | Ca I | 643.9075 | Ca I | 644.9808 | |
| Fe II | 645.6383 | V I | 647.1662 | |||
| Ca I | 646.2567 | Fe I | 649.4980 | |||
| 7 | 646.50-651.07 | V I | 647.1662 | |||
| Fe I | 649.4980 | |||||
| 8 | 650.50-662.96 | H | 656.2817 | Ti I | 662.5022 | |
| Fe I | 659.2914 | |||||
| 9 | 661.40-666.07 | Ti I | 662.5022 | |||
| Fe II | 663.3750 | |||||
| Si I | 664.3629 | |||||
| 10* | 664.00-669.69 | Fe I | 667.7987 | Si I | 664.3629 | |
| He I | 667.8151 | Fe I | 666.3442 | |||
| 11* | 665.50-670.20 | Fe I | 667.7987 | Fe I | 666.3442 | |
| He I | 667.8151 | |||||
| 12 | 667.00-671.11 | Fe I | 667.7987 | |||
| He I | 667.8151 | |||||
Notes: The asterisks in the first column shows if the corresponding spectral region was included in the joint 5-region solution.
KOREL was able to overcome problems with faint and blended lines of secondary star. Nevertheless, first solutions (in resolution 2048 bins) gave two mass ratio values with comparable accuracy; close to the result of SPEFO, CCF and result of Popper (1989) and close to solution in Lehmann et al. (2009). This ambiguity can be found in previously published values of , which differ from 0.28 (Pearce, 1937) or 0.37 (Plaskett, 1919; Holmberg, 193) to 0.465 (Popper, 1989) or 0.47 (Richards & Albright, 1994).
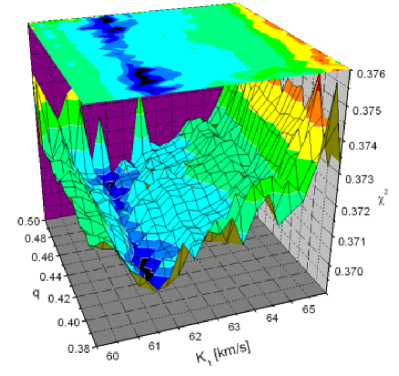
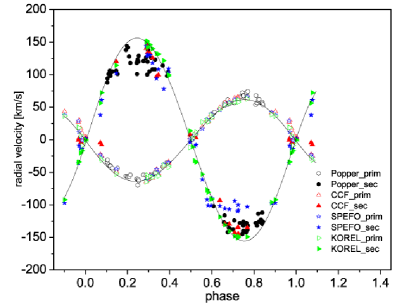
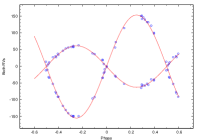
Using region No. 6 (see Tab. 3) we built a grid of solution in resolution 512 bins for input values of varying from 0.370 to 0.528 with a step 0.002 and semi-amplitude of primary star radial velocity in interval 61.0 – 66.8 km/s with a step 0.2 km/s. During each solution and parameters were fixed. We obtained 2400 solutions in total. Analogous calculations were repeated for resolutions 256, 512, 1024, 2048 (corresponding to the widths 15.3, 7.6, 3.8 and 1.9 km/s/bin) with smaller steps of input values: in 0.380 – 0.500, step 0.001; in 60.0 – 66.0, step 0.1. Thus we obtained 7381 solutions for each resolutions. The global minimum in the space of solutions was found around and thus found the final solution for all chosen spectral intervals (see Fig. 5). The resulting mass ratio is . The resulting values for the best solutions are summarised in Tab. 4. Note that disentangling cannot provide information on the systemic velocity. Its value can only be obtained by a direct measurement of disentangled line profiles. This way, we found that the systemic velocity of the system is about -2 km s-1. The final radial velocity curves could be compared with other ones in Fig. 6.
| Region | |||||
|---|---|---|---|---|---|
| 1 | 53558.9323 | 64.1 | 160.7 | 0.399 | 0.1996 |
| 2 | 53558.9342 | 62.7 | 155.4 | 0.403 | 0.1865 |
| 3 | 53558.9347 | 62.3 | 158.5 | 0.393 | 0.1771 |
| 4 | 53558.9335 | 63.1 | 160.6 | 0.393 | 0.1987 |
| 5 | 53558.9374 | 63.9 | 151.8 | 0.421 | 0.2212 |
| 6 | 53558.9239 | 62.6 | 154.7 | 0.405 | 0.2191 |
| 7 | 53558.9207 | 62.8 | 158.5 | 0.396 | 0.2009 |
| 9 | 53558.9157 | 63.5 | 156.1 | 0.407 | 0.1663 |
| 10 | 53558.9285 | 63.7 | 154.2 | 0.413 | 0.1747 |
| 11 | 53558.9212 | 63.3 | 157.1 | 0.403 | 0.1723 |
| 12 | 53558.9258 | 66.2 | 157.6 | 0.420 | 0.1555 |
| 5 regions | 53558.9219 | 62.7 | 153.7 | 0.408 | 0.2168 |
3.2 Initial analysis of RVs
We also compiled all RVs available in the astronomical literature and used the HEC19 program222This program which handles data of various forms, together with brief instructions on how to use it, is freely available on the anonymous ftp server at http://ftp.astro.troja.mff.cuni.cz:hec/HEC19 . to derive the heliocentric Julian dates (HJDs hereafter) for them. In particular, we used the early photographic radial velocities from the DAO (Plaskett, 1919), McDonald observatory (Smith, 1949) and Lick observatory obtained by Popper (1989). A journal of available spectral observations is in Table 5.
| Obs.∗ | Time interval | No. of | Source |
|---|---|---|---|
| (HJD2400000) | RVs. | ||
| 1 | 22062.9–22157.7 | 14 | Plaskett (1919) |
| 2 | 32342.6–32377.7 | 55 | Smith (1949) |
| 3 | 40290.0–45779.0 | 77 | Popper (1989) |
| 4 | 49077.8–49103.8 | 104 | Richards & Albright (1999) |
| 5 | 49108.7–49139.6 | 130 | Richards & Albright (1999) |
| 6 | 53335.4–53920.4 | 37 | this paper |
∗) In column “Obs.”, individual instruments are identified by numbers: 1… Dominion Astrophysical Observatory 1.83-m reflector, pg plates; 2…2-m McDonald telescope, McDonald observatory, Cassegrain spectrograph, pg plates; 3…3-m Shane telescope at the Lick observatory, pg plates; 4… 1.5 m National Solar Observatory (NSO) McMath-Pierce Main Telescope at Kitt Peak, echelle CCD spg.; 5… 0.9 m Coudé Feed Telescope at Kitt Peak National Observatory (KPNO), CCD spg.; 6… Ondřejov 2-m telescope, coudé CCD spg.
All trial solutions of the RV were derived with the FOTEL program (Hadrava, 1990, 2004a); for the results see Tab. 6.
| Ref. | [day] | (JD-2400000) | [km/s] | |
|---|---|---|---|---|
| 1 | 2.80654 | 22139.605(14) | 65.1(16) | |
| 2 | 2.806 | 32341.891(17) | 62.9(21) | |
| 3 | 2.80686656 | 42258.483(9) | 63.0(6) | 0.465(7) |
| 4 | 2.80686656 | 42258.501(8) | 63.3(6) | |
| 5 | 2.80683211 | 53558.916(12) | 60.9(10) | 0.474(18) |
| 6 | 2.80683211 | 53558.938(16) | 62.7(9) | 0.468(23) |
| 7 | 2.80683211 | 53558.938(8) | 62.6(12) | 0.441(13) |
| 8 | 2.80683211 | 53558.9219(15) | 62.7(6) | 0.405(3) |
4 B-component of visual binary ADS9706B
TW Draconis is A-component of visual binary O 299 = ADS 9706. The B-component is the star HD 140512=TYC 4184 61 2 9.987 mag (VT) only 3.3” far away from TW Dra. ADS9706B itself has been photometrically observed only rarely. The most accurate measurements were done by Hipparcos satellite, where A-component (TW Dra ) is mag and ADS9706B mag. Both components were measured together during our photometric measurements. To subtract the influence of B-component we obtained also three spectroscopic observations of this star. Two H region spectra of B-component from Ondřejov observatory and one echelle spectrum from Tautenburg (Mkrtichian & Lehmann, 2007) were obtained. Using equivalent width of chosen spectral lines and comparison to the synthetic spectra, the spectral type of ADS9706B as F5V-G0V was determined. Measured magnitudes were transformed into V magnitudes in Johnson system, according to Harmanec (1998). The result for G0V spectral type was closer to our observational data. Thus, this spectral type and consequent parameters were used to subtract ADS9706B influence from our TW Dra photometry.
Two-colours diagram was created using decomposed brightnesses of both components and colour indices of stars in the close vicinity of TW Dra (taken from the photometric database (Mermilliod et al., 2007)). Measured values were compared to theoretical models from Golay (1974); Cramer (1984). Considering this diagram, small distance of TW Dra pc (Perryman & ESA, 1997) and high galactic latitude (45°), interstellar extinction was omitted. According to Chambliss (1992), visual B-component could be a physical component of the system (along with TW Dra ). Using spectral type (G0V) of ADS9706B, distance 118 pc was obtained. This value is in agreement with the distance of TW Dra itself and thus supports Chambliss’s conclusion. Though first astrometric measurements of ADS9706 were done in 1843, there is no significant change of position angle or angular distance up to now.
5 Combined light-curve and orbital solution
For full-fledged modelling of all available data we used the code FOTEL (Hadrava, 2004a) and the PHOEBE program version 0.29c (Prša & Zwitter, 2005; Prša, 2006) with the WD back-end (Wilson & Devinney, 1971). To improve the of photometric data, we created 1000 normal points in BVRI colors; in U band we used all 136 original individual measurements. We excluded all observations from obtained with higher scatter in case of either a technical problem or bad weather. RVs for the final solutions were taken from the KOREL solution. We fitted the model to photometric and RV data simultaneously. The limb-darkening coefficients for the square-root law were interpolated from van Hamme (1993) tables.
5.1 FOTEL
Photometric measurements of TW Dra from Baglow (1952); Walter (1978); Papoušek et al. (1984) were resolved as well. It is necessary to consider third light in the system to improve to quality and accuracy of results. Presence of the third light is in agreement with previously published solutions.
Our own measurements were split into two datasets – photoelectric photometry from Hvar observatory transformed into the standard UBV magnitude and all (mainly CCD) observations in differential UBVRI magnitudes. Hvar measurements are approximately the same amount as Baglow’s ones, but unfortunately not covering secondary minimum. Thus, solution with the third light fixed was calculated in this case only. Initial light ephemeris is: =2.80683211 d, . The period , mass ratio and the eccentricity were fixed. Initial values of the other parameters () were adopted from Baglow (1952). Limb darkening coefficients were interpolated according to tables from van Hamme (1993).
The second, CCD datasets include normal light curves in BVRI bands, each of them with 1000 points. Hereafter only these normal CCD light curves were utilised, however initial parameters were the same as described above. Resulting parameters are given in the first column of Tab. 7. Solutions based on both datasets are in very good agreement.
5.2 PHOEBE
According to experience with our datasets in FOTEL we have proceeded solutions with non zero third light in PHOEBE only. First, radial velocities were used to improve initial values of parameters associated with spectroscopy with following results: semi-major axis R⊙, mass ratio , inclination , system velocity =-0.713(23) km s-1. The parameters were then fixed.
Input parameters were the same for both PHOEBE and FOTEL analysis, except above mentioned parameters. In contrast to FOTEL, temperatures of components were fitted in PHOEBE. Due to presence of third light it was impossible to use reliably either colour constraining method or the depth of minima for at least temperature ratio determination. Thus, temperature of primary star was estimated according to spectral type A5V K (Cox, 1999). Based on the range of possible spectral types of secondary component K2III, K0III, K2V (Popper, 1989; Yoon et al., 1994; Samus et al., 2009), corresponding temperature of secondary star is in the interval 4390–4830 K (Cox, 1999). Solutions for the mode 2 (detached systems) and mode 5 (algols) were proceeded and resulting parameters are listed in 2nd and 3rd columns of Tab. 7, showing similar results with only small differences. Thus the secondary component fills its Roche lobe or is only slightly below the Roche limit.
| band | FOTEL | PHOEBE | ||
|---|---|---|---|---|
| including | mode 2 | mode 5 | ||
| 3rd light | (detached) | (algols) | ||
| .91894(4) | .92013(25) | .91879(6) | ||
| 0.2166(5) | 0.2139 | 0.2106 | ||
| 0.2151 | 0.2127 | 0.2096(14) | ||
| 0.2180 | 0.2157 | 0.2124(17) | ||
| 0.2166 | 0.2142 | 0.2110(15) | ||
| 0.2153 | 0.2120(16) | |||
| 0.3144(3) | 0.3047 | 0.3030 | ||
| 0.2918 | 0.2839 | 0.2830 | ||
| 0.3529 | 0.4077 | |||
| 0.3077 | 0.2961 | 0.2950 | ||
| 0.3294 | 0.3277 | |||
| [∘] | 86.57(6) | 87.30(8) | 87.13(3) | |
| a [R⊙] | 12.084 | 12.0124* | 12.0124* | |
| [M⊙] | 2.14 | 2.112 | 2.112(53) | |
| [M⊙] | 0.87 | 0.850 | 0.850(21) | |
| 0.405 | 0.4026* | 0.4026* | ||
| -0.7116 | -0.713* | -0.713* | ||
| 5.095(11) | 5.166(15) | |||
| 2.679(1) | 2.680* | |||
| log | 3.940 | 3.960 | ||
| log | 3.240 | 3.240 | ||
| 8180* | 8180* | |||
| 4437(18) | 4407(23) | |||
| 1.260 | 1.260 | |||
| 3.120 | 3.160 | |||
| (O-C)2 | U | 0.0249 | 0.0185 | 0.0213 |
| B | 0.0140 | 0.0102 | 0.0099 | |
| V | 0.0149 | 0.0125 | 0.0124 | |
| R | 0.0138 | 0.0122 | 0.0109 | |
| I | 0.0117 | 0.0102 | 0.0107 | |
| (O-C)2 RV | 0.8284 | 1.7189 | 1.7181 | |
6 Conclusions
Using rich photometric material we found new linear ephemeris (in agreement with previous period study (Zejda et al., 2008)). Although this study was not aimed to detailed study of detailed photometric behaviour, we confirmed pulsation of one component in our data as well as in previous set od data from Papoušek et al. (1984). There are also small irregularities in light curves caused by spot activity on surfaces of components or in surrounding stellar matter.
Spectroscopic part concentrated on several tasks. Radial velocities were obtained from new spectra applying three methods (SPEFO, CCF, KOREL); radial velocity curves for both components were created and mass ratio of component was found with the value (KOREL, FOTEL) and (Phoebe solution), respectively. Using a disentangling technique a presence of interstellar material in the system presumably in a form of accretion disc was confirmed. Detailed study using set of old yet unprocessed spectra Richards & Albright (1999) as well as new huge collection of spectra from Tautenburg (Lehmann et al., 2008) could help to study the presence of circumstellar matter in the system and its evolution in time.
The first obtained spectra of visual component ADS9706B of TW Dra served for its spectral type determination (G0V). This result supports previously published hypothesis that ADS9706B is not only visual but even a physical member of the system (Chambliss, 1992). However, Zejda et al. (2008) found on the base on light time effect appeared in O-C residuals another component which is too faint to exert influence upon the light of two basic component and above mentioned third component (ADS9706B). Thus TW Dra itself is a basic binary in a quadruple system ((1+1)+1)+1. The spectral type G0V also allows to subtract the influence of ADS9706B from total light of visual pair ADS9706. Nevertheless new more precise spectroscopic and photometric measurements of B-component are highly desirable.
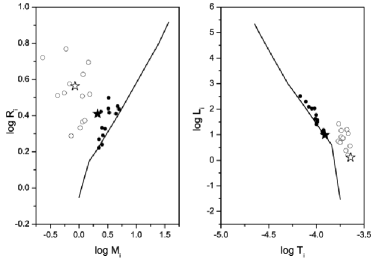
Radial velocity and light curve solutions were done in FOTEL using entire (historical and current) photometric and spectroscopic observations. New photometric and spectroscopic observations were processed in PHOEBE as well. The parameters from both FOTEL and PHOEBE are in very good agreement. TW Dra belongs to small numbers of semidetached eclipsing binaries with well known basic parameters. The nowadays primary components of these systems (e.g. KO Aql, S Cnc, RZ Cas, TV Cas, U CrB, AI Dra, S Equ, TZ Eri, AF Gem, TT Hya, BP Mus, AT Peg, HU Tau, TX UMa and others) obtaining material from the secondary present themselves like main sequence stars, while the the same age secondaries are bigger and more radiative. Obtained results of TW Dra correspond to other algols with known accurate parameters (see Fig. 8).
Acknowledgements.
We acknowledge the use of the programs FOTEL, KOREL, and PREKOR, made available by their author, Petr Hadrava, the use of HEC 19 made by Petr Harmanec and also use of PHOEBE made by Andrej Prša and his group. We appreciate the help and valuable notes of Petr Hadrava, Petr Harmanec and Volkan Bakiş. This research was supported from the grants GA ČR 205/04/2063, 205/06/0217, P209/10/0715 of the Czech Science Foundation, MEB050819, ME08038, MEB080832 Ministry of education, grant of Academy of Science GAAV IAA301630901, grant of Slovak VEGA 2/0074/09. We acknowledge the use of the electronic bibliography maintained by NASA/ADS system and by the CDS in Strasbourg.References
- Al-Naimiy & Al-Sikab (1984) Al-Naimiy, H. M. K. & Al-Sikab, A. O. 1984, Ap&SS, 103, 115
- Baglow (1952) Baglow, R. L. 1952, Publications of the David Dunlap Observatory, 2
- Chambliss (1992) Chambliss, C. R. 1992, PASP, 104, 663
- Cox (1999) Cox, A. N. 1999, Allen’s astrophysical quantities, ed. A. N. Cox
- Cramer (1984) Cramer, N. 1984, A&A, 132, 283
- Giuricin et al. (1980) Giuricin, G., Mardirossian, F., & Predolin, F. 1980, Ap&SS, 73, 389
- Golay (1974) Golay, M., ed. 1974, Astrophysics and Space Science Library, Vol. 41, Introduction to astronomical photometry, 79–80
- Hadrava (1990) Hadrava, P. 1990, Contributions of the Astronomical Observatory Skalnaté Pleso, 20, 23
- Hadrava (1997) Hadrava, P. 1997, A&AS, 122, 581
- Hadrava (2004a) Hadrava, P. 2004a, Publ. Astron. Inst. Acad. Sci. Czech Rep., 92, 1
- Hadrava (2004b) Hadrava, P. 2004b, Publ. Astron. Inst. Acad. Sci. Czech Rep., 92, 15
- Harmanec (1998) Harmanec, P. 1998, A&A, 335, 173
- Hilditch (2001) Hilditch, R. W. 2001, An Introduction to Close Binary Stars, ed. R. W. Hilditch
- Holmberg (193) Holmberg, E. 193, Meddelanden Lunds Astron. Observ., Ser. II, Band VIII, 71, 1
- Horn et al. (1996) Horn, J., Kubát, J., Harmanec, P., et al. 1996, A&A, 309, 521
- Kim et al. (2003) Kim, S.-L., Lee, J. W., Kwon, S.-G., et al. 2003, A&A, 405, 231
- Kusakin et al. (2001) Kusakin, A. V., Mkrtichian, D. E., & Gamarova, A. Y. 2001, Information Bulletin on Variable Stars, 5106, 1
- Lanz & Hubeny (2007) Lanz, T. & Hubeny, I. 2007, ApJS, 169, 83
- Lehmann et al. (2009) Lehmann, H., Tkachenko, A., & Mkrtichian, D. E. 2009, Communications in Asteroseismology, 159, 45
- Lehmann et al. (2008) Lehmann, H., Tkachenko, A., Tsymbal, V., & Mkrtichian, D. E. 2008, Communications in Asteroseismology, 157, 332
- Mermilliod et al. (2007) Mermilliod, J.-C., Hauck, B., & Mermilliod, M. 2007, http://obswww.unige.ch/gcpd/gcpd.html
- Mikulášek (2007) Mikulášek, Z. 2007, Astron and Astroph. Transact., 26, 63
- Mkrtichian & Lehmann (2007) Mkrtichian, D. E. & Lehmann, H. 2007, private communication
- Mkrtichian et al. (2008) Mkrtichian, D. E., Lehmann, H., Lee, B. C., & et al. 2008, in Proceed. of ”The 1st Thailand and Korea Joint Workshop on Stellar Astrophysics”, Chang Mai Univ. Press, Chang Mai, Thailand, 49
- Papoušek et al. (1984) Papoušek, J., Tremko, J., & Vestešník, M. 1984, Folia Fac. Sci. Nat. Univ. Purkynianae Brun., Phys., Tomus 25, Opus 4, 64 pp., 25
- Pearce (1937) Pearce, J. A. 1937, in Publications of the American Astronomical Society, Vol. 9, Publications of the American Astronomical Society, 131–+
- Perryman & ESA (1997) Perryman, M. A. C. & ESA, eds. 1997, ESA Special Publication, Vol. 1200, The HIPPARCOS and TYCHO catalogues. Astrometric and photometric star catalogues derived from the ESA HIPPARCOS Space Astrometry Mission
- Pickering (1910) Pickering, E. C. 1910, Harvard College Obs. Circ., 159, 3
- Plaskett (1919) Plaskett, J. S. 1919, Publications of the Dominion Astrophysical Observatory Victoria, 1, 137
- Popper (1989) Popper, D. M. 1989, ApJS, 71, 595
- Prša (2006) Prša, A. 2006
- Prša & Zwitter (2005) Prša, A. & Zwitter, T. 2005, ApJ, 628, 426
- Richards & Albright (1994) Richards, M. T. & Albright, G. E. 1994, in Interacting binary stars: a symposium San Diego State Univ.,13-15 July 1993., ed. A. Shafter, Vol. 56, 393
- Richards & Albright (1999) Richards, M. T. & Albright, G. E. 1999, ApJS, 123, 537
- Samus et al. (2009) Samus, N. N., Durlevich, O. V., & et al. 2009, VizieR Online Data Catalog, 1, 2025
- Sbordone et al. (2004) Sbordone, L., Bonifacio, P., Castelli, F., & Kurucz, R. L. 2004, Memorie della Societa Astronomica Italiana Supplement, 5, 93
- Singh et al. (1995) Singh, K. P., Drake, S. A., & White, N. E. 1995, ApJ, 445, 840
- Škoda (1996) Škoda, P. 1996, in ASP Conf. Ser. 101: Astronomical Data Analysis Software and Systems V, 187–189
- Smith (1949) Smith, B. 1949, ApJ, 110, 63
- Umana et al. (1991) Umana, G., Catalano, S., & Rodono, M. 1991, A&A, 249, 217
- van Hamme (1993) van Hamme, W. 1993, AJ, 106, 2096
- Walter (1978) Walter, K. 1978, A&AS, 32, 57
- White & Marshall (1983) White, N. E. & Marshall, F. E. 1983, ApJ, 268, L117
- Wilson & Devinney (1971) Wilson, R. E. & Devinney, E. J. 1971, ApJ, 166, 605
- Yoon et al. (1994) Yoon, T. S., Honeycutt, R. K., Kaitchuck, R. H., & Schlegel, E. M. 1994, PASP, 106, 239
- Zejda (2008) Zejda, M. 2008, Analysis of eclipsing binary light curves: PhD Thesis
- Zejda et al. (2008) Zejda, M., Mikulášek, Z., & Wolf, M. 2008, A&A, 489, 321
- Zejda et al. (2006) Zejda, M., Mikulášek, Z., Wolf, M., & Pejcha, O. 2006, Ap&SS, 304, 159
- Zverko et al. (2007) Zverko, J., Žižňovský, J., Mikulášek, Z., & Iliev, I. K. 2007, Contributions of the Astronomical Observatory Skalnate Pleso, 37, 49