Abstract
Plasma with a temperature close to the chromospheric one is
ejected in solar eruptions. Such plasma can occult some part of
emission of compact sources in active regions as well as quiet
solar areas. Absorption phenomena can be observed in the microwave
range as the so-called “negative bursts” and also in the He II
304 Å line. The paper considers three eruptive events
associated with rather powerful flares. Parameters of absorbing
material of an eruption are estimated from multi-frequency records
of a “negative burst” in one event. “Destruction” of an
eruptive filament and its dispersion like a cloud over a huge area
observed as a giant depression of the 304 Å line emission has
been revealed in a few events. One such event out of three ones
known to us is considered in this paper. Another event is a
possibility.
PACS numbers: 96.60.qf
Solar flare-related eruptions followed by long-lasting occultation of the emission in the He II 304 Å line and in microwaves
V. V. Grechnev1, I. V. Kuzmenko2, I. M. Chertok3, A. M. Uralov1
1Institute of Solar-Terrestrial Physics SB RAS, Irkutsk, email: grechnev@iszf.irk.ru
2Ussuriysk Astrophysical Observatory, Primorsky Krai, Ussuriysk, email: kuzmenko_irina@mail.ru
1Pushkov Institute of Terrestrial Magnetism, Ionosphere and Radio Wave Propagation (IZMIRAN), Troitsk, Moscow Region, email: ichertok@izmiran.ru
1 Introduction
Prominences (filaments) in many solar events erupt and draw away from the Sun as parts of Coronal Mass Ejections (CMEs). Partial plasma flows from an eruptive prominence along its legs down to the solar surface are often observed. “Failed” eruptions are also known, when an eruptive prominence or filament after lift-off rapidly decelerates and falls at nearly the same position where it was located before the eruption [1]. Observations of the 18.11.2003 eruptive event with the CORONAS-F/SPIRIT telescope in the He II 304 Å line revealed one more scenario. An eruptive filament disintegrated to form a Y-like cloud, flew above the solar surface a distance of more than the solar radius and, probably, landed far from the eruption site [2, 3]. A similar anomalous eruption was observed in the 13.07.2004 event [4]. Detailed observations of this event revealed an eruption from an active region of a compact filament and its subsequent dispersion over a huge area comparable with a quarter of the visible solar disk. These events were accompanied with impulsive flares.
Eruptive events associated with flares produce various phenomena of different temporal and spatial scales. These phenomena are observed in diverse spectral domains (see [5]). These are flare arcades whose emission is registered from X-rays up to radio waves. Other phenomena are dimmings, i.e., depressions of soft X-ray and extreme ultraviolet (EUV) emissions that reach significant sizes and exist from a few hours up to two days. The major cause of quasi-stationary dimmings is plasma density decrease due to expansion of eruptive structures. Shock waves excited by impulsive eruptions from active regions are manifest in Moreton waves and some “EUV waves” (or “EIT waves”). Propagation of shock waves is traced from slowly drifting type II bursts at metric and decimetric waves. Most likely, shock waves form leading edges of fast CMEs, especially decelerating ones [6].
Erupted plasmas with nearly chromospheric temperatures can occult some part of the solar emission and absorb its detectable fraction. Absorption phenomena are observed in various emission ranges. Erupted plasmas show up in the H line mainly as surges, which are usually not large in size. In rare cases moving clots can be detected far from an eruption site [4]. Observations of eruptions in the H line are limited by the Doppler shift, which displaces them from the filter band even if the line-of-sight velocities are rather low. Other causes also rapidly decrease the optical thickness of eruptions in the course of their expansion. Absorption phenomena are also manifest in radio emission as the so-called “negative bursts”, i.e., a temporary decrease of the total radio flux below the quasi-stationary level observed beyond bursts [7]. The optical thickness of eruptions in microwaves is proportional to the wavelength squared. Unlike the H line, both static and eruptive filaments can be optically thick practically in the whole microwave range, and they cause appreciable depressions of the emission.
Absorption of the background solar emission due to photo-ionization occurs also in the EUV range. Filaments are sometimes observed as dark features in coronal emission EUV lines Fe IX-X 171 Å and Fe XII 195 Å (often with a sheath brightened during eruption), while dense parts of eruptive filaments can appear as low-contrast moving fragmentary dimmings. Absorption can be especially significant in the He II 304 Å line, because the cross section of photo-ionization by such an emission of hydrogen-helium plasma with a nearly chromospheric temperature is by an order of magnitude higher than that for the 195 Å line. In addition, resonance scattering is possible in the He II 304 Å line by plasma with a temperature of a few K typical of the transition region (both between the corona and chromosphere and between the corona and a prominence). The temperature sensitivity maximum of the 304 Å channel is 80 000 K. Due to these properties, material of an eruptive filament, whose temperature range can be sufficiently wide, might have either increased or reduced brightness in this line. Finally, erupted plasma can be also observed in the He I 10830 Å line, which responds to both chromospheric and coronal phenomena. These circumstances show that phenomena of long-lasting occultation of the background solar emission can be observed in the He II 304 Å line and in radio emission in a range of 1 – 10 GHz [8].
The paper [8] analyzed eruptive events, for which records of negative bursts at a number of frequencies were available. Model estimations of temperatures, masses, and sizes of absorbers from these data confirmed that the absorber in all the cases was, most likely, material of eruptive filaments. The present study addresses eruptive events followed by extended darkenings in the SOHO/EIT 304 Å channel and negative microwave bursts. In Section 2 we analyze observations of the events in various spectral ranges. In Section 3 we estimate parameters of absorbing material for one of the events. Sections 4 and 5 discuss and summarize the results.
2 Analysis of Observations
For analysis of EUV observations we used images produced with the EIT telescope [9] on SOHO in the channels of 195 Å (typical imaging interval of 12 min) and 171, 284, and 304 Å (usually 6 hours). Source data FITS files were taken from the EIT catalog111http://umbra.nascom.nasa.gov/eit/eit-catalog.html. We used total radio flux records made with Nobeyama Radio Polarimeters222ftp://solar.nro.nao.ac.jp/pub/norp/xdr/, RT-2 radio telescope of the Ussuriysk Observatory333http://www.uafo.ru/observ_rus.php, and Learmonth station of the USAF RSTN Radio Solar Telescope Network444ftp://ftp.ngdc.noaa.gov/STP/SOLAR_DATA/SOLAR_RADIO/RSTN_1sec/. Data about CMEs were taken from the SOHO LASCO CME Catalog555http://cdaw.gsfc.nasa.gov/CME_list/; [10]. Consolidated data on solar events were taken from the Solar-Geophysical Data666http://sgd.ngdc.noaa.gov/sgd/jsp/solarindex.jsp.
2.1 Event 1: 29.04.1998
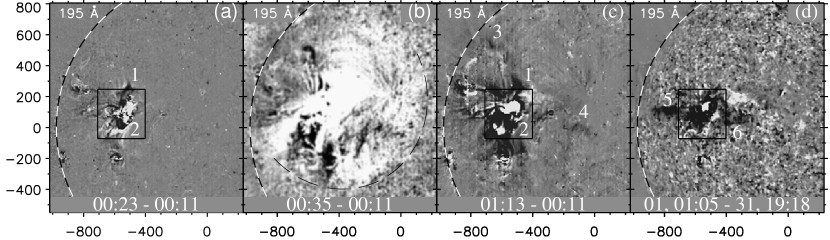
This event associated with a 3B/M6.8 flare (peak at 16:37, all times hereafter are UT) occurred in active region NOAA 8210 (S16 E22, -configuration). Various aspects of this events were addressed in a few papers [11, 12, 13]. Observations in the H line in the Big Bear Solar Observatory (BBSO) [11] and in the H and He I777see a movie at http://mlso.hao.ucar.edu/cgi-bin/mlso_datasum.cgi?1998&4&29&ACOS lines in the Mauna Loa Solar Observatory (MLSO) suggest that a few sequential eruptions of different filaments or their parts occurred in the event. The difference EIT 195 Å and 304 Å images in Fig. 1a – d show development of disturbances caused by the eruptions. In all the images, the solar rotation was compensated, and for each of the 195 Å and 304 Å channels, an image observed before the onset of the event was subtracted (the processing technique is described in [14]). First eruptions probably produced, at least, two shock waves following each other that were manifest in type II bursts and as EUV waves. The first EUV wave propagated in the northeastern direction (Fig. 1a), and the second one ran northwest (Fig. 1b). Material erupted at the onset of the event was visible in the H line at 16:32 – 16:46 to move in the NNE direction across the equator. The brightest CME appeared above the northeastern part of the limb at 16:58. The fast halo CME (average plane-of-sky speed of 1374 km/s) significantly decelerated. Starting from 17:25 on, an opposite part of the coronal transient was observed above the southwest limb that was probably associated with a shock wave.
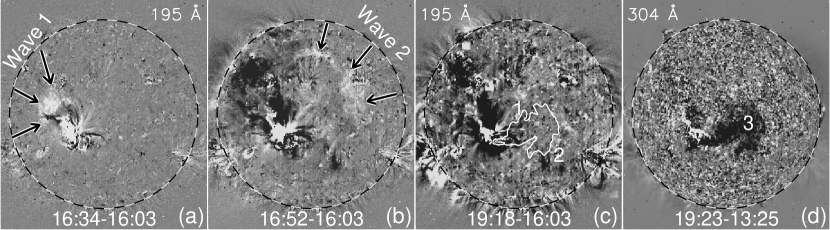
Large-scale quasi-stationary dimmings were registered in the 195 Å channel (Fig. 1b,c). Three deepest dimmings were almost invariable during 2 to 3 hours after the eruption. One of them was located north from the eruption region, the second one adjoined it from the south, and the third one was located close to the northeastern part of the limb. Differences between dimmings visible in the 171, 195, and 284 Å lines were not conspicuous. However, a single image observed during 6 hours in the 304 Å channel at 19:23 shows an extensive darkening west from the eruption region without counterparts in the coronal channels (Fig. 1d). Its area at a 25% decrease of the brightness reached 6.5% of the solar disk, and the maximum depth was (the brightness drop to 15% of an initial level).
A number of observational facts indicates that darkening 3 was due to occultation of the solar emission by erupted material. The 195 Å images in an interval of 18:07 – 18:53 show a motion of a long darkening 1 (Fig. 1c) towards the extensive darkening 3. Changes are also visible related to a southwest motion from the eruption region, towards darkening 2 (cf. Fig. 1b and 1c). A slow motion (less than 100 km/s) in the projection on the solar disk in the NWW direction is detectable in the H and He I lines after 16:52. This motion can be detected in the He I images up to 20:00 at a distance from the eruption site almost equal to the solar radius in the plane of the sky.
A “negative” burst was observed in microwaves after an impulsive burst. Fig. 2 presents a record made in the Pentincton observatory at a frequency of 2.8 GHz [in solar flux units, 1 s.f.u. = W/(m2 Hz)]. The record of the burst was interrupted by calibrations, which take a significant part of the observational daytime in this observatory (calibration records were rejected in the figure to reveal the negative burst). A decrease of the total radio flux relative to the quasi-stationary level started by 16:56, lasted about one hour, and reached of the pre-burst level at the maximum absorption (17:00 – 17:20). A negative radio burst as long as 53 min with a deepest depression at 16:40 was also recorded at 6.7 GHz in the Cuba observatory (Solar-Geophysical Data). A negative burst in a range of 0.4 – 2.7 GHz is also surmised in multi-frequency records of the Sagamore Hill and Palehua observatories, but low quality of these records does not allow us to quantitatively analyze them in order to estimate parameters of an absorbing “screen”. Nevertheless, by taking account of data from different emission ranges it is clear that the decrease of the total radio flux was caused not only by possible occultation of microwave sources in an active region, but also by screening of large quiet Sun’s regions. No alternative to the eruption is seen for the role of the screen.

These observational facts show that one or more filament eruptions in the 29.04.1998 event were followed by disintegration of the filament’s magnetic structure and dispersing fragments over significant area above the solar surface. They occulted the background solar emission that caused the negative burst and the long-lasting large-scale darkening visible in the 304 Å channel without pronounced analogs in coronal lines (although faint manifestations of absorption were detectable in this region in the 195 Å images). We do not exclude that the screens responsible for the negative burst and the darkening in the 304 Å channel were formed by different anomalous eruptions. Obviously, an increase of the microwave flux associated with a small radio burst, which started at 17:50, must terminate the depression of the total radio flux that might be longer if this burst would not occur. However, the longer existence of the darkening in the 304 Å line with respect to the negative burst (longer than 1.5 – 2 hours in this event) appears to be usual (see Section 4).
2.2 Event 2: 27/28.05.2003
Two eruptive events associated with big flares occurred in active region NOAA 10365 (S07 W17, -configuration) with an interval of about 90 min. The first event was associated with a 2B/X1.3 flare (peak at 23:07 on 27 May), and the second one was associated with a 1B/X3.6 flare (peak at 00:27 on 28 May). Both events were observed in the H line in BBSO888http://bbso.njit.edu/ and in the H and He I lines in MLSO999see a movie at http://mlso.hao.ucar.edu/cgi-bin/mlso_datasum.cgi?2003&5&27&ACOS. The H images suggest that Moreton waves were possible in both events. Also, type II bursts were registered in each event. These circumstances indicate excitation of shock waves in both events that is consistent with a fact that the first halo CME decelerated (average speed of 964 km/s). The SOHO/EIT telescope observed at that time in the 304 Å channel with a 12-min interval, and images in all four channels were produced four times per day as usually.
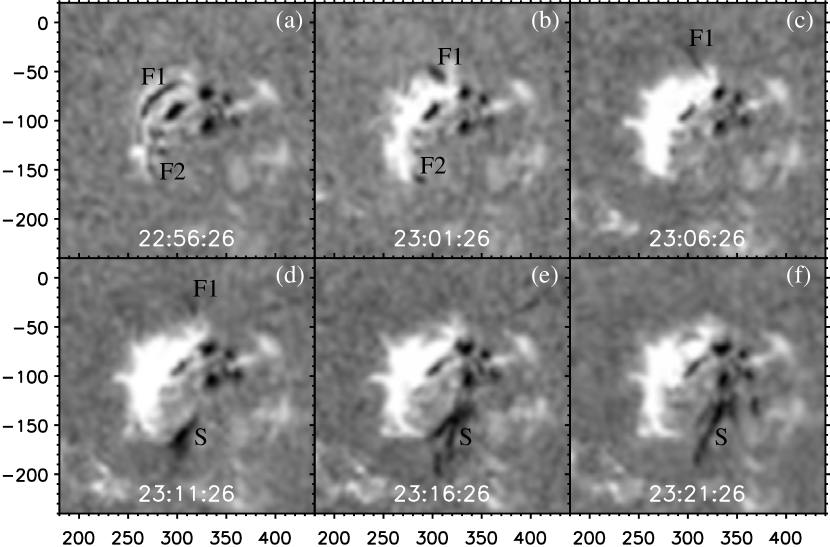
Absorption phenomena were observed after the first event. The BBSO H images in Fig. 3 show that filament F1 located in the northeastern part of the active region started to erupt at about 23:00, and the southwards filament F2 disappeared (Fig. 3b). The double eruption is confirmed by the appearance of flare ribbons at the previous locations of both filaments. A jet-like northern end of the straightened filament F1 can be traced up to 23:11. A dark returning surge appeared at that time in the southern part of the active region presumably due to downflow of cool gas from an expanding loop-like filament. This filament could be the F2 filament, but most likely this was a combined F1+F2 filament, which formed during the eruption (see [15, 16]) .
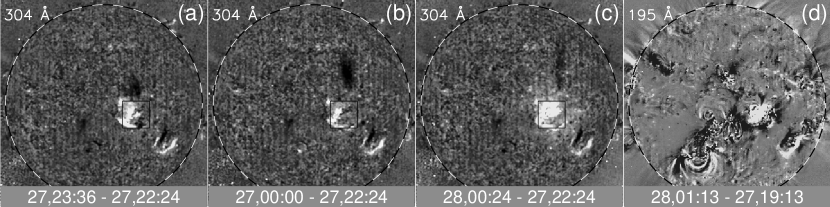
Five He II 304 Å images show an eruption, which looked like a dark shadow moving in the NNW direction (Fig. 4a – c), and appeared to be a geometric extension of the straightened northern end of the eruptive filament F1. The area of the “shadow” at a 25% level of the brightness decrease was about 1% of the solar disk area, and the depression depth reached . The eruption was well visible also in the He I 10830 Å line. Dimmings observed somewhat later in the coronal channels significantly differed in positions, shapes, and sizes from the moving 304 Å darkening (Fig. 4). Thus, the northern darkening in this event appears to have been a result of absorption of the background solar emission in a dense part of a loop-like filament, which expanded up to a huge size.
A halo, which appeared in SOHO/LASCO/C2 images at 23:50 or still earlier, at 23:26, was presumably a result of impact of a shock wave on coronal ray structures. Magnetoplasma structures appeared in later images, but it is difficult to understand whether they were ejected in the first event or in the second one. It is possible that eruptive structures in both events continuously expanded by keeping their integrity.
The flares in both events were accompanied by powerful microwave bursts. Fig. 5a presents time profiles of the first burst and the onset of the second one recorded with Nobeyama Radio Polarimeters. To reveal a commenced negative burst, the initial levels were subtracted, and fluxes were limited at a level of 20 s.f.u. The decay of the first burst was followed by a continuing flux decrease below the initial level, and then the decrease was interrupted by the onset of the second burst. The commenced depression is well pronounced, but it is not possible to estimate parameters of the eruption from absorption of radio emission.


2.3 Event 3: 01.01.2005
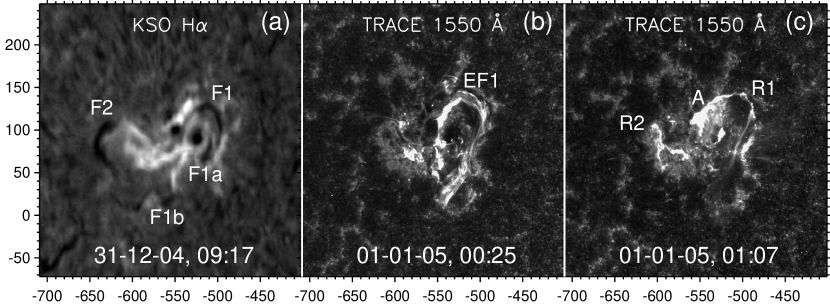
This event in active region NOAA 10715 (N04 E20, -configuration) was associated with an X-ray flare of an X1.7 importance (peak at 00:31) preceded by a weaker C1.6 flare at 00:13 in the same region. A type II radio burst and decelerating CME (average speed of 832 km/s) were associated with the major event. No core was visible in the CME structure. No H patrol was carried out at that time, neither we found observations of an eruption in this event. TRACE observed the first event (C1.6) in UV channels and recorded jets in this active region. The TRACE observations had a break from 00:26 till 01:06, when the major event associated with the X1.7 flare occurred. The situation before the event and after it is shown in Fig. 6. An H image (Kanzelhöhe Observatory) in Fig. 6a was obtained 15 hours before the event. In the active region there were filament F1 near the eastern sunspot and one more filament F1a southward. A southeast segment F1b was possibly located in the same filament channel. The TRACE images observed in the C IV 1550 Å line (the temperature sensitivity range of K) show the situation after the C1.6 flare (Fig. 6b) as well as after the X1.7 flare (Fig. 6c). Fig. 6b presents the onset of eruption of the F1 filament (EF1), which might have combined with the F1a and F1b filaments before the eruption or at its onset. Fig. 6c shows the decay phase of the X1.7 flare. A compact arcade A intruded into the eastern spot, and an extension of the arcade northeast and then south, R1, was a flare ribbon arranged along the former position of the F1 filament. A brightening was visible in the western spot, too. Ribbons R2 were observed in the eastern part of the active region, where the F2 filament presumably could intervene after the observations in Kanzelhöhe.
Difference solar images observed in the EIT 195 Å channel in Fig. 7a – c show the appearance and development of quasi-stationary dimmings 1, 2 and an “EIT wave” front outlined with the thin dashed arc in Fig. 7b from the west and south. A low brightness threshold was applied to reveal the wave front, therefore the inner part of the image is excessively bright due to the flare emission and stray light. The wave was also observed in GOES12/SXI images in an interval of 00:32 – 00:37. A plane-of-sky wave speed estimated from these images in the southern direction was about 600 km/s. Short-lived moving darkenings, e.g., 3 and 4, were also visible in the 195 Å channel (Fig. 7c).
The 5 – 6 darkening in the 304 Å channel (Fig. 7d) strongly differs in the position and shape from the major coronal dimmings 1 and 2 visible in the 195 Å channel. The area of the 5 – 6 darkening at a level of 25% brightness decrease was about 3% of the solar disk area, and a deepest depression reached . Like events 1 and 2, the most probable cause of the darkening in the 304 Å channel was absorption of the background solar emission in cool material ejected in eruption of filament F1 and probably F2. Significantly weaker manifestations of absorption are also detectable in the 195 Å channel that is consistent with the difference of the absorption cross sections in these lines of an order of magnitude.
The darkening observed in the 304 Å channel half an hour after the eruption was much larger than filaments F1 and F2 before eruption were. A CME at that time appeared in the LASCO/C2 field of view, i.e., its distance from the eruption site exceeded the solar radius. Occultation of the solar emission by an expanding CME core was not excluded in the 27/28.05.2003 event, but it is difficult to imagine such a situation for the 5 – 6 darkening here. Like the 13.07.2004 event [4], the CME in the 01.01.2005 event did not have a pronounced bright core, which is usually identified with material of an eruptive filament. This fact also agrees with an assumption that the main part of the filament in the 01.01.2005 event was not ejected high into the corona as a part of the CME, but returned to the solar surface. Probably, a transformation of the CME magnetic structure occurred during the eruption, and the main part of filament material had not joined the CME.
A strong impulsive burst was observed in microwaves with a maximum flux density of about 5000 s.f.u. at frequencies of 10 – 17 GHz. Following its decay, a negative burst occurred starting from 00:51 – 01:02 and up to 01:50 – 02:10. Fig. 5b shows total flux time profiles of radio emission recorded at a number of frequencies in observatories of Nobeyama (1, 2, 3.75 GHz), Ussuriysk (2.8 GHz), and Learmonth (1.4, 2.7, 4.9, and 8.8 GHz). Pre-burst flux levels were subtracted, and the records were smoothed over 30 s and normalized to the quiet Sun’s level. The duration and depth of the negative burst increased towards lower frequencies. The maximum depth of was observed at 01:06 at a frequency of 2 GHz.
3 Estimation of parameters of absorbing material
Possible causes of negative radio bursts have been addressed in [17]. Occultation of emission from a compact source located in an active region by material of an eruptive filament has been considered to be the major cause. The events which we discussed as well as those analyzed in papers [4, 8] show that absorption of emission from compact sources is not the only factor. Absorption of emission from significant areas of the quiet Sun can also provide an important contribution. A dependence of absorption on parameters of a screen and observing radio frequency provides an opportunity to estimate these parameters from radio data recorded at a number of frequencies. A model proposed in [4, 8] allows one to calculate a spectrum of the total solar radio flux by considering contributions of a few layers. These are the chromosphere, a screen (material of an eruptive filament) of a given area located at a given height above the chromosphere, and coronal layers both between the chromosphere and the screen, and between the screen and an observer. By comparing an observed frequency distribution of the depths of a negative burst with results of modeling, it is possible to estimate the kinetic temperature of the screen, its optical thickness at each frequency, its area, and its height above the chromosphere.
Multi-frequency records of a negative burst with a quality sufficient to estimate parameters of an eruption are available for event 3 (01.01.2005). Absorption depths at different frequencies measured from data shown in Fig. 5b for the instant of the maximum depth and re-normalized to the sum of total radio fluxes from the Sun and an occulted compact radio source are shown in Fig. 8 with asterisks, and a modeled spectrum is shown with the line. The depth of the negative burst at 1 GHz could be reduced because of commencement of a type III burst that explains the difference between the model and observations at this frequency. The best fit of the observations is achieved with the following parameters of an occulting screen: the optical thickness at 2.8 GHz of 2.6, the kinetic temperature of 14000 K, the effective height of the screen above the chromosphere of 50 Mm, and the area of the screen about 5% of the solar disk area.

It is possible to estimate an average electron number density and mass of absorbing material by means of the following expressions
with being the radio frequency, the kinetic temperature, and the area and geometrical depth of the screen, and being the proton mass. The ionization degree is assumed to be about 100%. The observations which we have considered do not permit us to estimate the geometrical depth of the screen. From an observed ratio of sizes of the 304 Å darkening and assuming the geometrical depth of the absorbing screen to be close to its width, we get Mm, the average electron number density cm-3, and g, which is comparable with masses of a typical filament and an ordinary CME. The estimate of the mass is a highest one, but it nevertheless appears to be close to a real value, because the dependence of the mass on the geometrical depth is rather weak, .
The negative burst in event 1 (29.04.1998) was recorded with a high quality at a single frequency of 2.8 GHz. By assuming the temperature of the absorbing material of order 10000 K, and the area of the occulting screen to be equal to the area of the darkening observed at 304 Å (6.5%), the model allows us to estimate the optical depth of the screen to be . With a maximum geometrical thickness of the screen Mm, the average electron number density cm-3, and the mass g that is of the same order as masses estimated for a few events from multi-frequency radio data [8].
4 Discussion
The three events considered in our paper as well as five events analyzed previously in papers [4, 8] show that the most probable cause of depressions of radio emission observed as “negative bursts” was absorption of background solar emission in low-temperature plasmas of eruptive filaments. This conclusion is in accordance with estimated temperatures of occulting screens of K and their masses of g, close to values typical of filaments. Just this interpretation of “negative bursts” was initially proposed by Covington [7] and confirmed in most later studies [17]. An essential result of the analysis carried out in studies [4, 8] as well as in the present paper is the conclusion about very large areas of occulting screens, from 2% to 15% of the visible solar disk. It turns out that not only occultation of compact sources in active regions is important, but also occultation of large quiet Sun’s areas. Huge sizes of occulting screens are in agreement with a maximum thickness of about 200 Mm estimated from observations of one of such events [4] as well as heights of their lower edges of 20 – 80 Mm above the chromosphere estimated by means of the model.
In order to produce an appreciable depression of radio emission, an eruptive filament must have a sufficient contrast against the background of the quiet Sun with a brightness temperature of , while the corona must be optically thin. These conditions are mainly satisfied within a frequency range from 1 GHz ( K) to 10 GHz ( K), in which negative bursts in mentioned studies have been actually registered. Observations of negative bursts beyond this frequency range appear to be possible in some cases. However, with the estimated temperatures of screens of K, frequencies below 5 GHz ( K) are favorable. Indeed, depressions in all eight cases were deepest at frequencies of 2 – 4 GHz, and the fact that Covington discovered negative bursts in observations at a traditional wave of 10.7 cm (2.8 GHz) does not seem to be surprising.
As noticed in Introduction, the He II 304 Å line of the EUV range is another spectral domain, which favors detection of large-scale ejections of low-temperature plasmas of eruptive filaments due to absorption. This is due to a high cross section of photo-ionization by this emission and the existence of an additional mechanism, resonance scattering of emission by plasmas with temperatures of a few K. For these reasons, depressions caused by absorption of the He II 304 Å line emission are not visible or scarcely detectable in coronal emission lines, unlike deep dimmings caused by plasma density decrease due to a CME expansion. It is therefore clear that observations of such darkenings in the He II 304 Å line correlate with negative radio bursts. Note that the depressions observed in the He II 304 Å line in the considered events 1 – 3 were significantly deeper than the 50%-level expected for resonance scattering (see [4]) that confirms predominance of low temperatures in occulting screens.
However, significant differences exist between absorption properties in the microwave range, on the one hand, and in the He II 304 Å line, on the other hand. The major difference is determined by dissimilar density dependence of the optical thickness of an absorbing screen. The microwave optical thickness, , rapidly decreases in omnidirectional expansion of a screen, if the number of particles responsible for absorption remains constant in the screen. The situation is different when dealing with absorption in the He II line. By neglecting temperature effects and other ones, on can consider in the first approximation the optical thickness to depend on the first power of density, , and the role of the expansion factor is significantly weaker. Even if a screen expands dissimilarly in different directions, the density decrease factor dominates in the radio range.
The second distinction is due to differences between layers responsible for emissions registered in the 304 Å channel, on the one hand, and in microwaves, on the other hand. The background solar emission in the 304 Å line is most likely dominated by contribution from the transition region, i.e., at very low altitudes ( Mm). The contribution from coronal layers is presumably dominated by the Si XI line emission. It does not seem to be significant in quiet regions. The situation is different in the radio range. The quiet Sun’s brightness temperature observed from the Earth consists of two components, the chromospheric emission ( K) and the coronal one. Unlike the 304 Å channel, the corona contribution in microwaves exceeds the chromospheric one at frequencies below 4.4 GHz. This contribution gradually increases with a rise from the chromosphere upwards. Therefore, the height of an absorbing screen above the chromosphere is very important. For example, the presence at a large height of an opaque, dense (for simplicity) screen with a temperature of 14000 K decreases a low-frequency total radio flux and increases a high-frequency one. By contrast, a very low screen with the same parameters but the temperature of 10000 K would not manifest in radio emission at all. However, a darkening in the 304 Å channel is expected to be the same in both cases. One might expect for these reasons that a negative burst should typically terminate earlier than a darkening in the 304 Å channel disappears. The latter might be visible as long as an absorbing screen is located higher than the transition region.
Thus, phenomena of long-lasting screening of the background solar emission can be observed in the He II 304 Å line as well as in radio emission of the 1 – 10 GHz range (preferably below 5 GHz). However, SOHO/EIT supplies, as a rule, one 304 Å image in six hours, and therefore the probability to register such a phenomenon is low. STEREO and SDO space-borne observatories carry out observations in the 304 Å channels in more detail, but they operate during a prolonged minimum of the solar activity. Out of very few heliographs, the SSRT [18] is the only one, which routinely observes the Sun in the frequency range of interest during the whole light day. However, screening phenomena after flare-related eruptions have not been detected in its observations so far. Probably, this is due to both infrequent occurrence of such events and an insufficient sensitivity of this instrument that is required for their detection at its rather high frequency of 5.7 GHz ( K) in the presence of bright flare emissions. Total radio flux records persist to be the main source about such events, but their detection in such records is obviously preconditioned by a short duration of a preceding flare and the absence of bursts afterwards. For all of these reasons, information about such events is very limited.
The brightness decrease of solar disk portions below the quasi-stationary level in the discussed events was caused by absorption of a fraction of the solar emission in a cool screen. Plasmas of eruptive filaments (prominences) constitute such screens. Two scenarios of screening are possible. In the first case, the shape and magnetic structure of an eruptive filament do not undergo essential changes. Such a filament draws away from the solar surface almost without loss of its mass and looks like a moving screen, whose sizes increase, while the opacity decreases. Our event 2 (27/28.05.2003) is a possible example of such a scenario. This scenario is typical of non-flare-related filament eruptions outside of active regions. Many such events have been observed with SSRT and the Nobeyama Radioheliograph (frequencies of 17 and 34 GHz). In the second scenario, the whole mass of an eruptive filament or its considerable portion does not leave the Sun as a part of a CME, but is dispersed over a large area above the solar surface. This presumably occurred in event 1 (29.04.1998), and also in the 13.07.2004 event [4]. This scenario is not excluded also for event 3 (01.01.2005). Dispersion occurs along magnetic field lines, which probably were not connected with the filament before the eruption. Transposition of cool plasmas of the eruptive filament to the external field lines is possible in reconnection of magnetic fluxes of the internal field belonging to the filament and the external one. One may speak in this case about “destruction” of the magnetic structure of the eruptive filament. Afterwards, the ejecta does not resemble itself as it at the onset of the eruption was. An example is the 18.11.2003 event mentioned above [2, 3], in which an eruptive filament encountered an invisible obstacle and visually transformed into two wide diverging jets carrying material of the filament to remote sites on the solar surface.
It is a subject of a separate analysis how “destruction” of the magnetic structure of an eruptive filament occurs. Now we only indicate possible causes. The first one has been confirmed by observations. Its essence is a pass of an eruptive filament through a null point of the magnetic field in the corona (see, e.g., [19]). Indications at essentially three-dimensional nature of an occurring transformation of an eruptive filament into eruptive jet can be found in papers [20, 21]. Another reason of allied nature might be a pass of an eruptive filament across vicinities of a point, in which loci of neutral lines of the radial magnetic component bifurcate. Such a region can be revealed from the arrangement of neutral lines of the large-scale magnetic field calculated at different heights above the solar surface. A rising eruptive filament is known to successively reproduce in its motion contours of the same neutral line [22, 23, 24] changing with height. This lines breaks in a bifurcation point, and the filament has no chance to retain its integrity after passing through such a region. We found a similar bifurcation of the height distribution of neutral lines in the mentioned 18.11.2003 event, which will be analyzed in a separate paper.
An anomalous eruption with a “destruction” of the filament’s magnetic structure is favored by the appearance in real solar conditions of null points and bifurcation points on the way of a filament. This is more probable in a complex coronal magnetic configuration, inside which the eruption occurs. Outer manifestations of such a situation are complexity of a configuration observed on the photosphere (all the three considered events occurred in -configurations) and/or surrounding of the eruption region by other active regions (this was the case for events considered in [8]). These circumstances correspond to a conclusion of Sawyer ([17], item 4 in ‘Summary and Conclusions’) about a tendency of negative bursts to clustering in complexes of active regions. For the same reasons, an anomalous eruption of a quiescent filament beyond an activity complex is not expected. After eruptions occurring outside of active regions, one might expect occultation of the solar emission by an expanding filament, but its “destruction” is unlikely.
All the considered events were indeed associated with filament eruptions from active regions accompanied by pronouncedly impulsive flares. This is also supported by the appearance of coronal shock waves in the events. Observations suggest that excitation of a shock wave in the low corona is most probable by the impulsive-piston mechanism in an eruption of a magnetic flux rope structure [6]. Then the shock wave detaches from the piston, which excited it, runs ahead, and freely propagates afterwards like a blast wave. The front of such a wave has a shape close to a spheroid. Near-surface signatures of such shock waves can be Moreton waves and those “EIT waves”, which propagate far away from an eruption region. Signatures of shock waves propagating away from the solar surface are metric type II bursts and outer edges of coronal transients of a halo type. Kinematical correspondence of all of these manifestations has been shown in the same study [6] as well as a low probability of other discussed excitation mechanisms of shock wave excitation near the Sun.
Observations of all the three considered events have revealed type II radio bursts in the metric range, “EIT waves” propagating up to large distance from eruption regions, and indications of a Moreton wave in event 2. Sufficiently fast (average speeds km/s) halo coronal transients were associated with all the events, and all of them decelerated. An additional hint at a wave character of these transients is a significant difference between the expansion directions of their fastest parts and the major CME magnetoplasma structures. A trace of a spheroid front of a coronal shock wave is expected to be observed just in this manner.
5 Conclusion
We have demonstrated manifestations in different spectral ranges of eruptive events associated with powerful flares followed by long-lasting screening of the solar emission. Absorption of the background emission in material of an eruptive filament can be observed as a depression of the He II 304 Å line emission without pronounced counterparts in EUV emission lines. It can be also observed as a negative radio burst in the microwave range. Darkenings in images obtained in the He II 304 Å channel can be detectable well after the end of a corresponding negative radio burst. From high-quality multi-frequency microwave data by means of the model developed, it is possible to estimate parameters (including mass) of ejected material, whose projection is on the solar disk. Such estimates have confirmed that screening occurred by material of an eruptive filament and showed that, besides occultation of emission from compact sources in active regions, occultation of significant quiet Sun’s areas is significant.
A steadily expanding eruptive filament is known to be able to occult the solar emission during tens of minutes or even a few hours. Observations show that in some cases, which are presumably rare, an eruption scenario can be anomalous. That is, an eruptive filament encounters an unavoidable obstacle in a form of a peculiarity of the coronal magnetic configuration and disintegrates into parts or a cloud of fragments. In such a case, material of an eruptive filament does not join a CME, but instead is dispersed over a large area above the solar surface and eventually lands far from the eruption region. Being aware of only a few examples of such events, it is difficult to judge about their common properties. We can only present some conjectures.
An anomalous eruption is expected to be favored by complexities of a magnetic configuration, especially of the type, and surrounding of the active region with others. Such an eruption might be accompanied by a significantly power flare, surges, or sprays. Surges observed in the H line might sometimes present only the slowest and densest part of an eruption, whose real sizes can be significantly larger. In an anomalous eruption, appearance of a shock wave is highly probable, which can manifest in a metric type II burst, “EUV wave” propagating far from the eruption region, and a possible Moreton wave. The shock wave might be responsible for the leading edge of a coronal transient originating in such an event. The CME can be without a pronounced core. The outer CME edge might be either formed by a shock-driven plasma flow or constituted by coronal rays deflected by the wave. Such a coronal transient probably has a high speed and decelerates. A number of listed properties appears to be typical of many flare-related eruptions. If such an event is followed by a negative radio burst or a large darkening observed in the 304 Å channel that conspicuously mismatches dimmings visible in coronal lines, then an anomalous eruption might have occurred in this event.
The authors thank V. A. Slemzin for useful discussions and K. Tapping for data of the Pentincton Observatory. We are grateful to team members of the Nobeyama and Learmonth observatories for the opportunity to use their total flux radio data at different frequencies. We thank the SOHO consortium for data used in the analysis (SOHO is a project of international cooperation between ESA and NASA). We used data from the CME catalog generated and maintained at the CDAW Data Center by NASA and the Catholic University of America in cooperation with the Naval Research Laboratory. The research was supported by the Russian Foundation of Basic Research (grants 09–02–00115, 11–02–00038, and 11–02–00050), Integration Project of RAS SD No. 4, and the programs of basic researches of RAS “Plasma Heliophysics” and “Solar Activity and Physical Processes in the Sun – Earth System”.
References
- [1] B. P. Filippov, Eruptive processes on the Sun (Moscow, Fizmatlit, 2007), in Russian.
- [2] V. Slemzin, I. Chertok, V. Grechnev, et al.: 2004, In: Multi-Wavelength Investigations of Solar Activity, Proc. IAU Symp., ed. Stepanov A. V., Benevolenskaya E. E., Kosovichev A. G. 223, 533.
- [3] V. V. Grechnev, I. M. Chertok, V. A. Slemzin, et al., J. Geophys. Res. 110, A09S07 (2005).
- [4] V. V. Grechnev, A. M. Uralov, V. A. Slemzin, et al., Solar Phys. 253, 263 (2008).
- [5] H. S. Hudson, J.-L. Bougeret, J. Burkepile, Space Sci. Rev. 123, 13 (2006).
- [6] V. V. Grechnev, A. M. Uralov, I. M. Chertok, et al., Solar Phys. 2010, Submitted.
- [7] A. E. Covington, H. W. Dodson, Roy. Astron. Soc. 47, 207 (1953).
- [8] I. V. Kuz’menko, V. V. Grechnev, A. M. Uralov, Astron. Rep., 53, 1039 (2009)
- [9] J. P. Delaboudinière, G. E. Artzner, J. Brunaud, et al., Solar Phys. 162, 291 (1995).
- [10] S. Yashiro, N. Gopalswamy, G. Michalek, et al., J. Geophys. Res. 109, A07105 (2004).
- [11] H. Wang, Ph. R. Goode, C. Denker, et al., Astrophys. J. 536, 971 (2000).
- [12] I. M. Chertok, V. V. Grechnev, Astron. Rep. 47, 934 (2003).
- [13] I. Chertok, V. Grechnev, 2005. In Coronal and Stellar Mass Ejections. Proc. IAU Symp., ed. K. P. Dere, J. Wang and Y. Yan, 2005. 226, 167 (2005).
- [14] I. M. Chertok, V. V. Grechnev, Solar Phys. 229, 95 (2005).
- [15] A. M. Uralov, S. V. Lesovoi, V. G. Zandanov, V. V. Grechnev, Solar Phys. 208, 69 (2002).
- [16] V. V. Grechnev, A. M. Uralov, V. G. Zandanov, et al., Publications of the Astronomical Society of Japan 58, 69 (2006).
- [17] C. Sawyer, Solar Phys. 51, 203 (1977).
- [18] V. V. Grechnev, S. V. Lesovoi, G. Ya. Smolkov, et al., Solar Phys. 216, 239 (2003).
- [19] G. A. Gary, R. L. Moore, Astrophys. J. 611, 545 (2004).
- [20] N. S. Meshalkina, A. M. Uralov, V. V. Grechnev, et al., Publications of the Astronomical Society of Japan 61, 791 (2009).
- [21] B. Filippov, L. Golub, S. Koutchmy, Solar Phys. 254, 259 (2009).
- [22] B. P. Filippov, N. Gopalswamy, A. V. Lozhechkin, Solar Phys. 203, 119 (2001).
- [23] B. P. Filippov, N. Gopalswamy, A. V. Lozhechkin, Astron. Rep. 46, 417 (2002).
- [24] B. Filippov, S. Koutchmy, Ann. Geophys. 26, 3025 (2008).