Observing with HST below 1150Å: Extending the Cosmic Origins Spectrograph Coverage to 900Å
Abstract
The far-ultraviolet (FUV) channel of the Cosmic Origins Spectrograph (COS) is designed to operate between 1130Å and 1850Å, limited at shorter wavelengths by the reflectivity of the MgF2 protected aluminum reflective surfaces on the Optical Telescope Assembly and on the COS FUV diffraction gratings. However, because the detector for the FUV channel is windowless, it was recognized early in the design phase that there was the possibility that COS would retain some sensitivity at shorter wavelengths due to the first surface reflection from the MgF2 coated optics. Preflight testing of the flight spare G140L grating revealed 5% efficiency at 1066Å, and early on-orbit observations verified that the COS G140L/1230 mode was sensitive down to at least the Lyman limit with 10-20 cm2 effective area between 912Å and 1070Å, and rising rapidly to over 1000 cm2 beyond 1150Å. Following this initial work we explored the possibility of using the G130M grating out of band to provide coverage down to 900Å. We present calibration results and ray trace simulations for these observing modes and explore additional configurations that have the potential to increase spectroscopic resolution, signal to noise, and observational efficiency below 1130Å.
Center for Astrophysics and Space Astronomy, Astrophysics Research Lab, University of Colorado, Boulder, CO, 80309
Department of Physics and Astronomy, Johns Hopkins University, Baltimore, MD 21218
University of California, Berkeley Space Sciences Lab, Berkeley, CA 94720
Space Telescope Science Institiute, Baltimore, MD 21218
1. Introduction
The Cosmic Origins Spectrograph (COS), installed in the Hubble Space Telescope in May, 2009, was intended to provide high sensitivity, moderate to low resolution spectroscopy between 1130Å and 3200Å (Green 2003). In addition to meeting this goal, COS has demonstrated sensitivity down to wavelengths approaching 900Å (McCandliss 2010), providing coverage in the Far Ultraviolet Spectroscopic Explorer (FUSE) band at sensitivities comparable to individual FUSE channels. The nominal G140L/1230 mode provides coverage from the detector cutoff at 1850Å down to 910Å, and two new modes, G130M/1096 and /1055, provide higher sensitivities and potentially much higher signal to noise at these wavelengths.
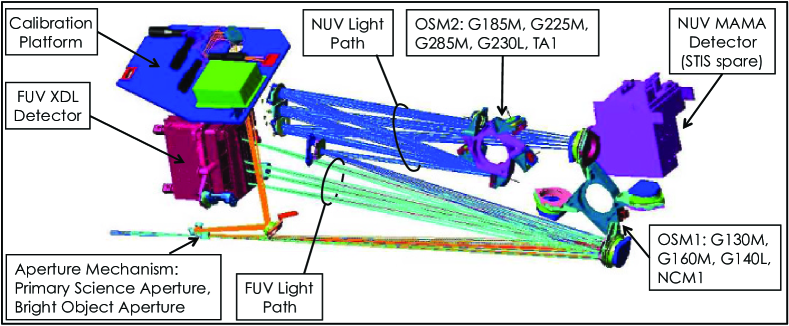
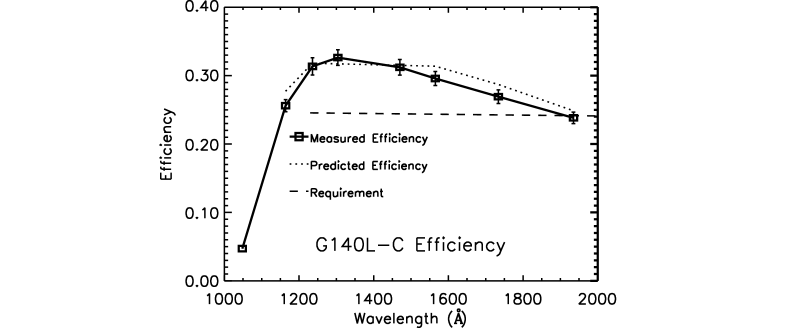
The COS light path is shown in figure 1. Light from the Optical Telescope Assembly (OTA) enters COS through an oversized aperture admitting the entire aberrated wavefront from a point-like source. The aperture is windowless so that any short wavelength (Å) light remaining after the two reflections in the OTA will travel unobstructed to the FUV grating. The gratings perform diffraction, aberration correction and focus in a single reflection in order to minimize reflections, maximizing short wavelength sensitivity. Light then travels to the windowless FUV detector. Laboratory testing indicated that the detector retains relatively high (30%) quantum efficiency down to at least 800Å. While the COS diffraction gratings and the OTA mirrors are coated with MgF2 protected aluminum (typically used for wavelengths longer than 1150Å), these optics were expected to retain some first-surface reflectivity below the MgF2 transmission cutoff at 1150Å. This was verified for the G140L-C (flight spare) grating in laboratory testing (fig.2) (Osterman 2002), and for the OTA during COS on-orbit testing.
2. G140L Modes
2.1. G140L/1230
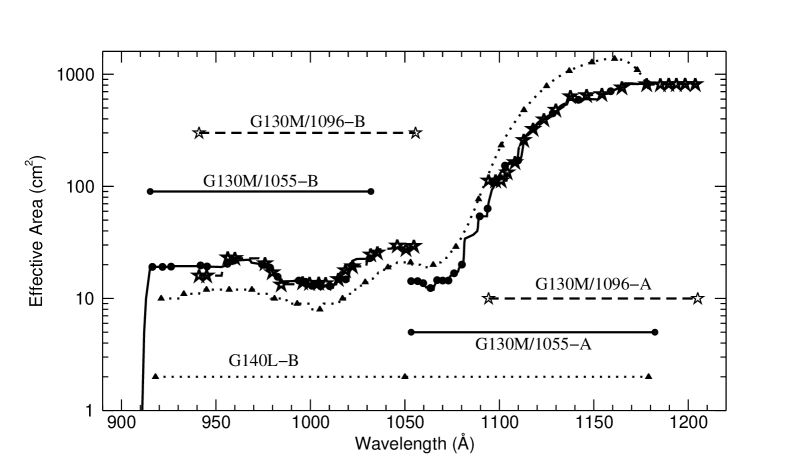
The FUV detector on COS is composed of two independently commandable mm segments, referred to as segments A and B (B is the shorter wavelength segment in all modes). Although the B segment is typically maintained a reduced voltage (HV-Low) for G140L/1230 setting, effectively disabling the snort wavelenght half of the detector, segment B was was intentionally left at the operating voltage (HV-Nom) during the first calibration tests. It was immediately obvious that the instrument and the OTA retained significant sensitivity down to approximately 900Å. Measured sensitivity is shown in fig. 3, dotted line + triangles). Spectroscopic resolution () is expected to drop from 2300 at 1250Å to no better than 2000 at 900Å (McCandliss 2010).
2.2. G140L/800
The success of the G140L/1230-B observations suggested the possibility of shifting the wavelength scale to the blue so that the central wavelength (falling on the detector gap) is 800Å. This would place the entire G140L pass band on a single detector segment and eliminate the need for multiple observations to obtain full coverage. This requires a relatively large focus mechanism move, placing the focus mechanism (discussed below) outside of the nominal focus range for the G130M and G160M gratings, but it could be argued that this does not represent an unacceptable risk given the increased observational efficiency that this mode could provide.
2.3. Red Leak
One difficulty encountered in the G140L/1230-B mode (and anticipated for the G140L/800 mode) is the greater than two order of magnitude increase in the effective area with wavelength across the B segment of the detector, rising from 10 cm2 at the shortest wavelengths to over 1300 cm2 at the long wavelength edge. As a result of this sensitivity variation only relatively dim targets can be observed without triggering the bright object protection despite the low sensitivity at the blue end of the band pass, significantly reducing the obtainable signal to noise. While the G140L grating could be repositioned so as to place the higher effective area portions of the spectrum on the A (disabled) detector segment to obtained more uniform sensitivity, this would bring zero-order light onto the B segment (as is the case with the G140L/1105 setting), undoing any attempts to flatten the countrate on the B segment.
3. G130M Modes
The instrument development team had not originally considered any short wavelength configurations for the G130M grating because we anticipated significantly degraded resolution as we moved farther and farther out of band and because we had no model or test data for the grating efficiency at wavelengths far from blaze. However, in light of the better than expected performance in the G140L/1230-B segment, we began exploring the possibility driving the short wavelength cutoff of the G130M spectrum down to 900Å. This had the potential to mitigate the unwieldy variation in sensitivity exhibited in the G140L/1230 mode and expected with the G140L/800 mode.
3.1. G130M/1055 and /1096
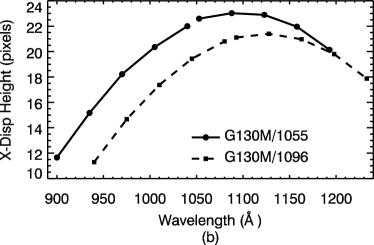
The COS FUV gratings are located 178mm from the center of rotation of the grating select mechanism (fig. 1). In addition to providing grating selection, this mechanism permits small adjustments to the band for each grating. This flexibility ensures that the full spectrum can be covered despite the gap introduced by the physical separation of the A and B detector segments. The grating select mechanism is in turn mounted on a linear translation mechanism to take out motion of the grating along the optical axis and to approximately accommodate changes to the location of the focal surface introduced by grating rotation. Larger than nominal moves are possible, but require substantial granting mechanism translations to correct for the focus offset. Large wavelength offsets may require a greater focus adjustment than the mechanism can provide, and even then would not fully recover the nominal instrument performance since the focal plane will no longer be coincident with the detector face. Also, outside of the nominal band the cross dispersion height is compromised.
Nevertheless, if reduced resolution is acceptable the gratings can be configured to support observations significantly outside of the design wavelength range. We proposed observing with the G130M grating rotated so that 900Å light would fall on the short wavelength edge of B detector segment and with a second position offset from the first by +41Å to ensure full coverage across the detector gap and overlap with the G130M/1291 mode. This configuration requires rotating the grating mechanism approximately ; the corresponding focus mechanism position that returns the best possible resolution is roughly a factor of two beyond the mechanism hard stops. Given the shallow slope of line width versus focus mechanism position, we chose to limit the focus offset to within the range used by existing modes. This represents a small reduction in resolution, but ensures that in the event of a focus mechanism failure during an observation in one of these new configurations performance would not be as severely degraded in the in the nominal G130M modes as it would with the mechanism at the extreme range of motion.
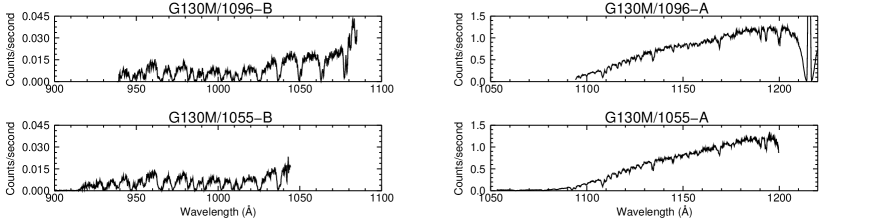
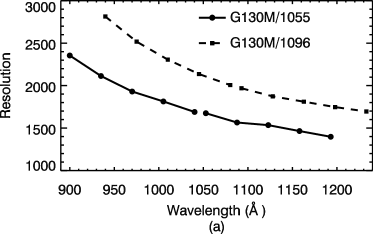
The two new modes, G130M/1055 and /1096, provide continuous spectral coverage from 900Å to the short wavelength edge of the existing G130M modes. Observations of GD561 were carried out over the third quarter of 2010 (fig. 4) and the effective area was determined to be higher than for the G140L/1230-B mode (fig. 3). Spectral resolution in these modes is under evaluation and appears to be consistent with ray trace predictions, dropping from approximately 2500 at the shortest wavelengths to 1400 at longer wavelengths (fig. 5 and table 1). While the large sensitivity variation is still apparent, with the G130M/1055 and /1096 modes the A segment of the detector can be disabled permitting observation of brighter objects to obtain higher S/N observations.
3.2. G130M-1215
In addition to the G130M/1055 and /1096 modes, we have performed ray trace modeling of a third new G130M mode, extending short wavelength coverage down to 1065Å. This mode does not require the large grating rotation and corresponding large refocusing move demanded by the G130M/1055 and /1096 configurations as the short wavelength edge is now only 55Å beyond the blue edge of G130M-1291. This off-nominal geometry compromises the best possible resolution and cross dispersion height, but to a much lesser degree than for the more extreme cases already explored, maintaining better than 16,000 resolution across the band. This mode has the added advantage of placing geocoronal Ly- on the detector gap.
4. Conclusion
The Hubble Space Telescope has provided spectacular imaging and spectroscopy longwards of 1150Å for over 20 years. The Cosmic Origins Spectrograph, while originally intended to provide spectroscopic coverage from 1130Å to 3200Å, has now extended the usable wavelength range of HST to the Lyman limit, providing spectroscopic access to wavelengths unobservable since the end of the FUSE mission in 2007. The capabilities of these new and proposed modes are summarized in table 1.
| COS | Wavelength | Effective | Modeled | Background |
| Mode | Range | Area | Resolution | (cts/resl/ksec) |
| G140L/1230 | 920-1160Å | 8-10 cm2 | 2100 | 0.3 |
| 1230-1850Å | (at 1000Å) | (1000Å) | ||
| G140L/800 | 920-1850Å | 8-10 cm2 | 2100 | 0.2 |
| (a segment) | (at 1000Å) | (1000Å) | ||
| G130M/1096 | 940-1081Å | 15-25 cm2 | 2300 | 1.3 |
| 1096-1238Å | (b segment) | (1000Å) | ||
| G130M/1055 | 900-1041Å | 15-25 cm2 | 1800 | 1.8 |
| 1055-1196Å | (b segment) | (1000Å) | ||
| G130M/1215 | 1065-1205Å | 30-2000 cm2 | 16,000 | 0.1 |
| 1220-1360Å | (b segment) | (1100Å) | ||
| Underlined modes are available or will be made available to observers in | ||||
| cycle 19. Modes in italic have not been tested and performance projections | ||||
| are based on modeling and on similar modes. | ||||
By expanding coverage to these shorter wavelengths, we make possible a range of investigations not previously accessible to HST, including studies of the Lyman continuum escape fraction from low redshift galaxies, of the Gunn Peterson effect at redshifts between 2 and 2.8 along multiple lines of sight, and observations of the O VI 1032, 1038 doublet. The higher resolution of the G130M/1215 mode could support observation of atomic and molecular diagnostics that could be used to study winds and atmospheres of massive stars, as well as the bulk of the mass in the translucent ISM out of which those stars form.
References
Froning, C. S., & Green, J. C. 2009, Ap&SS, 320, 181
Green, J. C., Wilkinson, E., & Morse, J. A. 2003, Proc SPIE, 4854, 72
McCandliss, S. R., France, K., Osterman, S., Green, J. C., McPhate, J. B., & Wilkinson, E. 2010, ApJ, 709, L183
Osterman, S. N., Wilkinson, E., Green, J. C., & Redman, K. W. 2002, Proc SPIE, 4485, 361
Sahnow, D. J., et al. 2000, Proc SPIE, 4013, 334
Sahnow, D. J., et al. 2010, Proc SPIE, 7731