A broadband and high throughput single-monochromator Raman spectrometer; application for single-wall carbon nanotubes
Abstract
We present a high sensitivity single-monochromator Raman spectrometer which allows operation with a tunable laser source. The instrument is based on the modification of a commercial Raman spectrometer; such instruments operate with holographic Rayleigh filters which also act as a laser mirrors and are usually considered as inherently narrow-band. In our design, the two tasks are separated and the filter can be freely rotated without much effect on the light alignment. Since rotation shifts the filter passband, this modification allows tunable operation with efficient stray light filtering down to 150 . The design is optimized for single-wall carbon nanotubes, for which the performance is demonstrated using a tunable dye-laser source. The spectrometer thus combines the high sensitivity with the broadband characteristics of usual triple monochromator systems.
pacs:
42.62.Fi, 42.79.Ci, 42.15.Eq, 78.67.ChI Introduction
Raman spectroscopy is an important tool in various fields of science from biology to physics or even mineralogy. In particular, Raman spectroscopy became the most useful method in the fundamental studies and characterization of single-wall carbon nanotubes (SWCNTs) DresselhausCNTRamanReview . The success of this method for this system and the increased demand for versatile spectrometers lead to a boom in instrument development.
Raman spectroscopy is an inelastic light scattering method, where the energy transfer to and from the system is characteristic to electronic, optical, vibrational, or even magnetic properties. The method operates with monochromatic lasers as excitation. Spectrometers which can be used with a tunable laser source are referred to as “broadband” herein. The Raman spectrum consists of the intensity of the scattered photons (or Raman intensity) at a given energy transfer (also called the Raman shift).
In the special case of the so-called resonance Raman spectroscopy (RRS), the Raman intensity is enhanced when either the exciting laser or the scattered light energy matches that of an optical transition of the system. For instance, RRS enabled to increase sensitivity in heavily diluted organic compounds RRS_Biology , to distinguish between different species in a minerals RRS_minearology , and to selectively enhance phonon modes with particular symmetries Falicov . SWCNTs possess different transition energies depending on their diameter, therefore a laser energy dependent RRS measurement allows to identify and study SWCNTs of different kinds.
The major challenge of Raman spectroscopy is the efficient suppression of photons with wavelengths close to that of the exciting laser Paillet_RSI_raman . Such photons originate from quasi-elastic light scattering processes such as e.g. Rayleigh scattering and their intensity dominates over the Raman process by a few orders of magnitude. This quasi-elastically scattered light is often referred to as “stray light” or “Rayleigh scattered light”.
The efficient stray light suppression is particularly important for SWCNTs due to the low energy () RaoCNTRamanScience Raman modes. This, combined with the narrow (FWHM ) optical transition energies FantiniPRL2004 require a broadband spectrometer with efficient stray light rejection.
Modern Raman spectrometers which allow operation down to 100 cm-1 contain holographic Rayleigh filters rather than the classical subtractive double monochromator system. Such spectrometers are often referred to as notch-filter Raman systems. The principal advantage of this development is the higher signal sensitivity as typical transmission for the holographic filters is above for the passband, whereas transmission for the double monochromator system is significantly lower for the frequency filtered light.
A principal drawback of Raman systems with holographic filters is their potentially narrow-band characteristics. This is due to the fact that holographic filters are manufactured for the most common laser lines only, e.g. for those of the Ar/Kr and He/Ne lasers. In principle, the range of filter operation could be extended by rotating them. However for most spectrometers, the holographic filter has a double role: it reflects the laser light to the sample and it functions as a Rayleigh filter. A rotated filter leads to a change in the optical path for the excitation that can be corrected for with a tedious spectrometer readjustment only. This is not practical for a measurement when operation with several laser lines is required. Then, what is gained by the higher sensitivity is lost upon the time spent with the readjustment.
Herein, we describe the modification of a commercial Raman spectrometer with holographic Rayleigh filters, which enable broadband operation with relative ease. The improvement is based on replacing the filter with a beam splitter which guides the laser light to the sample and transmits the emitted Raman light toward the spectrometer. The holographic filter is inserted into the path of the backscattered light behind the beam splitter where it is rotated without affecting the excitation. Thus the double role of the holographic filter is split into these two components and the rotation of the filter does not observably influence the direction of the transmitted light. Rotation of the holographic filter influences the passband differently for the and polarizationsNote (1) which is overcome by applying polarization filters on the spectrometer input. The setup operates with polarizations which are optimized when the so-called antenna effect of SWCNTs is taken into account, i.e. that the Raman light is polarized preferentially along the polarization of the excitation SunAntennaEffect ; Jorio:PhysRevLett85:2617:(2000) .
II Spectrometer setup
Commercial Raman spectrometers are usually equipped with a built-in laser and a setup optimized for this single laser line, however the characterization of SWCNTs requires measurements with a large number of laser lines KuzmanyEPJB or with a tunable laser system FantiniPRL2004 ; TelgPRL2004 . Such a high sensitivity, confocal single monochromator Raman system with a holographic Rayleigh filter can be modified to enable broadband measurements with a tunable laser, which we demonstrate for a LabRAM commercial spectrometer (Horiba Jobin-Yvon Inc.) as an example. The key step in achieving the broadband operation was replacing the built-in holographic filter, which acts as a beam splitter and a Rayleigh filter at the same time, with a combination of a simple beam splitter and the separated holographic filter. We note herein that this modification also enables a cost effective operation with usual laser wavelengths (such as e.g. the lines of an Ar/Kr laser) since no complicated filter realignments are required.
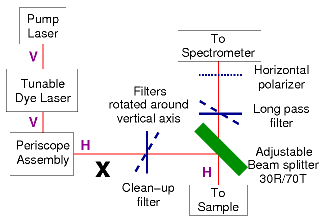
The block diagram of the broadband spectrometer is shown in Fig. 1. The tunable excitation light source is a dye laser (Coherent Inc., CR-590) operated in the 545 nm-660 nm range with a vertical polarization. Pumping is provided by a 532 nm 5 W solid state laser (Coherent Inc., Verdi G5). Three dyes; Rhodamin 110, Rhodamin 6G, and DCM Special (Radiant Dyes GmbH) cover 545-580 nm, 580-610 nm, and 610-660 nm wavelength ranges, respectively. The periscope allows beam alignment and also changes the polarization of the light from vertical to horizontal. The dye laser output contains a spurious fluorescent background which is filtered with short pass (“3rd Millennium filters” for 580 and 610 nm from Omega Optical Inc.) and band pass (“RazorEdge” for 568, 633, and 647 nm from Semrock Inc.) filters Note (2). The light is directed toward the sample with a broadband beam splitter plate (Edmund Optics Inc., NT47-240) with 30 % reflection and 70 % transmission. A single, long pass holographic edge filter (“RazorEdge” for 568, 633, and 647 nm from Semrock Inc.) performs stray light rejection near the laser excitation and allows operation down to .
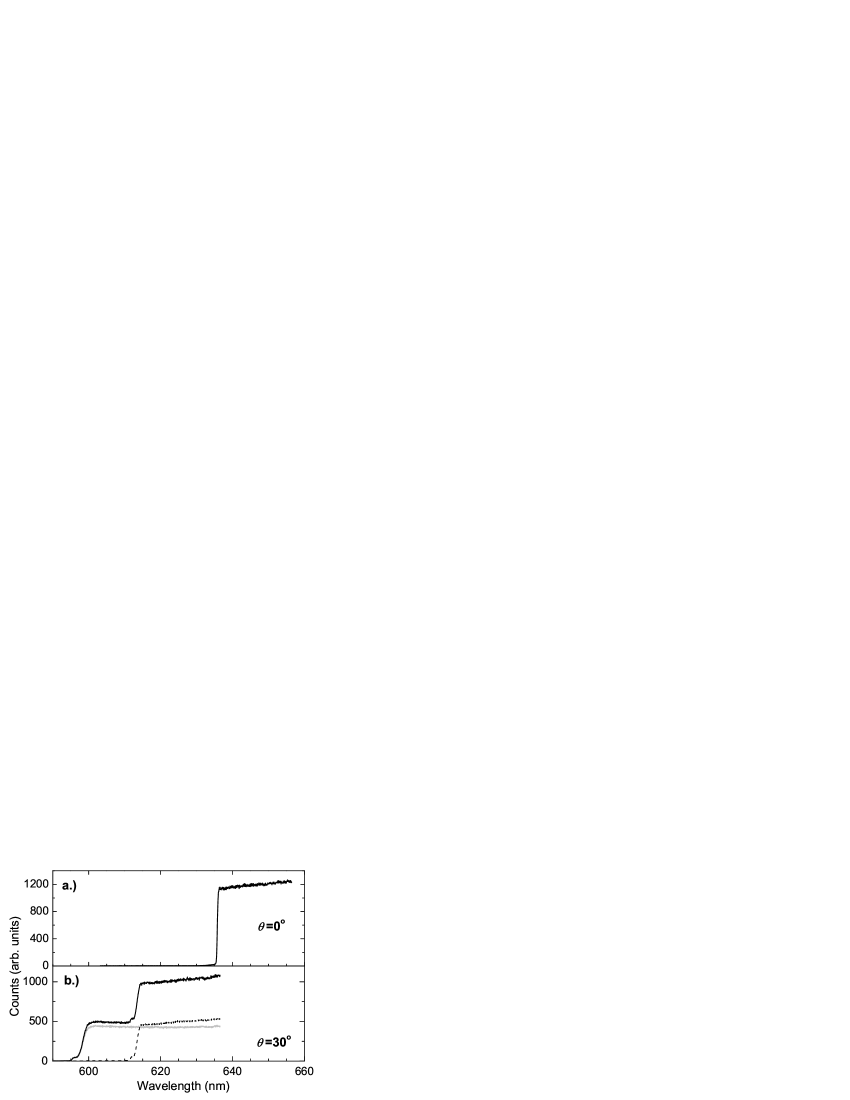
The ability to shift the transmission of the holographic filters by rotating them enables broadband operation. In Fig. 2., we show the filter behavior at different incidence angles for a 633 nm long pass filter. The edge of transmission blue shifts upon rotation with respect to normal incidence. However, the shift is smaller for the than for the polarization; i.e. the shift is larger for the horizontally polarized light when the filter is rotated around a vertical axis, such as it is realized in our instrument.
For the polarization, the blue shift upon rotation is , where is the passband wavelength at normal incidence, is the effective index of refraction for the filter, and is the angle of incidence. For filters with 1 inch apertures (such as the short pass and long pass filters), rotation angles up to ° were used which yields a blue shift of about 10 %. The band pass “Razor edge” filters had an aperture of 0.5 inch which limited the blue shift to about 5 %.
The filter transition width broadens for larger incidence angles. This is defined as the maximum difference between the laser wavelength at which the attenuation exceeds optical density 6 and the filter edge-wavelength at the 50 % transmission point. For the 30° incidence, a fivefold increase in the transition width is observed when compared to the normal incidence. For the ”RazorEdge” filters, the transition width at normal incidence broadens to , which makes it usable for Raman shifts above . The less shifted (in our construction vertically) polarized stray light is removed with a polarization filter before the spectrometer input.
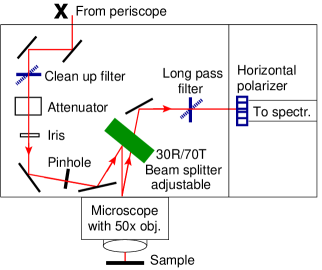
Fig. 3. shows the setup for the modified LabRAM spectrometer. For the original spectrometer, the long pass filter mirrors the light toward the sample and also acts as a Rayleigh filter. In our construction, the beam splitter mirrors the light toward the sample and the stray light is filtered with the separate long pass filter, therefore the double function for the filter is split. The broadband beam splitter plate has 30 % reflection and 70 % transmission, thus only a small fraction of the Raman light is lost. The 70 % excitation power loss on the beam splitter can be compensated by reducing the attenuation of the intensive laser beam, maintaining a constant irradiation density on the sample. The beam splitter plate is mounted on a finely adjustable 2-axis holder (Thorlabs Inc., VM1) with a home made mounting. The fine adjustment is required to set the light alignment properly with the spectrometer. Final fine adjustment is performed with the holder to maximize the Raman signal.
The long pass filter is rotated around a vertical axis, which is more practical than rotation around a horizontal one. This preferred axis fixes the optimal light polarization for the whole setup. The vertical rotation axis prefers a horizontally polarized scattered (Raman) light as it is of the polarization, for which the edge shift is larger. For SWCNTs, the Raman light is polarized preferentially along the polarization of the excitation, a phenomenon called antenna-effect SunAntennaEffect ; Jorio:PhysRevLett85:2617:(2000) . Therefore a horizontally polarized laser excitation is preferred which explains the polarizations used in our design. We also verified that the LabRAM spectrometer itself is not polarization-sensitive in contrast to an older triple monochromator system (Dilor XY triple monochromator system) which is about 3 times more sensitive to the vertical polarization of the scattered light than for the horizontal one.
III Measurements and discussion
Measurements were carried out on a HiPCO sample (Carbon Nanotechnologies Inc., Houston, Texas), which was suspended in a 2 weight% SDBS (Sodium dodecyl benzene sulfonate) in water using sonication. We focused on the radial breathing mode (RBM) Raman range located below 400 , which is commonly studied to characterize the diameter distribution in SWCNTs DresselhausTubes . Carbon-tetrachloride was used for Raman shift correction and Raman intensity normalization such as in Ref. FantiniPRL2004, . The LabRAM spectrometer allows to change between a macro and micro mode with a mirror. The macro mode is fitted with a sample holder for cuvettes, that was provided with the spectrometer. The suspended HiPCO sample was placed in a glass cuvette under the objective of the built-in microscope (Olympus LMPlan 50x/0.50, inf./0/NN26.5, yields about spot size) and the CCl4 reference sample was placed into the macro cuvette holder. This allowed a stable and robust spectral shift calibration and intensity normalization since the macro/micro mode change is reproducible and there is no need for further adjustments nor for sample exchange.
29 Raman spectra were acquired for laser excitation energies between 1.92 eV (648 nm) and 2.27 eV (545 nm) with an energy resolution of about 12 meV (). The spectrometer was operated with a 600 grooves/mm grating and a liquid nitrogen cooled CCD with 1024 pixels along the spectral direction, which yields a cm-1 Raman shift resolution and cm-1 spectral range for 600 nm (both are wavelength dependent). Typical laser powers of 1-5 mW were used with no observable heating effects. This is due to the liquid nature of both samples as a bucky-paper HiPCO sample is heated observably for powers above 1 mW.

Typical measurement times of 4 minutes for the sample and a few seconds for the reference yields an acceptable signal to noise ratio of about as it is shown in Fig. 4. The sample and reference measurements followed each other immediately without moving the grating position, which led to an accurate Raman shift measurement. A measurement cycle which consists of changing the dye laser wavelength, rotating of the laser clean-up and the long pass filters to the appropriate positions, shifting the spectrometer grating, nulling the spectrometer, and acquiring the spectra, lasted typically 8 minutes. Additional time is needed for the filter exchange (a few minutes) and to change the laser dye and to readjust the beam alignment (about 1 hour). We note that once the dye laser is set and the light path is properly aligned with the spectrometer, no further realignment is required when the wavelength is changed, even though the filters are rotated and the light is minutely displaced.
In total, 9 hours were required to complete the energy dependent Raman experiments with the 29 laser lines including 2 laser dye exchanges. Measurements of a similar scale such as published previously using a triple monochromator spectrometer SimonPRB2006 last for about 2 weeks, mainly due to the approximately 50 times smaller S/N ratio and the need for a spectrometer realignment upon wavelength change.
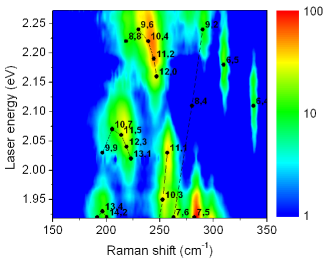
Logarithmic color scale shows the Raman intensity normalized to the maximum observed intensity. Full circles denote data published in Ref. FantiniPRL2004, .
Raman shift correction, intensity normalization, and the Raman map preparation was performed using a home-made software. Linear baseline correction was sufficient since no fluorescent response was encountered. Raman shift was corrected for with the carbon-tetrachloride Raman modes at 218 and 314 cm-1. Intensity normalization using CCl4 is required as it accounts for instrumental uncertainties such as a slight misalignment of the scattered light upon dye exchange. We checked the consistency of the normalization by measuring the same wavelength with different laser dyes after spectrometer realignment.
Fig. 5. shows the 2D contour plot of the Raman map. The normalized Raman intensity is displayed on a logarithmic scale. A good agreement is observed between our data and the measurements in Ref. FantiniPRL2004, , whose resonance transition energies and Raman shifts are shown for the different SWCNT chiral indexes, , with full circles. We do not observe the (8,4) SWCNT in our measurement. Points corresponding to the same SWCNT families, i.e. when is constant DresselhausTubes , are connected by solid lines.

The agreement shows the utility of the broadband arrangement with a clear advantage over previous results in terms of acquisition time. Vertical, i.e. energy cross section of the Raman map were obtained by averaging around a given Raman shift. Representative energy cross section data are shown in Fig. 6., along with fits using the resonance Raman theory FantiniPRL2004 ; SimonPRB2006 :
| (1) |
where is the laser energy () dependent Raman scattering intensity, is the quasiparticle scattering rate, is the transition energy, is the phonon energy.
Fits yield transition energies and quasiparticle scattering rates of eV and meV for the (11,2) SWCNT with cm-1, and eV and meV for the (6,5) SWCNT with cm-1. These values agree well with typical literature values when it is taken into account that the different solvent environment slightly modifies the Raman transition energies FantiniPRL2004 .
We note that no further corrections were made to obtain the energy cross section data apart from the normalization by the reference. The result is therefore remarkably smooth in comparison with similar data published in Refs. FantiniPRL2004, ; TelgPRL2004, ; DoornPRB2008, . This is due to the robust and reproducible measurement of the reference sample and possibility of measuring Raman spectra at different wavelengths without spectrometer readjustment in between.
IV Conclusions
In conclusion, we presented the broadband modification of a high sensitivity commercial Raman spectrometer. The improvement allows the use of a tunable dye laser. The spectrometer performance is demonstrated on SWCNTs where such tunable measurements are inevitable to obtain meaningful insights into the vibrational and electronic properties.
Acknowledgements.
Work supported by the Austrian Science Funds (FWF) project Nr. P21333-N20, by the European Research Council Grant Nr. ERC-259374-Sylo, and by the New Hungary Development Plan Nr. TÁMOP-4.2.1/B-09/1/KMR-2010-0002.References
- (1) M.S. Dresselhaus, G. Dresselhaus, R. Saito, and A. Jorio. Raman spectroscopy of carbon nanotubes. Physics Reports, 409(2):47–99, 2005.
- (2) P. R. Carey. Resonance Raman-Spectroscopy in Biochemisty and Biology. Quarterly Reviews of Biophysics, 11(3):309–370, 1978.
- (3) Sergo V. Gotoshia and Lamara V. Gotoshia. Laser Raman and resonance Raman spectroscopies of natural semiconductor mineral cinnabar, alpha-HgS, from various mines. Journal of Physics D-Applied Physics, 41(11):115406–1–6, JUN 7 2008.
- (4) R. M. Martin and L. M. Falicov. Resonance Raman scattering, page 79. Springer, Berlin, 1983.
- (5) Matthieu Paillet, Francois Meunier, Marc Verhaegen, Sebastien Blais-Ouellette, and Richard Martel. High performance resonance Raman spectroscopy using volume Bragg gratings as tunable light filters. Review of Scientific Instruments, 81(5), MAY 2010.
- (6) A.M. Rao, E. Richter, S. Bandow, B. Chase, P.C. Eklund, K.A. Williams, S. Fang, K.R. Subbaswamy, M. Menon, A. Thess, R.E. Smalley, G. Dresselhaus, and M.S. Dresselhaus. Diameter-selective raman scattering from vibrational modes in carbon nanotubes. Science, 275(5297):187–191, JAN 10 1997.
- (7) C. Fantini, A. Jorio, M. Souza, M. S. Strano, M. S. Dresselhaus, and M. A. Pimenta. Optical Transition Energies for Carbon Nanotubes from Resonant Raman Spectroscopy: Environment and Temperature Effects. Phys. Rev. Lett., 93:147406, 2004.
- Note (1) \BibitemOpenThe and refer to polarizations which are perpendicular and parallel to the plane of incidence, respectively.\BibitemShutStop
- (9) H. D. Sun, Z. K. Tang, J. Chen, and G. Li. Polarized raman spectra of single-wall carbon nanotubes mono-dispersed in channels of -5 single crystals. Solid State Communications, 109(6):365–369, 1999.
- (10) A. Jorio, G. Dresselhaus, M. S. Dresselhaus, M. Souza, M. S. S. Dantas, M. A. Pimenta, A. M. Rao, R. Saito, C. Liu, and H. M. Cheng. Polarized Raman Study of Single-Wall Semiconducting Carbon Nanotubes. Phys. Rev. Lett., 85:2617–2620, 2000.
- (11) H. Kuzmany, W. Plank, M. Hulman, Ch. Kramberger, A. Grüneis, Th. Pichler, H. Peterlik, H. Kataura, and Y. Achiba. Determination of SWCNT diameters from the Raman response of the radial breathing mode. Eur. Phys. J. B, 22(3):307–320, 2001.
- (12) H. Telg, J. Maultzsch, S. Reich, F. Hennrich, and C. Thomsen. Chirality Distribution and Transition Energies of Carbon Nanotubes. Phys. Rev. Lett., 93:177401, 2004.
- Note (2) \BibitemOpenThe use of a short pass filter for laser clean-up limits operation for the Stokes Raman range.\BibitemShutStop
- (14) R. Saito, G. Dresselhaus, and M.S. Dresselhaus. Physical Properties of Carbon Nanotubes. Imperial College Press, 1998.
- (15) F. Simon, R. Pfeiffer, and H. Kuzmany. Temperature dependence of the optical excitation lifetime and band gap in chirality assigned semiconducting single-wall carbon nanotubes. Phys. Rev. B, 74:212411(R)–1–4, 2006.
- (16) Stephen K. Doorn, Paulo T. Araujo, Kenji Hata, and Ado Jorio. Excitons and exciton-phonon coupling in metallic single-walled carbon nanotubes: Resonance raman spectroscopy. Phys. Rev. B, 78(16):165408, Oct 2008.