We present two recent results obtained by the CDF collaboration at
the Tevatron collider. New Cabibbo suppresed decay modes have been
observed using 5.9 of data: and .
We report also on masurement of the ratios of the branching ratios () of the new modes
to those of the -meson to the same final states:
and
Then we discuss the first polarization measurement in a charmless
decay in two light vector mesons, ,
using 2.9 of data. An angular analysis of the final state particles
allows CDF to determine a longitudinal polarization fraction
, which is inconsistent
with naïve expectations based on the V-A nature of weak currents and confirms
the pattern of lower than expected
longitudinal polarization fraction in penguin dominated decays.
Finally, an updated measurement of the ratio of to that of the
reference mode is also presented:
1 Introduction
The Tevatron collider has provided in the last decade an impressive amount of
collision data that the two collaborations, CDF and D0, have very fruitfully exploited.
In particular large, samples of fully reconstructed decays have been collected
allowing crucial progress on mixing, lifetime, decay width difference
as well as the observation of a large number of decay modes.
We will review here two recent results from the CDF experiment:
the first observation
of the Cabibbo suppressed and decay modes and measurement
of their branching ratio () [1], and the first angular analysis of
charmless decay for the determination of polarization amplitudes [2].
Important characteristics of the CDF II detector [3] that are
worth to be mentioned in connection to these two measurements are the trigger and
charged track reconstruction capabilities.
A dimuon trigger with a threshold
as low as 1.5 and is used for modes.
The trigger on displaced vertex with online measurement of
impact parameter of charged tracks [4] allows the collection of hadronic decay
modes like .
The charged particles in the pseudorapidity
range
are reconstructed by a silicon microstrip
vertex detector and a drift chamber,
providing excellent resolution on -meson decay length () and
mass, typically about for modes,
that are crucial for the observation of rare modes.
2 Observation of and
The and decays are celebrated ”golden” modes where the greatly dominant
amplitude is a Cabibbo favoured tree
thus providing a crucial and theoretically clean determination of . Among the residual theoretical
uncertainty, which may become important at the next generation flavor experiments, there are
those related to the subleading
penguin amplitude which is suppressed by , where
, with respect to the tree one. A different ratio between
tree and penguin is expected, on the other hand, in the
and decays. For these modes the tree and penguin amplitudes enter both at order . Consequently we
expect a decay rate relative to the ones of order . Moreover,
by measuring both the rate and the CP violation in the mode,
theoretical uncertainties on due to penguin pollution will be
reduced to a fraction of a
degree [5]. Similar consideration apply to the
the study of to constrain theoretical uncertainties in the extraction of from decays [6]
The data used for this measurement corresponds to an integrated luminosity of 5.9 fb-1.
We derive the ratios of branching
ratios of and to the reference decays using the relation:
where represents or . By measuring the ratio of the number of and decays
from data and the relative acceptance, , between the and modes from Monte Carlo simulation (MC), a
measurement of is extracted using the ratio of fragmentation fractions .
The event selection in the analysis is optimized by maximizing [7]
in a simultaneous four-dimensional scan over four discriminating quantities:
, , transverse decay length and -vertex fit probability.
To extract the and signal yields
a likelihood fit to the invariant mass distribution is performed.
The signal shape is modeled with three Gaussians template obtained from a fit to
a simulated sample.
The template used in the fit is
identical to template, except for a shift of 86.8 MeV/ in the mean value of the three Gaussians,
corresponding to the mass difference between and [8].
The backgrounds considered in this analysis are combinatorial background, partially reconstructed background and decay.
The combinatorial background is modeled with an exponential function.
The partially reconstructed one, fitted with an ARGUS function [9],
is due to five-body decay with a , , or not reconstructed.
Finally, a two Gaussians template, extracted from simulation, is used to
model the background, with a normalization constrained by data.
The yields for and modes are respectively 9530 110
and 151 25. The statistical significances of the signal is 8.0.
The systematic uncertainty is dominated by the combinatorial background contribution,
with a relative uncertainty
for the to ratio of 31.4%. Other sources of systematic uncertainty are the signal modeling (4.4%), and contribution (1.3%).
For the observation of the a Neural Network (NN) based multivariate classifier
is used to further reduce combinatorial background.
In order to train the NN, simulated MC events are used as signal.
Data from the upper side band in the candidate invariant mass distribution, well separated from the signal region,
are used as a background data sample.
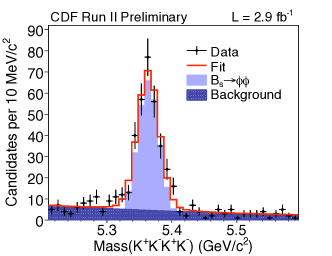
A likelihood fit similar to the one described before is performed to the invariant mass distribution to extract the yield of the and signals.
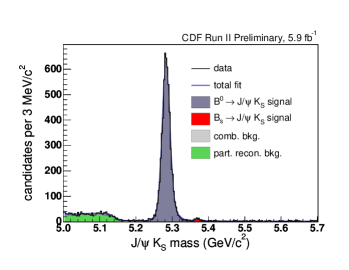
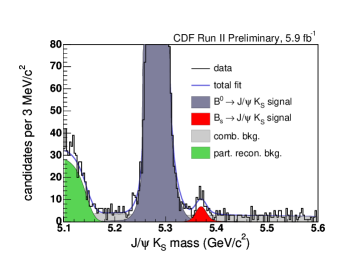
From the fit, shown in Fig. 1, the yields of the and
signal are determined to be 5954 79 and 64 14, respectively.
The statistical significances of the signal is 7.2.
In this case the relative uncertainties for the ratio of yields are 5.6% from the
combinatorial background contribution, 5.6% from the combinatorial background modeling,
4.6% from the signal modeling.
Figure 1:
Invariant mass for selected candidates with fit (left). Enlarged version of the same plot showing
the signal region in greater detail (right).
To determine the ,
a correction of 1% and 5% for the ratio of
acceptance is obtained from simulation respectively for the
and case.
The and lifetimes, B hadron spectrum and polarization, this last one only for the analysis, are considered as a source of systematic uncertainty in the efficiency correction.
The most recent CDF measurement [10] of is combined with the
actual PDG value [8] for , to extract = 0.269 0.033. We can
thus estimate:
This confirms the order of magnitude estimate, ), for this ratio given above.
3 Polarization Measurement
The belongs to a particular class, , of decays in a
pair of J=1 mesons which are in a superposition of CP eigenstates.
It will be used to constrain new physics contribution to
mixing phase through a measurement of time dependent
CP violation.
Three independent amplitudes govern decays,
corresponding to the possible polarizations of the
final state mesons. It is thus attractive to test the
theoretical predictions for these polarization
amplitudes [11, 12, 13].
Evidence for the process has been reported by CDF with low statistics [14].We discuss here the first measurement of polarization amplitudes in this decay
and an updated measurement of the branching ratio using 2.9 .
The decay proceeds through a quark level
process, and, in the Standard Model (SM), the dominant diagram is the
penguin. The same penguin amplitude is involved in several processes
which have shown several discrepancies with the SM predictions. In particular, both SM and new physics interpretations
have been considered to explain the lack of dominant longitudinal polarization
component for several penguin dominated decay modes [15].
Measurements of polarization amplitudes in new modes, including decays,
have been proposed [16] to resolve this issue.
We study also decays in the same dataset, use this mode as a normalization
for the BR measurement and extract polarization amplitudes
as a cross check of the main result.
Event selection is the same for both BR and polarization measurement and is described
in detail elsewhere [17].
The invariant mass of the selected candidates is shown in
Fig. 2 along with the projection of the likelihood fit
desribed in the following.
Two sources of background are expected in the signal region:
combinatorial background
and reflection with the wrong assignment of a kaon mass to the decay pion. Similar
consideration apply for the case where constitute the only
expected reflection component.
We estimate a contribution of
and under respectively the and signals and fit the total number of signal decays as
and where the first uncertainty is
statistical and the second
is systematic and is evaluated using alternative signal and background models.
To extract the decay rate first the measurement of the branching ratio
ratio to the mode is performed by correcting for the relative detection
efficiency for the two decays:
.
We then derive ,
adopting the BR() from ref. [18],
corrected for the current measurements [8] of
111We actually use: .
The dominant systematic uncertainty, labeled (BR), originate from the
uncertainty alone.
This result is in agreement and supersedes our previous measurement[14]
and represents a substantial improvement in the statistical uncertainty;
it is as well compatible with recent theoretical predictions [11, 12, 13].
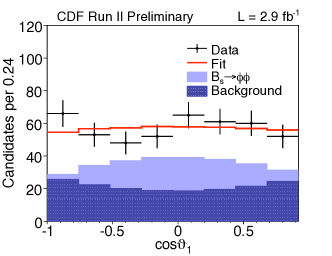
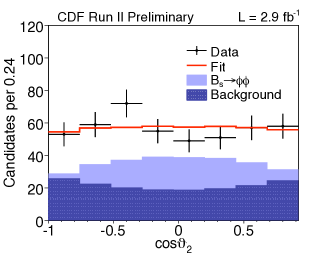
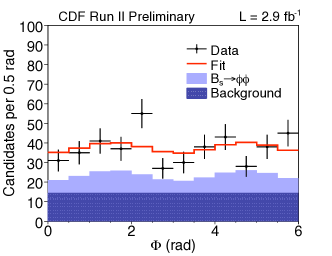
Figure 2:
candidate mass and angular distribution with overlayed fit result
for signal and background.
The angular distribution of the decay products can be
described using the helicity variables,
), where
is the angle between the direction of the from each
and the direction opposite the in the vector
meson rest frame, while is the angle between the two resonance
decay planes. The total decay amplitude can be decomposed in three complex amplitudes
corresponding to the vector helicity ;
we use their linear combinations which give the polarization
amplitudes222The polarization amplitudes are normalized
so that the following condition holds:
.:
, and
. The differential decay rate can
be expressed as
where the terms account for the exponential decay and the
time evolution of the state due to mixing and decay width differences while the are functions of the helicity
angles only. We measure the untagged decay rate integrated in time and
neglect the mixing phase (tiny in the SM) and assume no direct CP violation.
The differential decay rate then
depends on the polarization amplitudes at and on
the light and heavy mass-eigenstate lifetimes, and
respectively, as follows:
(1)
where .
and
We perform an unbinned maximum likelihood fit to the reconstructed
mass of the candidates and the helicity
variables in order to measure the polarization amplitudes.
The mass distribution is used in the fit to discriminate the
signal from the background. The identification of the two as
and to define the angles and
is randomly implemented in order to satisfy the Bose
symmetry under indexes exchange . The likelihood
for each candidate is defined as
,
where is the fraction of the background and
are the probability density function
(PDF) for the signal () and background () components which
depend on the fitting parameters, and
respectively.
Both the signal and the background PDF are the product of a mass PDF and an
angular one.
The signal mass component for both signal and background has been
already described.
Fixing and to the world
average values [8], the angular
PDF for the signal is given by Eq. 1 multiplied by
an acceptance factor; the latter is implemented as a three-dimensional
histogram representing the probability to find an event at each
position of the space. The angular acceptance is derived from a MC
simulation of the decay, generated averaging over all possible spin states
of the decay products.
We use a purely
empirical parameterization derived by analysing the angular
distributions in the mass sidebands to model the background angular
PDF.
The fitter is extensively tested using simulated
samples with a variety of input parameters.
A further check is performed
by repeating the same measurement for the events
collected with the same displaced vertex trigger as ;
we find and ,
in very good agreement with CDF and D0 measurements [19].
Observable
Result
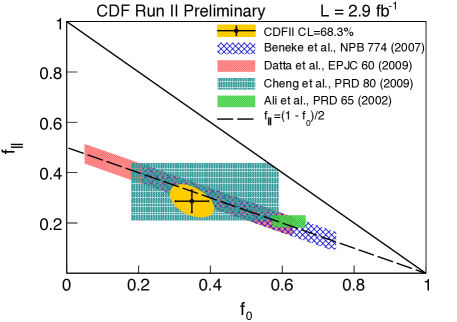
Figure 3:
experimental results with stat. and syst. uncertainties (left panel),
comparison to recent theory predictions (right panel).
Fit projections on the angular variables and the results for the
polarization observables compared to recent theory
calculations are shown in Fig. 2 and Fig. 3.
Several sources of systematic uncertainty are considered.
We account for the physics background effects through simulated
samples. We consider the decay,
the resonant decay and the decay
to plus a non-resonant kaon pair,
whose fractions are normalized to the signal yield in analogy with similar decays.
Assuming up to 4.6% contamination of and
0.9% of we estimate a 1.5%
systematic uncertainty from backgrounds unaccounted for.
Possible biases introduced by the time integration are
examined with MC simulation: they are induced by the dependence of the angular acceptance on
and by a non-uniform acceptance with the
proper decay time introduced by the displaced track trigger; the assigned
systematic (1%) is the full shift expected in central value,
assuming a value for equal to the world average plus
one standard deviation. We consider the propagation of
uncertainties to the polarization amplitudes (1%). We have also
verified that the impact of a sizeable CP-violating phase in mixing
would be negligeable on polarization observables. Combinatorial background parametrization and angular acceptance
give minor contributions to systematic uncertainties.
In conclusion for we find a significantly suppressed longitudinal fraction
, that is
found to be even smaller than in other penguin decays [8].
This result is
in agreement, within uncertainties, with predictions [11, 13]
based on QCD factorization, but seems to contradict others [12].
It implies the hyerarchy in polarization amplitudes,
possibly induced by a large penguin annihilation contribution [15, 16].