Spectroscopic calculations of the low-lying structure in exotic Os and W isotopes
Abstract
Structural evolution in neutron-rich Os and W isotopes is investigated in terms of the Interacting Boson Model (IBM) Hamiltonian determined by (constrained) Hartree-Fock-Bogoliubov (HFB) calculations with the Gogny-D1S Energy Density Functional (EDF). The interaction strengths of the IBM Hamiltonian are produced by mapping the potential energy surface (PES) of the Gogny-EDF with quadrupole degrees of freedom onto the corresponding PES of the IBM system. We examine the prolate-to-oblate shape/phase transition which is predicted to take place in this region as a function of neutron number within the considered Os and W isotopic chains. The onset of this transition is found to be more rapid compared to the neighboring Pt isotopes. The calculations also allow prediction of spectroscopic variables (excited state energies and reduced transition probabilities) which are presented for the neutron-rich 192,194,196W nuclei, for which there is only very limited experimental data available to date.
pacs:
21.10.Re,21.60.Ev,21.60.Fw,21.60.JzI Introduction
Quadrupole collectivity has long been understood as one of the most basic, yet prominent, aspects of nuclear structure BM ; RS . Nuclei are quantum many-body systems exhibiting collective properties associated with a distinct shape of the mean-field, which can be represented by a geometrical surface. Quadrupole collectivity can then be understood as a quadrupole-shaped deformation of the nuclear surface whose magnitude depends on the number of valence nucleons, and has been shown to exhibit remarkable regularities in spectroscopic observables, such as the excitation energy of the state and the ratio . Also evident are stunning shape/phase transitions at specific nucleon numbers where the collective nature of the quantal nuclear system can be well described as a phase transition between (for example) quadrupole vibrational and statically (quadrupole) deformed potentials RS ; Casten_nature .
The underlying multi-fermion dynamics of such nuclei however, is so complex that its microscopic understanding still continues to be a theme of major interest in nuclear structure physics research. Mean-field studies, based on Skyrme Bender_review ; Sk ; VB and Gogny Go as well as relativistic Bender_review ; Vretenar-1 Energy Density Functionals (EDFs) provide reasonable descriptions of various nuclear properties such as masses, charge radii, mass density distributions, and surface deformations, over a wide range of neutron and proton numbers RS ; Bender_review . Such mean-field models, with their intrinsic spontaneous symmetry breaking mechanism, are highly relevant to understand the microscopy of the nuclear quadrupole deformation and, therefore have been used as a starting point for predictions relevant for future nuclear spectroscopic investigations in exotic nuclei RS ; Bender_review ; CollSk ; CollGo ; CollRHB .
Phenomenological studies using the Interacting Boson Model (IBM) AI have enjoyed significant success in describing the low-lying quadrupole collective states of medium-mass and heavy nuclei. The merit of the IBM lies in its simplicity, such that, based on group theory, the highly complicated multi-fermion dynamics of surface deformation can be simulated by simple, effective bosonic degrees of freedom, which correspond to (collective) pairs of valence nucleons OAI . In addition to its success in reproducing a large amount of experimental data on low-lying collective nuclear states in heavy nuclei, the microscopic derivation of the IBM Hamiltonian has also been extensively studied OAI ; OCas ; MO . In particular, a novel way of deriving the interaction strengths of an IBM Hamiltonian has been proposed recently nso . This method is based on simulating the potential energy surface (PES) of a given EDF by the corresponding IBM PES. The IBM parameters are then derived as functions of the nucleon number using the Wavelet analysis method nsofull . In this way, the universality of the nuclear EDF and the simplicity of the IBM can be combined, thereby allowing the calculations to predict directly measurable spectroscopic observables such as excitation energies and electromagnetic transition rates between specific states. A number of spectroscopic calculations have been carried out using this method for the Ru, Pd, Ba, Xe, Sm isotopic chains, as well as theoretical predictions on Os-W nuclei, using the Skyrme EDF nsofull .
The neutron-rich W, Os and Pt nuclei with exhibit a very challenging structural evolution, which has already been extensively studied Shi06 ; Pod00 ; Jolie2003HfHg ; Alk09 ; Reg08 ; Lane ; Wheldon ; Bond83 . As originally pointed out in Pod00 the ratio in 190W is anomalously small compared with the one in neighbouring isotopes. The most recent experimental data on the neutron-rich tungsten chain from 188,190,192W Shi06 ; Alk09 ; Lane all suggest a change from a well deformed, axially symmetric prolate shape for lighter tungsten isotopes, to a more gamma-soft system for 190W. This transition from a prolate to very gamma-soft system for neutron number (i.e., for 190W) is consistent with the recent observation of the second 2+ state in 190W which appears to lie lower than the yrast 4+ in this nucleus Alk09 . The neutron-rich nature of the heavier W and Os nuclei make them experimentally challenging to study. However, in recent years, there has been some progress in their structural investigation following multi-nucleon transfer Shi06 ; Lane ; Wheldon and isomer and/or beta-delayed gamma-ray spectroscopy following projectile fragmentation reactions Pod00 ; Alk09 ; Reg08 . The current experimental information is limited to the yrast sequence in 190W Alk09 ; Lane and the identification of the state in 192W Alk09 . It is interesting to note that the yrast 2+ states in the isotones 190W and 192Os have almost identical energies (206 keV), as do the isotones 192W and 194Os (218 keV).
On the theoretical side, mean-field calculations have been performed which predict the shapes of these systems both with (e.g., stevenson ) and without (see, e.g., Refs. RaynerPt ; gradient-2 , and references therein) the assumption of axial symmetry in the nuclear mean field. The IBM has also been applied to fit the spectral properties of W isotopes in a phenomenological way DB_W . More recently, spectroscopic calculations have been carried out nor to describe the structural evolution in Pt isotopes with the Gogny-D1S EDF D1S . In this paper, we review the current spectroscopy relevant to the prolate-to-oblate shape/phase transition in neutron-rich Os and W isotopes. We also report the predicted excitation spectra and the transition probabilities on the neutron-rich Os and W nuclei. The spectroscopic calculations have been carried out in terms of the IBM Hamiltonian derived by mapping (constrained) Hartree-Fock-Bogoliubov (HFB) calculations, based on the Gogny-D1S EDF, using a similar technique as in nor .
II Theoretical procedures
We begin with the calculation of the PES in terms of the (constrained) HFB method using the Gogny-D1S EDF. The solution of the HFB equations, leading to the set of vacua , is based on the equivalence of the HFB with a minimization problem which is solved using the gradient method gradient-2 . In agreement with the fitting protocol of the force, the kinetic energy of the center of mass motion is subtracted from the Routhian to be minimized, in order to ensure that the center of mass is kept at rest. The exchange Coulomb energy is considered in the Slater approximation and the contribution of the Coulomb interaction to the pairing field is neglected. The HFB quasiparticle operators are expanded in a Harmonic Oscillator (HO) basis having enough number of shells (i.e., major shells) to grant convergence for all values of the mass quadrupole operators and for all the nuclei studied. The constraint is imposed on the average values of the mass quadrupole operators and to the desired deformation values and . In Refs. RaynerPt ; gradient-2 , the energy contour plots with and have been used to study the (mean-field) evolution of the ground state shapes in Pt nuclei. Alternatively, one could also consider the representation in which the quadrupole deformation parameter is written gradient-2 in terms of as , where represents the mean squared radius evaluated with the corresponding HFB state . The set of constrained HFB calculations provides the Gogny-D1S PES, i.e., the total HFB energies .
For the bosonic mapping we use the IBM-2, comprised of independent proton (, ) and neutron (, ) bosons. The number of proton (neutron) bosons, denoted by (), is equal to half of the number of valence protons (neutrons), assuming the usual magic-number shell gaps at and 82, and and 126. We adopt the standard IBM-2 Hamiltonian nso ; nsofull ; nor .
| (1) |
where and with . The bosonic PES is represented by the expectation value of in the boson coherent state coherent , given by
| (2) |
where stands for the boson vacuum (i.e., inert core) and the coefficients ’s are expressed as , and . The intrinsic shape of the nucleus is then described in terms of the (axially symmetric) deformation and the (triaxial) deformation . The IBM PES reads nso ; nsofull
| (3) |
where and is assumed for simplicity nso ; nsofull . We also assume the proportionality, i.e., , where is a numerical coefficient, and nso ; nsofull . In this context, the variables and represent the boson images of the (fermion) deformation parameters (, ). A point on the HFB PES, (,), within an energy range relevant for the considered low-lying quadrupole collective states, is mapped onto the corresponding point on the IBM PES, (,). The , , and values are fixed for a given nucleus by drawing the IBM PES so that the surface topology of the corresponding HFB PES is reproduced. This is done unambiguously by means of the recently developed procedure nsofull using the Wavelet transform wavelet .
Note that we compare the total energies and . By reproducing the HFB PES as much as possible, effects of both vibrational and rotational kinetic energies, similar to those introduced when solving a five-dimensional (5D) collective Bohr Hamiltonian (see, for example, Refs. CollSk ; CollGo ; CollRHB ), should be included in the boson systems. For large deformation, however, the rotational response, i.e., the response to cranking, differs significantly between nucleon and boson systems, resulting in the deviation of the IBM rotational spectra from fermionic ones. This deviation could be corrected by introducing an additional rotational kinetic-like term, i.e., the so-called term SU3 in the IBM Hamiltonian ibmmass . This problem does not show up in the present work where only the moderately deformed nuclei are concerned, and thus we neglect the term in the boson Hamiltonian of Eq. (1).
We also note that to what extent the present mapping procedure mimics the solution of a 5D Bohr Hamiltonian is an interesting open question, which may be partly answered by looking at how reasonably our results compare with the ones of the 5D Hamiltonian and the available experimental data.
III Mapped IBM PES and the derived parameters
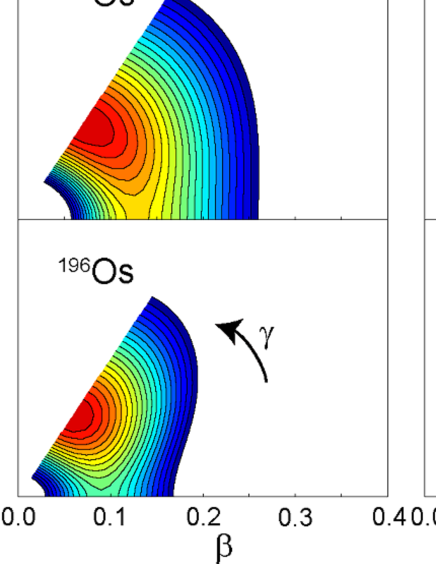
Figure 1 shows the mapped IBM PESs for 190-196Os and 188-194W nuclei up to 2 MeV excitation from the energy minimum. The corresponding HFB PESs have been reported in Fig. 3 of Ref. gradient-2 . The PESs for both Os and W nuclei show similar tendencies. There are quantitative differences between the Pt and Os-W isotopic chains, namely that the topology of the PES changes more slowly in the former nor , compared to the latter in Fig. 1. An (almost) axially symmetric, oblate minima is observed in Pt nuclei with and shallow triaxiality for and 112 gradient-2 ; nor . On the other hand, the Os and W isotopes are predicted to have the corresponding oblate minima only for and 120, with a more rapid change to axially symmetric prolate deformation for . Indeed, shallow triaxiality (i.e., -softness) appears only around for both Os and W nuclei gradient-2 . The corresponding mapped IBM PESs reproduce these trends of the HFB PESs of gradient-2 well, whereas the location of the minimum in the IBM PES differs from that of the HFB PES of Ref. gradient-2 in some nuclei as the present IBM PES of Eq. (3) does not produce a triaxial minimum. The mapped PES for the isotone, 192Os is predicted to be very flat along the -direction. Similarly, the IBM PES for 190W is also very flat, with the global energy minimum corresponding to a quadrupole deformation of on the oblate side. This flatness is the consequence of the and parameter values, such that their sum is close to zero. Comparing Os and W isotopes with the same neutron number, the W nuclei are generally steeper in both and directions than the corresponding Os isotone. A similar trend is also observed in the corresponding HFB PESs gradient-2 .
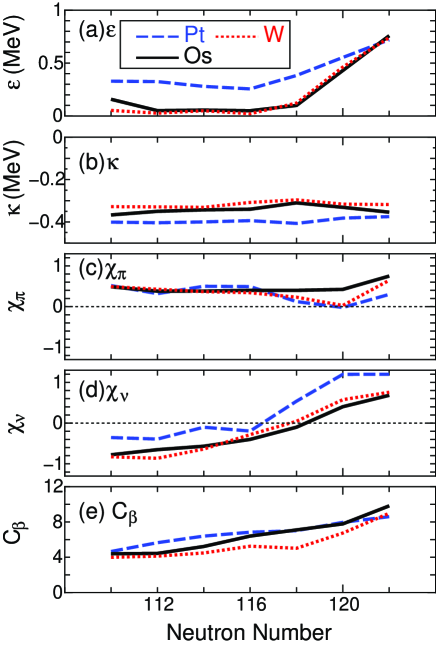
Figure 2 shows the evolution of the derived IBM parameters for the considered Os and W nuclei as functions of the neutron number . The parameter values for Pt nuclei, taken from Ref. nor , are also shown for comparison. There are significant differences in quantitative details of the derived IBM parameter values between Os-W and Pt nuclei. In particular, the values of the parameter in Fig. 2(a) for Os and W nuclei are rather small in the region away from the shell closure as compared to Pt nuclei. In Fig. 2(b), the magnitude of the parameter is smaller than the analogous results for the Pt isotopes. The behavior of the parameters and is reflective of the HFB PESs for Os and W nuclei being somewhat steeper in the degree of freedom compared to the Pt isotopes, as discussed in Ref. gradient-2 . The parameters in Figs. 2(c) and 2(d) (as well as their sum) behave similarly to those of Pt nuclei. For both =110,112 the sum is almost zero in Pt isotopes while it is small for Os and W ones, but has a negative sign. This indicates a weak prolate deformation in the latter as seen in Fig. 1. In other words, the -soft structure is rather sustained in these Pt isotopes, but it is not for the corresponding Os and W isotopes. As in Fig. 2(e), the scale parameter in the present case behaves similarly as for the Pt nuclei with about the same order of magnitude.
IV Calculation of the energy spectra and (E2) values
Using the derived parameters, we calculate excitation spectra and reduced E2 transition probabilities (E2). The Hamiltonian of Eq. (1) is diagonalized by using the code NPBOS npbos .
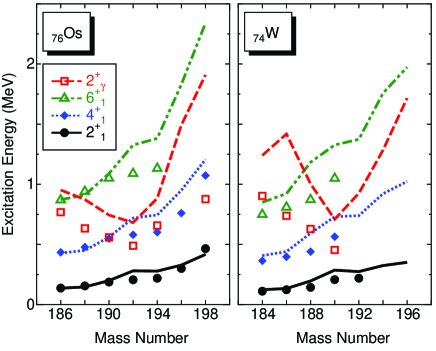
Figure 3 shows ground-state () band and the quasi--bandhead (denoted by ) energies for Os and W isotopes. In general, the calculated results follow the experimental trends reasonably well, particularly for energy. What is of interest in Fig. 3 is the behavior of the energy, exhibiting a kink for both 192Os and 190W. The experimental energy in 192Os is lower than the one. This is an evidence that the nucleus is the most -unstable one among other Os isotopes. The present calculation follows the trend for Os isotopes well, and predicts a similar one for W isotopes exhibiting, however, more rapid change as a function of . The location of the state for 196Os (192W) has not yet been fixed experimentally but the present calculations suggest that the state is lower than the one in both 196Os and 192W. The calculated energy is generally higher than the experimental one, whereas the qualitative feature of experimental level is reproduced well.
Now we turn to the analysis of (E2) systematics, relevant to the considered low-lying states. The (E2) value is given by
| (4) |
where and are the angular momenta for the initial and final states, respectively. The E2 transition operator is given by . Here and stand for the boson effective charges. These effective charges should be in principle determined not at the mean-field level, but rather by some treatment taking into account effects beyond the mean field, such as core polarization. This is, however, beyond the scope of the current framework and may need to be investigated in the future. In what follows, we assume , for simplicity, and discuss ratios of (E2)s rather than their absolute values and the quadrupole moments for the corresponding excited states. Note that the (E2) ratio at each dynamical symmetry limit, shown below, means the one with infinite boson number AI .
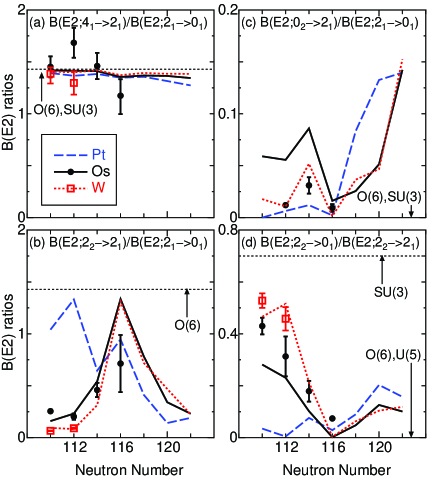
From Fig. 4(a), we observe that the ratio does not change much, being close to its O(6) limit of IBM (which is also the SU(3) limit of ). This trend persists for where there is currently no available data. The ratio , shown in Fig. 4(b), is of particular interest as one can observe a significant difference in its value for the Pt and Os-W isotopes. The magnitude of the ratio is arguably the most appropriate and sensitive fingerprint for softness nor . The values for both Pt and Os-W are relatively large and close to the O(6) limit () for , where the nuclei show notable instability. For Pt nuclei, this trend persists even for , while smaller values are suggested for Os and W nuclei. These differences between the Pt and Os-W chains reflect the difference in the topology of the PES. The results for Os nuclei follow the experimental trend, which increases for . The present calculation for Os nuclei suggests the decrease of the value for , which corresponds to a suppression of softness. The ratio in Fig. 4(c) generally has a predicted value which is rather small, being close to zero (corresponding to the O(6) and SU(3) limits), as compared to and values. Note that the scale of the vertical axis in Fig. 4(c) is different from those of Figs. 4(a) and 4(b). No rapid change with is seen for as in . Nevertheless, we should note the quantitative differences between the Pt and the Os-W nuclei. The branching ratio in Fig. 4(d) for Os follows the experimental trend for . The decrease of value from , close to (SU(3) limit), toward , close to zero (O(6) and U(5) limit), reflects the corresponding structural evolution. The value for the Pt chain is close to zero, while for the Os-W chains, there is a significant change at . For the W nuclei, the ratio increases more rapidly than for the Os chain from to 112. Earlier phenomenological studies suggested a similar increase DB_W .
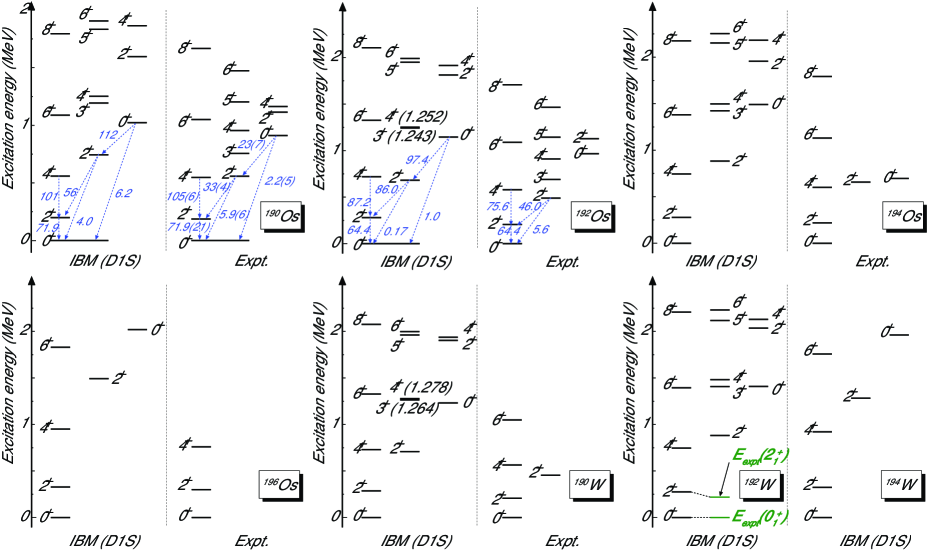
Finally, we present in Fig. 5 the level schemes corresponding to the neutron-rich nuclei 190,192,194,196Os and 190,192,194W taken as representative samples. For 190,192Os, for which there are significant experimental data, not only the band but also both the quasi--bandhead and the quasi--bandhead (denoted by ) energies are reproduced quite well by the current calculations, although the detailed ’in-band’ energy staggering looks different between the calculated and the experimental levels. The calculated (E2) values for 190,192Os have been normalized to the experimental BE2 (E2;) value. Some algebraic feature is also apparent in the calculated results. The rule for the E2 decay pattern at the O(6) limit AI , (i.e., the dominance of () over ()) in the present calculation also compares well with the experimental decay pattern.
The experimental value of the energy for 192Os is very close to that of its isotone 190W (i.e., 207 keV). Also, the excitations energies of the levels in these isotones are also quite similar to each other. The present calculations reproduce this overall trend well. In fact, the calculated (0.278) MeV and 0.286 (0.274) MeV for 192Os (194Os) and 190W (192W) nuclei, respectively. For 192Os and 190W nuclei, the calculated band energies are rather stretched, and the energies are in good agreement with the respective experimental data. In the calculated quasi- band of 190Os and 192Os nuclei, one observes a staggering as ( ) ( ), … etc.. By contrast, the experimental energy spacing shows a more regular pattern. This deviation may be related to the topology of the mapped IBM PES in Fig. 1, which is flat in direction, while the corresponding Gogny-D1S PES exhibits shallow triaxial minimum gradient-2 . In the future, some additional interaction term, such as a so-called cubic term cubic , may need to be introduced in the boson Hamiltonian to correct the deviation for detailed structure of quasi- band.
For 194,196Os nuclei, the predicted and energies reproduce the experimental ones. The quasi--bandhead energy for 194Os in the present calculation is notably larger than the experimental value, which is a consequence of the peculiar topology of the Gogny-HFB PES, which exhibit a pronounced oblate minimum with a relatively small deformation. This results in the larger value of the parameter than the one in the IBM phenomenology DB_W which would give good agreement for the excited energies. The positions of the and the energies for 196Os are predicted to lie below and beyond the level, respectively. For the exotic 192W and 194W nuclei, the present calculation suggests a quite similar level pattern to their respective isotones, 194Os and 196Os.
V Summary
To summarize, we have presented the predicted excitation spectra and (E2) ratios of exotic Os and W isotopes with . Spectroscopic calculations have been carried out in terms of the IBM Hamiltonian constructed by the constrained HFB calculations with Gogny-D1S EDF. We have examined the prolate-to-oblate shape/phase transition as functions of neutron number in the considered isotopic chains. The experimental trends of not only -band energies but also the quasi--bandhead energy for Os isotopes is reproduced well, suggesting that the nucleus is the softest in . A similar pattern is predicted in W isotopes, while the evolution of levels appears to occur more rapidly in W than in Os. Interestingly enough, all these results reflect to a good extent the results of the underlying microscopic Gogny-HFB calculations. Lastly, let us comment on the form of the boson Hamiltonian in Eq. (1). While this form may be rather simple, it determines the basic topology of the PES, and is supposed to be the most relevant for the description of the low-lying structure at the present stage. On the other hand, the IBM-2 phenomenology considers additional interaction terms as compared to those in Eq. (1). Some of these terms have a minor effect, but others might affect the spectroscopic results in quantitative details as suggested in the structure of quasi- bands in Fig. 5. It should be then very interesting to study in the future which parts of a more general boson Hamiltonian are crucial, as well as how they affect the spectroscopic properties quantitatively.
Acknowledgments
This work was support in part by grants-in-aid for Scientific Research (A) 20244022 and No. 217368, and by the JSPS Core-to-Core program EFES. Author K.N. is support by JSPS Fellowship program. PHR, ZP and PDS acknowledge financial support from STFC(UK). The work of authors L.M.R, P.S and R.R. has been supported by MICINN (Spain) under research grants FIS2008–01301, FPA2009-08958, and FIS2009-07277, as well as by Consolider-Ingenio 2010 Programs CPAN CSD2007-00042 and MULTIDARK CSD2009-00064. R.R. thanks Profs. P. M.Walker, J. Äysto and R.Julin for encouraging discussions.
References
- (1) A. Bohr and B. R. Mottelson, Nuclear Structure, (Benjamin, New York, 1969 and 1975), Vols. I and II.
- (2) P. Ring and P. Schuck, The Nuclear Many-Body Problem, (Springer, Berlin, 1980).
- (3) P. Cejnar, J. Jolie, and R. F. Casten, Rev. Mod. Phys. 82, 2155 (2010).
- (4) M. Bender, P.-H. Heenen, and P.-G. Reinhard, Rev. Mod. Phys. 75, 121 (2003).
- (5) T. H. R. Skyrme, Nucl. Phys. 9, 615 (1959).
- (6) D. Vautherin and D. M. Brink, Phys. Rev. C 5, 626 (1972).
- (7) J. Decharge, M. Girod, and D. Gogny, Phys. Lett. B 55, 361 (1975).
- (8) D. Vretenar, A. V. Afanasjev, G. A. Lalazissis, and P. Ring, Phys. Rep. 409, 101 (2005).
- (9) P. Bonche, J. Dobaczewski, H. Flocard, P. -H. Heenen, and J. Meyer, Nucl. Phys. A510, 466 (1990).
- (10) J.-P. Delaroche, M. Girod, L. Libert, H. Goutte, S. Hilaire, S. Peru, N. Pillet, and G. F. Bertsch, Phys. Rev. C 81, 014303 (2010).
- (11) Z. P. Li, T. Nikić, D. Vretenar, and J. Meng, Phys. Rev. C 81, 034316 (2010); Z. P. Li, T. Nikić, D. Vretenar, J. Meng, G. A. Lalazissis, and P. Ring, Phys. Rev. C 79, 054301 (2009).
- (12) A. Arima and F. Iachello, Phys. Rev. Lett. 35, 1069 (1975); F. Iachello and A. Arima, The interacting boson model, (Cambridge University Press, Cambridge, 1987).
- (13) T. Otsuka, A. Arima, F. Iachello, and I. Talmi, Phys. Lett. B 76, 139 (1978); T. Otsuka, A. Arima, and F. Iachello, Nucl. Phys. A309, 1 (1978).
- (14) T. Otsuka, Algebraic Approaches to Nuclear Structure, (Harwood, Chur, 1993), ed. by R.F. Casten, p. 195.
- (15) T. Mizusaki and T. Otsuka, Prog. Theor. Phys., Suppl. 125, 97 (1997).
- (16) K. Nomura, N. Shimizu, and T. Otsuka, Phys Rev. Lett. 101, 142501 (2008).
- (17) K. Nomura, N. Shimizu, and T. Otsuka, Phys Rev. C 81, 044307 (2010).
- (18) T. Shizuma et al., Eur. Phys. J. A 30, 391 (2006).
- (19) Zs. Podolyák et al., Phys. Lett. B 491, 225 (2000).
- (20) J. Jolie and A. Linnemann, Phys. Rev. C 68, 031301(R) (2003).
- (21) N. Alkhomashi et al., Phys. Rev. C 80, 064308 (2009)
- (22) P.H. Regan et al., Int.J.Mod.Phys. E17, Supplement 1, 8 (2008).
- (23) G.J. Lane et al., Phys. Rev. C 82, 051304 (2010).
- (24) C. Wheldon et al., Phys. Rev. C 63, 011304 (2001).
- (25) P.D. Bond, R.F. Casten, D.D. Warner, and D. Horn, Phys. Lett. B 130, 167 (1983).
- (26) P.D. Stevenson, M.P. Brine, Zs. Podolyák, P.H. Regan, P.M. Walker, and J. Rikovska Stone, Phys.Rev. C 72, 047303 (2005).
- (27) R. Rodríguez-Guzmán, P. Sarriguren, L. M. Robledo, and J. E. García-Ramos, Phys. Rev. C 81, 024310 (2010).
- (28) L. M. Robledo, R. Rodríguez-Guzmán, and P. Sarriguren, J. Phys. G: Nucl. Part. Phys. 36, 115104 (2009).
- (29) P. D. Duval, B. R. Barrett, Phys. Rev. C 23, 492 (1981).
- (30) K. Nomura, T. Otsuka, R. Rodríguez-Guzmán, L. M. Robledo, and P. Sarriguren, Phys. Rev C 83, 014309 (2011).
- (31) J. F. Berger, M. Girod, and D. Gogny, Nucl. Phys. A428, 23c (1984).
- (32) A. E. L. Dieperink, O. Scholten, and I. Iachello, Phys. Rev. Lett. 44, 1747 (1980).
- (33) G. Kaiser, A Friendly Guide to Wavelets (Boston, Birkhäser, 1994).
- (34) A. Arima and F. Iachello, Ann. Phys. (N.Y.) 111, 201 (1978).
- (35) K. Nomura, T. Otsuka, N. Shimizu, and L. Guo, arXiv:1011.1056.
- (36) T. Otsuka and N. Yoshida, JAERI-M report 85 (Japan Atomic Energy Research Institute, 1985).
- (37) Zs. Podolyák et al., Phys. Rev. C 79, 031305 (2009).
-
(38)
Brookhaven National Nuclear Data Center (NNDC)
http://www.nndc.bnl.gov/. -
(39)
C. M. Baglin, Nuclear Data Sheets 111, 275 (2010);
C. M. Baglin, Nuclear Data Sheets 99, 1 (2003);
B. Singh, Nuclear Data Sheets 95, 387 (2002);
B. Singh, Nuclear Data Sheets 99, 275 (2003);
C. M. Baglin, Nuclear Data Sheets 84, 717 (1998);
B. Singh, Nuclear Data Sheets 107, 1531 (2006);
H. Xiaolong, Nuclear Data Sheets 108, 1093 (2007);
H. Xiaolong, Nuclear Data Sheets 110, 2533 (2007). - (40) K. Heyde, P. Van Isacker, M. Waroquier, and J. Moreau, Phys. Rev. C 29, 1420 (1984).