the coronal convection
Abstract
We study the hydrogen Lyman emission in various solar features – now including Ly- observations free from geocoronal absorption – and investigate statistically the imprint of flows and of the magnetic field on the line profile and radiance distribution. As a new result, we found that in Ly- rasters locations with higher opacity cluster in the cell interior, while the network has a trend to flatter profiles. Even deeper self reversals and larger peak distances were found in coronal hole spectra. We also compare simultaneous Ly- and Ly- profiles. There is an obvious correspondence between asymmetry and redshift for both lines, but, most surprisingly, the asymmetries of Ly- and Ly- are opposite. We conclude that in both cases downflows determine the line profile, in case of Ly- by absorption and in the case of Ly- by emission. Our results show that the magnetically structured atmosphere plays a dominating role in the line formation and indicate the presence of a persisting downflow at both footpoints of closed loops. We claim that this is the manifestation of a fundamental mass transportation process, which Foukal back in 1978 introduced as the ’coronal convection’.
keywords:
mass transport - chromosphere - line profile - Lyman alpha1 Introduction
The basic idea of this communication is to show that the well-known net redshift of transition region (TR) emission and the new observations of the Ly- and Ly- profiles obtained by SOHO-SUMER are different manifestations of the same fundamental massflow process.
It is known since long that in TR emission all lines appear with a net redshift, which peaks at a temperature around log /K=5 (e.g., Brekke 1997). Dammasch et al. (2008) have demonstrated that this redshift can be explained by the fact that closed loops higher up in the TR have both footpoints redshifted. Such coronal downflows have also been reported by Hinode (Tripathi 2009, del Zanna 2008). Already 30 years ago Foukal (1978) mentioned such flows and introduced the term ’Coronal Convection’. The common understanding of these observations is that in TR loops that are closed, material is draining down on both sides. Near their footpoints, the loops are not only redshifted, but they are also brighter than elsewhere, and this brightness-to-redshift relationship easily explains the net redshift of TR emission and the redshift in the network contrast (Curdt et al. 2008a). We show that clear signatures of dynamical processes are also seen in the optically thick lines of the hydrogen Lyman series.
2 Recent Ly- observations
The entire Lyman series and the long-wavelength portion of the hydrogen recombination continuum fall into the spectral range of the SUMER spectrometer. Ly- – by far the most important line and carrying 75 % of the spectral radiance in this range – plays an important role for the radiative energy transport in the solar atmosphere. Despite of this importance, however, such observations were not completed, because the bright Ly- line would saturate the detector. Recently the SUMER team started unconventional observations, where 80 % of the aperture is vignetted by the partially closed door. Several of these rasters were completed at various angles in summer 2008, when the Sun was very quiet. In April 2009 also coronal hole (CH) data was obtained. Later on, prominence, filament and sunspot targets were selected. In some of the rasters, the wavelength setting was within 23.3 s switched back and forth between Ly- and Ly-, thus allowing quasi-simultaneous exposures for those lines (for observational details see Curdt et al. 2008b, 2010a, 2010b, Tian et al. 2009a, 2009b). Some of the results that are relevant for our topic are described below.
2.1 How Flows Affect the Profiles of Ly- and Ly-
In all exposures we also recorded a TR line as line-of-sight (LOS) velocity indicator. In the case of Ly-, the Doppler flow in each pixel has been determined by the shift of the 1206 Si iii line centroid.
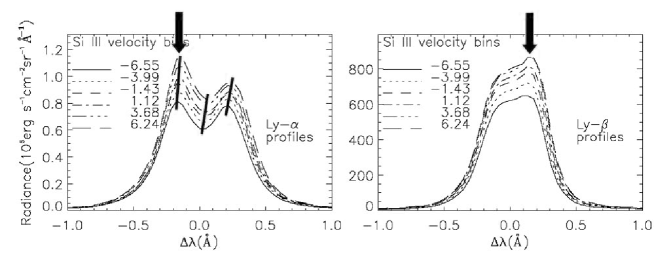
We sort the Ly- profiles by the Doppler flow in each pixel and define six equally spaced velocity bins. The different profiles of each bin are displayed in Fig. 1a. There is an obvious and remarkable result: The blue horn is always stronger than the red horn, and the asymmetry increases significantly with the redshift. Both peaks and the central reversal are offset towards the red with increasing downflow, as indicated by tracing lines. Similarly, we display in Fig. 1b the profiles of Ly-. Also for Ly- there is an obvious correspondence between asymmetry and redshift and between asymmetry and radiance. But most surprisingly the asymmetries of Ly- and Ly- are reversed. It is well known that higher order Lyman lines become more optically thin. Our results clearly show that the trend towards self-reversed, red-horn dominated profiles is discontinued for Ly-. Interestingly, this has already been noticed three decades ago in OSO 8 data (Gouttebroze et al. 1978). They clearly show in their Fig. 1 the red-horn dominance in Ly- and the blue-horn dominance of Ly-. But they don’t give any explanation other than: ’The asymmetries are variable with time and location and are probably related to large-scale motions of the atmosphere.’ We now arrived at a heuristic model to explain the opposite asymmetries, where downflows and opacity are dominating the profile, but play a different role.
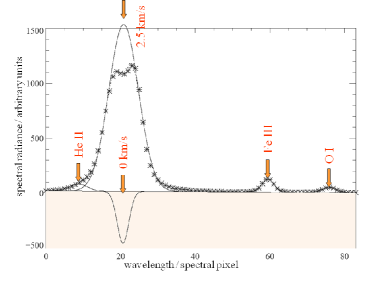
Both lines are optically thick, but the opacity in Ly is much less than that in Ly. In Fig. 2 we show the average line profile of several chromospheric lines around Ly- obtained in a quiet Sun (QS) location. We adopted the wavelength values of the SUMER spectral atlas (Curdt et al. 2001) and completed a precision 5-component multigaussfit, assuming a negative Gaussian to account for the absorption. The fit with the least errors was achieved, if we assume the absorption to occur at zero velocity and the full curve at a redshift of 2 to 3 km/s relative to this. This suggests that Ly- (and the higher-order Lyman lines) still behave like typical TR lines, even in Ly- the redshifted footpoints are shining through. For Ly- things change, the opacity of Ly is so high, that any directional information is lost at because of the partial redistribution process. In contrast to Ly and all the higher Lyman lines, which are still dominated by redshifted emission (which narrows the blue peak), Ly is dominated by redshifted absorption (which suppresses the red peak). Below we will give additional proof for this interpretation.
2.2 How the Magnetic Field Affects the Profiles of Ly-
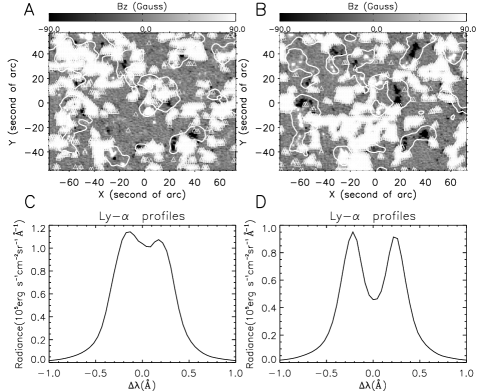
In Fig. 3 we show a MDI magnetogram of a QS area near disk center The overlaid contours indicate enhanced Ly- radiance and show the top-25 % level. Here we sort the profiles by the relative depth of their self-reversal. In panel A we marked pixels out of the bottom-25 % regime, areas with flatter profiles (reduced opacity) obviously cluster along the network lane. In contrast, pixels from the top-25 % regime - shown in panel B - cluster in the cell interior. This suggests a lower opacity above the magnetic network as compared to the low-lying loops in the cell interior. We assume that in the network magnetic loops open into over-arching structures, while the cell interiors are filled with low-lying loops. Less self-reversed profiles cluster along the network boundary, here the expanding magnetic field forms funnel-like structures with reduced opacity. In other words, chromosphere and transition region are extended above the network.
2.3 Lyman Emission in Coronal Holes
The arguments raised so far imply that in CHs the effects should be even more expressed. Indeed, in the CH we found the largest peak separation in the Ly- profile and the deepest self-reversals in the Ly- profile, in both cases indication of extremely high opacity (cf., Tian et al. 2009b).
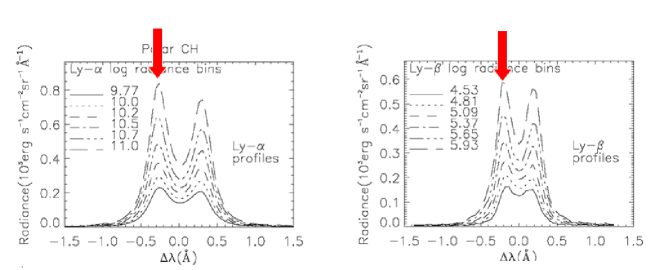
In Fig. 4 we show the profiles of Ly- (left panel) and of Ly- as observed in a polar CH. It is most interesting that the Ly- profiles in the polar CH have a blue peak dominance similar to Ly-. Xia (2003) mentioned indications of such a behaviour in equatorial CHs. In our work we find very clearly that most Ly- profiles are stronger in the blue peak in the polar CH. Ly- now starts to behave like Ly-, and this in line with the argument used before and proves that our interpretation is consistent. This difference in behaviour suggests that the CH is void of overarching loops. Here, the chromosphere is filled everywhere with low-lying loops, that are observed at an orthogonal view.
3 Red and Blue Branch of the Coronal Convection
In the previous sections we have shown the signature of downflows in optically thin and in optically thick lines and that there is evidence for persistent downflows in closed loops. In Foukal’s notion this would be the ’red branch’ of the coronal convection. The blue branch is less clear. There is evidence for continuous upflow in magnetically open structures from the spectrometers on SOHO and Hinode. Here, we refer to the work of Wiegelmann et al. (2005). In their Fig. 2 (not reproduced here) open field lines are shown in brown, closed ones in yellow. Indeed a correlation exists between plasma outflow (shown in blue) and places with open field lines., indicative of a quasi-continuous process that is guided by magnetic field lines (Marsch et al. 2008). Also transient scenarios like jets or spicular activity have been suggested by the community to be responsible for the material upflow. This is not necessary in contradiction with the open-fieldline approach. But at this time a clear answer can not be given.

4 Ly- profiles and magnetic field orientation
Gunár et al. (2008) claim that the orientation of a prominence axis relative to the LOS has an imprint on the self-reversal depth of Ly-, such that the reversal is deeper, when the magnetic field is oriented vertical to the LOS. The theoretical work is based on Heinzel et al. (2001, 2005). And observational evidence has recently been reported by Schmieder et al. (2007) and Curdt et al. (2010a).
We correlated the LOS-component of the extrapolated magnetic field in a QS area at different coronal heights versus the reversal depth the Ly- profile. Fig. 5 shows a small, but clear anti-correlation, which has its minimum around 6 Mm. This suggests that the orientation of the magnetic field relative to the LOS has an imprint on the source function and plays an important role not only in a prominence, but does it everywhere.
5 Conclusion
Despite the importance of Ly- for radiative transport and many other processes in the solar atmosphere, there is a clear disproportion if one compares Ly- focussed articles to publications on optically thin lines. We presented a set of empirical results, which we managed to explain in a consistent manner and which resulted into a heuristic model, where opacity effects and large-scale flows are the main elements. We now started quantitative work along our heuristic model.
References
-
Brekke, P., Hassler, D. M., Wilhelm, K.: 1997, 175, 349.
-
Curdt, W. et al.: 2001, 375, 591.
-
Curdt, W., Tian, H., Teriaca, L., Schühle, U.: 2010a, 511, L4.
-
Curdt, W., Tian, H., B.N. Dwivedi, Marsch, E.: 2008a, 491, L13.
-
Curdt, W., Tian, H., Teriaca, L., Schühle, U., Lemaire, P.: 2008b, 492, L9.
-
Curdt, W., Tian, H.: 2010b, 428, 81.
-
Dammasch, I.E., Curdt, W., Dwivedi, B.N., Parenti, S.: 2008, 26, 2955.
-
del Zanna, G.: 2008, 481 L49.
-
Foukal, P.: 1978, 223, 1046.
-
Gouttebroze, P., Lemaire, P., Vial, J.-C., Artzner, G.: 1978, 225, 655.
-
Gunár, S., Heinzel, P., Anzer, U., Schmieder, B.: 2008, 490, 307.
-
Heinzel, P., Anzer, U.: 2001, 375, 1082.
-
Heinzel, P., Anzer, U., Gunár, S.: 2005, 442, 331.
-
Marsch, E., Tian, H., Sun, J., Curdt, W., Wiegelmann, T.: 2008, 685, 1262.
-
Schmieder. B., Gunár, S., Heinzel, P., Anzer, U.: 2007, 241, 53.
-
Tian, H., Curdt, W., Marsch, E., Schühle, U.: 2009a, 504, 239.
-
Tian, H., Teriaca, L., Curdt, W., Vial, J.-C.: 2009b, 703, L152.
-
Tripathi, D., Mason, H.E., Dwivedi, B.N., del Zanna, G.: 2009, 694, 1256.
-
Wiegelmann, T., Xia, L.-D., Marsch, E.: 2005, 432, L1.
-
Xia, L.-D.: 2003, , Georg-August-Universität Göttingen.