Cepheid investigations using the Kepler space telescope
Abstract
We report results of initial work done on selected candidate Cepheids to be observed with the Kepler space telescope. Prior to the launch 40 candidates were selected from previous surveys and databases. The analysis of the first 322 days of Kepler photometry, and recent ground-based follow-up multicolour photometry and spectroscopy allowed us to confirm that one of these stars, V1154 Cyg (KIC 7548061), is indeed a 4.9-d Cepheid. Using the phase lag method we show that this star pulsates in the fundamental mode. New radial velocity data are consistent with previous measurements, suggesting that a long-period binary component is unlikely. No evidence is seen in the ultra-precise, nearly uninterrupted Kepler photometry for nonradial or stochastically excited modes at the micromagnitude level. The other candidates are not Cepheids but an interesting mix of possible spotted stars, eclipsing systems and flare stars.
keywords:
stars: oscillations – stars: variables: Cepheids1 Introduction
The Kepler111http://kepler.nasa.gov space mission is designed to detect Earth-like planets around solar-type stars with the transit method (Borucki et al., 2010) by monitoring continuously over 150 000 stars with an unprecedented photometric precision. The lifetime of at least 3.5 years and the quasi-continuous observations make Kepler an ideal tool to measure stellar photometric variability with a precision that is unachievable from the ground (see, e.g. Gilliland et al. 2010a).
Ground-based photometric observations of Cepheids usually consist of a few (typically one or two) observations per night. Until now it has not been possible to adequately cover many consecutive pulsational cycles with ground-based photometry. Ground-based studies of several types of variable stars – such as Sct stars, DOV, DBV and DAV white dwarfs, sdBV stars and roAp stars – have benefited from multisite photometric observations. But because of their longer period, Cepheids have not been the targets of such concerted efforts, with the notable exception of V473 Lyr (Burki et al., 1986).
Space-based Cepheid observations were conducted earlier with the star tracker of the WIRE satellite and the Solar Mass Ejection Imager (SMEI) instrument on board the Coriolis satellite (Bruntt et al., 2008; Spreckley & Stevens, 2008; Berdnikov, 2010). The lengths of these data sets ( d) are comparable to the nominal lifetime of the Kepler Mission. The WIRE and SMEI data of Polaris ( UMi, ) confirmed that the pulsation amplitude of Polaris has been increasing again, after a long period of decrease. Kepler is capable of delivering comparably accurate photometric observations for the much fainter Cepheid, V1154 Cyg ().
The Kepler Asteroseismic Science Consortium kasc222http://astro.phys.au.dk/KASC/ was set up to exploit the Kepler data for studying stellar pulsations. kasc working group number 7 (WG7) is dedicated to the investigation of Cepheids. In compliance with one of the original kasc proposals submitted before the launch of the space telescope, we searched for Cepheids among a list of 40 targets, including the only previously known Cepheid V1154 Cyg (KIC 7548061) in the field. In this paper we describe the first results from Kepler observations of a Cepheid and a couple of not confirmed Cepheids, complemented by extended ground-based follow-up observations.
| KIC ID | Other name | Period | Contam. | Runs | |||
|---|---|---|---|---|---|---|---|
| J2000 | J2000 | mag | days | Index | |||
| 7548061 | V1154 Cyg | 19 48 15.45 | +43 07 36.77 | 8.771 | 4.925454(1) | 0.036 | LC: Q01234 SC: Q1 |
| 2968811 | ASAS 190148+3807.0 | 19 01 48.21 | +38 07 01.99 | 13.469 | 14.8854(12) | 0.047 | LC: Q01234 |
| 6437385 | ASAS 192000+4149.1 | 19 20 00.12 | +41 49 07.46 | 11.539 | 13.6047(7) | 0.075 | LC: Q01234 |
| 8022670 | V2279 Cyg | 19 18 54.46 | +43 49 25.82 | 12.471 | 4.12564(5) | 0.189 | LC: Q1234 |
| 12406908 | ROTSE1 | 19 23 44.99 | +51 16 11.75 | 12.354 | 13.3503(45) | 0.015 | LC: Q01 SC: Q3.1 |
| J192344.95+511611.8 |
2 Target selection
Being supergiants, Cepheids are rare and the number of Cepheids in the Kepler fixed 105 square degree field of view (FOV) is expected to be low. Due to telemetry bandwidth constraints, Kepler cannot observe all stars in the field. The first 10 months of operation (observing quarters Q0–Q4) were therefore dedicated to a survey phase to find the best candidates, which would then be observed during the rest of the mission.
We used two different approaches to find Cepheid candidates for the survey phase. First, all known, possible or suspected variable stars in the relevant pulsational period range were selected from all available databases containing variability information, such as GCVS (Samus et al., 2002), ASAS North (Pigulski et al., 2009), ROTSE (Akerlof et al., 2000) and HAT catalogs (Hartman et al., 2004). Light curve shapes and the vs. diagram (Pojmanski & Maciejewski, 2004) were also utilized for further selection. Finally, stars with close (bright) companions were excluded. This procedure resulted in a list of 26 stars. We note that these catalogs are not complete in coverage of the field, nor in the relevant magnitude range.
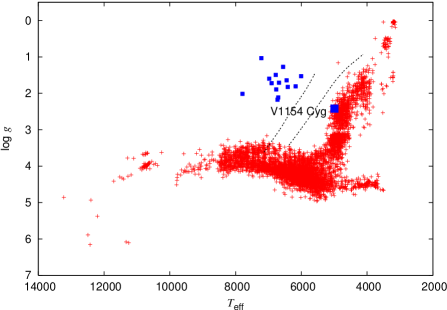
As a second approach, we searched for stars lying inside or close to the Cepheid instability strip based on the Kepler Input Catalog (KIC)333http://archive.stsci.edu/kepler effective temperature and values. Stars fainter than mag were excluded, where denotes the Kepler magnitude system (see Section 3. for more details on the Kepler magnitudes). Candidates with a contamination index (CI) larger than 0.5 were also omitted, where means that all the flux in the aperture comes from the target and in case of the flux entirely comes from surrounding sources. This resulted in 14 additional targets as shown in Fig. 1. The linear Cepheid instability strip, denoted by dashed lines in the figure, was calculated with the Florida-Budapest code (Szabó et al., 2007).
We note that the process followed to derive the KIC parameters was optimized to find main-sequence stars with high probability and to distinguish them from cool giants (Batalha et al., 2010). The precision of the parameters is therefore limited for our purposes. This is illustrated in Fig. 1 by the fact the KIC parameters of V1154 Cyg (the only previously known Cepheid in the field) put it outside the computed instability strip by several hundred Kelvins.
Consequently, we proposed to observe the above mentioned 40 stars by Kepler during the ‘survey period’.
3 Kepler observations
Kepler was launched on 2009 March 6 into a 372-d solar orbit, and is observing a 105 square degree area of the sky in between the constellations of Cygnus and Lyra (Koch et al., 2010). After a 9.7 d commissioning phase (Q0), the regular observations started on 2009 May 12. In order to ensure optimal solar illumination of the solar panels, a 90 degree roll of the telescope is performed at the end of each quarter of its solar orbit. The first quarter lasted only for 33.5 d (Q1), while subsequent quarters are all three months long. In each of the four quarters annually the Kepler targets fall on different CCDs.
The Kepler magnitude system () refers to the wide passband ( nm) transmission of the telescope and detector system. Note that the Kepler magnitudes () were derived before the mission launch and are only approximate values. Currently Kepler processing does not provide calibrated Kepler magnitudes (Kolenberg et al., 2010). Both long cadence (LC, 29.4 min, Jenkins et al. 2010), and short cadence (SC, 58.9 s, Gilliland et al. 2010b) observations are based on the same -s integrations which are summed to form the LC and SC data onboard. In this work we use BJD-corrected, raw LC data (Jenkins et al., 2010) spanning from Q0 to Q4, i.e. 321.7 d of quasi-continuous observations. Some of our targets (V1154 Cyg among them) were observed in SC mode as well. We exploit this opportunity to compare LC and SC characteristics and investigate the frequency spectrum to a much higher Nyquist frequency (733.4 d-1 vs. 24.5 d-1).
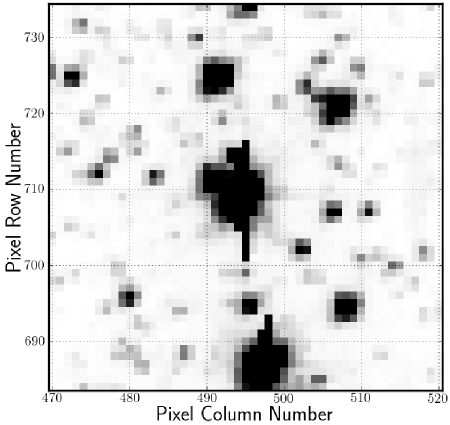
The saturation limit is between mag depending on the particular chip the star is observed; brighter than this, accurate photometry can be performed up to mag with judiciously designed apertures (Szabó et al., 2010). Since V1154 Cyg is much brighter than the saturation limit, it required special treatment, as can be seen in Fig. 2, which shows a 50 pixel box centered on V1154 Cyg. The plot was made using keplerffi444http://keplergo.arc.nasa.gov/ContributedSoftwareKeplerFFI.shtml written by M. Still.
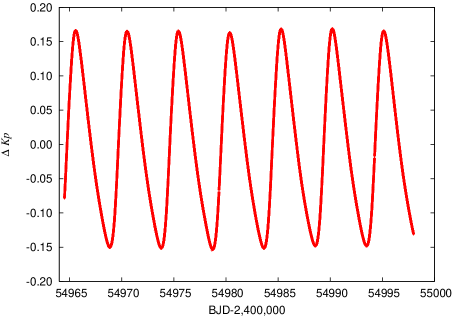
To illustrate some of the common characteristics of the data we show in Fig. 3 the raw Kepler light curve of V1154 Cyg after normalizing the raw flux counts and converting the fluxes to the magnitude scale. The small gaps in the light curve are due to unplanned safe mode and loss-of-fine-point events, as well as regular data downlink periods. This LC data set spanning Q0–Q4 data contains 14485 points. Fig. 4 shows a 33.5 d segment (Q1) where SC data are available for V1154 Cyg containing 49032 data points.
The varying amplitude seen in Fig. 3 is of instrumental origin. It is a result of the small drift of the telescope, coupled with different pixel sensitivities. In addition, different aperture masks are assigned to the targets quarterly which result in small changes in the measured flux. The most notable amplitude change is seen towards the end of Q2, which was noted to be due to flux flowing outside of the optimal aperture (bleeding), affecting the measured brightness. Fortunately, in Q2 a larger mask was also downloaded besides the standard optimal aperture assigned to this star which allowed us to investigate the variation of flux outside the optimal aperture. This confirmed that the total flux was indeed captured within the larger aperture, and hence that the star shows no intrinsic amplitude variation within the current accuracy of the data. Without further information we cannot choose between a possible slight amplitude variation and instrumental effects in other quarters.

4 Target classification
After the release of the first Kepler light curves to the kasc it turned out that only a few stars showed Cepheid like variability. The properties of these Kepler Cepheid candidates are listed in Table 1. Periods were determined for the Kepler LC light curves using the period04 program (Lenz & Breger, 2005).
Apart from these candidates a number of other variable stars were included in the initial sample of 40 stars. Based on their light curves and the automatic classification (Blomme et al., 2010) we classify these as eclipsing binaries (8 stars), ellipsoidal variables (6), delta Scuti stars (3), an SPB star (1), long period variables (7) and stars with no obvious variations (7). While this sample is a rich source of flaring, spotted, granulated stars, the detailed investigation of these non-Cepheids is out of scope of this paper. In addition, we inspected all 6300 kasc light curves, but found no Cepheids among them.
Three originally proposed stars were not observed due to technical reasons (position on the CCD chip, brightness/faintness, contamination or pixel number constraints). The large variety of non-Cepheids in our sample indicates that the spatial resolution and photometric accuracy of ASAS was not adequate to select such relatively faint Cepheids. It further shows that the Kepler Input Catalog is clearly not optimal for our purpose.
5 Ground-based follow up
To further confirm or disprove the Cepheid nature of our candidates in Table 1 we employed ground-based multicolour photometry and in some cases spectroscopy. In the case of V1154 Cyg regular radial velocity observations and multicolour photometry were scheduled, which helped us to gain more information on the pulsation. In the following we describe these ground-based follow-up observations and the subsequent scrutinizing classification process on a star-by-star basis.
5.1 Multicolour photometry
Ground-based multicolour observations provide additional information, therefore complement the space-born photometry taken in ‘white light’. We used the following telescopes to gather Johnson-Cousins magnitudes:
-
1.
Lulin One-meter Telescope (LOT) at Lulin Observatory (Taiwan)555http://www.lulin.ncu.edu.tw/english/index.htm: 1-m Cassegrain-telescope with PI1300B CCD;
-
2.
SLT at Lulin Observatory (Taiwan): 0.4-m RC-telescope with Apogee U9000 CCD;
-
3.
Tenagra telescope at Tenagra II Observatory666http://www.tenagraobservatories.com (USA): robotic 0.8-m RC-telescope with SITe CCD;
-
4.
Sonoita Research Observatory (SRO, USA)777http://www.sonoitaobservatories.org, 0.35-m robotic telescope with a SBIG STL-1001E CCD.
Observations were performed from September 2009 to August 2010. All of the imaging data were reduced in a standard way (bias-subtracted, dark-subtracted and flat-fielded) using iraf888iraf is distributed by the National Optical Astronomy Observatories, which are operated by the Association of Universities for Research in Astronomy, Inc., under cooperative agreement with the National Science Foundation.. Instrumental magnitudes for the stars in the images were measured using SExtractor (Bertin & Arnouts, 1996) with aperture photometry. For the SRO data a separate photometric pipeline based on daophot was used, which included analysis of an ensemble of comparison stars. The instrumental magnitudes were transformed to the standard magnitudes using Landolt standards (Landolt, 2009). Times of observation were converted to heliocentric Julian day.
We gathered between 80 and 120 frames per target for each passband, excluding KIC 12406908 which was observed only at TNG and hence had fewer images taken. We have found a small offset between SRO and other data in the case of V1154 Cyg. Fortunately, data were taken in TNG and SRO very close in time (less than 1 minute) twice, allowing us to correct the SRO data by the shift measured in these epochs: . All the (corrected) photometric measurements are available online, while Table 2 shows the layout of the data.
| KIC ID | HJD | Mag. | Err. | Filt. | Obs. |
|---|---|---|---|---|---|
| 02968811 | 2455103.7700 | 14.857 | 0.013 | B | SRO |
| 02968811 | 2455103.7809 | 14.823 | 0.013 | B | SRO |
| 02968811 | 2455104.7544 | 14.797 | 0.011 | B | SRO |
| … | … | … | … | … | … |
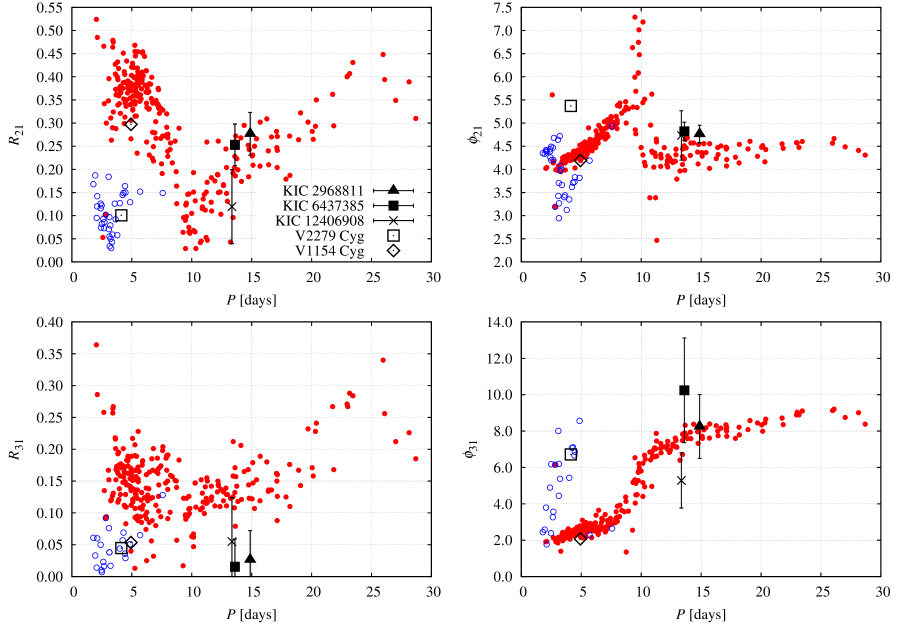
We decomposed the multicolour light curves to derive the widely used Fourier parameters and , as defined by Simon & Lee (1981), which characterize the light curve shape. The Johnson results are plotted in Fig. 5 along with the Fourier parameters of fundamental mode (red filled points) and first overtone (blue open circles) Galactic Cepheids as a function of pulsational period. As all Galactic Cepheids follow the main Fourier progressions in Fig. 5, a star that lies outside the overall pattern is unlikely to be Cepheid. We discuss our findings for individual candidates below.
5.2 Spectroscopy
Spectroscopic observations were conducted to measure radial velocity and derive stellar parameters. We obtained spectra of V1154 Cyg with the Coude-Echelle spectrograph attached to the 2-m telescope of the Thüringer Landessternwarte (TLS) Tautenburg. Spectra cover the region nm, the spectral resolution is , the exposure time was 30 min per spectrum. Spectra were reduced using standard midas packages. The reduction included the removal of cosmic rays, bias and stray light subtraction, flat fielding, optimum order extraction, wavelength calibration using a Th-Ar lamp, normalization to the local continuum, and merging of the orders. Small instrumental shifts were corrected by an additional calibration using a larger number of telluric O2 lines. In addition, one spectrum of V1154 Cyg was taken on 2007 June 15 at the M. G. Fracastoro station (Serra La Nave, Mt. Etna) of the INAF - Osservatorio Astrofisico di Catania (INAF-OACt). We used the 91-cm telescope and fresco, the fiber-fed reosc echelle spectrograph which allowed us to obtain spectra in the range of Å with a resolution .
For V2279 Cyg we made a high-resolution spectrum in a single-shot 1680 s exposure with the 1.5-m telescope at the Fred Lawrence Whipple Observatory (Mt. Hopkins, Arizona) using the Tillinghast Reflection Echelle Spectrograph (TRES) on 2010 September 24. The spectrum is cross-dispersed with a wavelength range of Å over 51 spectral orders.
5.3 Remarks on individual candidates
In the following we summarize the Kepler light curve characteristics, the multicolour photometry, the Fourier parameters and the spectroscopic properties of the four Cepheid candidates (see Table 1), before moving to the previously known Cepheid (V1154 Cyg) in Sect. 6.
KIC 2968811 = ASAS 190148+3807.0 ( d). In principle the light curve shape matches all the Fourier parameter progressions within the uncertainty, although in the case of and it is a border line case (Fig. 5). The amplitude is 0.19 mag in the Kepler passband. ‘Shoulders’ or bumps appear on the descending branch (Fig. 6, upper left panel), but they are not present at the beginning of the observations. This effect is frequently seen in spotted stars. The same effect may cause the larger scatter of the folded ground-based multicolour light curves in the first panel of Fig. 7. We note that in the case of a Cepheid in this period range the bump should be present on the ascending branch. By carefully examining the short brightening seen in the Kepler light curve we exclude instrumental or other external origin based on known artifacts discussed in the Kepler Data Release Notes999http://archive.stsci.edu/kepler/data_release.html. Taking into account the strong flare events (Fig. 6), we conclude that this object is definitely not a Cepheid.
KIC 6437385 = ASAS 192000+4149.1 ( d). This star shows a similar light curve to KIC 2968811 with an amplitude of mag (Fig. 6 upper right panel). Within the uncertainty the Fourier parameters matches the progressions, but does not. The phases are close to the phases of the bulk of the Galactic Cepheids (Fig. 5). The amplitude is smaller than the amplitude measured in as shown in Fig. 7, this is inconsistent with the Cepheid classification. The light variation shows the same shoulders on the descending branch as in the case of KIC 2968811, while its amplitude and shape are changing throughout the more than 300 d long Kepler observations. In addition, several flares can be seen that are intrinsic to the star. One is shown in Fig. 6. Thus, KIC 6437385 is most probably not a Cepheid.
KIC 12406908 = ROTSE1 J192344.95+511611.8 ( d). Interestingly, this variable star exhibits very similar light curve characteristics to the previously discussed objects (Fig. 6, bottom right panel). It has an amplitude of 0.3 mag in the Kepler passband. We have too few data points from ground-based observations to put strong constraints on the Fourier parameters, but despite the large uncertainties this object seems to be slightly off the main location expected for Cepheids (Fig. 5). The ratio of and amplitudes is , which is close to, but slightly larger, than the standard . The SC light curves show small short-duration flares at BJD 2 455 106.1 and 2 455 110.6, and a large one at BJD 2 455 118.2 which showed a complex, multi-peaked maximum lasting for 7 h. We note that a few outliers were removed from the Kepler light curve, which however does not influence our conclusions. Based on the observed features we can safely exclude this star from our Cepheid sample.
KIC 8022670 = V2279 Cyg ( d). Based on the space and ground-based follow-up observations this star is a strong Cepheid candidate. We therefore looked into the literature for a more rigorous assessment of whether Cepheid pulsation is the cause of the observed variability. Variability of this star was revealed by Dahlmark (2000) during a photographic search for variable stars, and independently by Akerlof et al. (2000) as a result of the ROTSE project. While Akerlof et al. (2000) classified the star as a Cepheid with a period of 4.12298 d, Dahlmark (2000) interpreted it as an RS CVn type variable due to its proximity to a known X-ray source detected by the ROSAT mission (Voges et al., 1999). This object, ROTSE J191853.61+434930.0 = LD 349, was finally designated as V2279 Cyg among the variable stars (Kazarovets et al., 2003).
We first looked at ROTSE-I photometric data retrieved from the NSVS data base (Woźniak et al., 2004), but conclude that this data set does not allow us to unambiguously classify the star. A dedicated photometric project to select Type II Cepheids among the ROTSE-I targets was performed by Schmidt et al. (2007). Based on their two-colour (, ) photometry they concluded that V2279 Cyg is a probable Cepheid with a period of 4.117 d. More recently, the photometric survey by Pigulski et al. (2009) resulted in useful data for following the period changes of this star. Additional photometric data are also available from the SuperWASP public archive101010http://www.wasp.le.ac.uk/public/index.php and the Scientific Archive of the Optical Monitoring Camera (OMC) on board INTEGRAL111111http://sdc.laeff.inta.es/omc/index.jsp. Both these archives contain data obtained in a single photometric band, and we used these data to investigate the period behaviour of V2279 Cyg.
The Kepler light curve of V2279 Cyg seems stable, without any noticeable light curve changes (part of the Q2 light curve is plotted in Fig. 6). We only see long term variations similar in amplitude to what we noted for V1154 Cyg (Fig. 3), which in this case might also just be instrumental effects. What makes V2279 Cyg particularly suspicious is the presence of many flares, one of them is clearly seen at BJD 2 455 030.0 in Fig. 6. The (almost) strictly periodic variations and the value of the period is consistent with a rotational modulation.
Multicolour photometry can be decisive in solving this classification problem because Cepheids have characteristic amplitude ratios. Our new photometric data suggest that V2279 Cyg is not a Cepheid. The amplitude of its brightness variation in is only slightly smaller than the amplitude in the band: the ratio is about 0.9 instead of the usual value of (Klagyivik & Szabados, 2009). Although a bright blue companion star is able to suppress the observable amplitude of the light variations in the band, the observed amplitude ratio is incompatible with the Cepheid nature even if the star had a very hot companion. , and place it among the first overtone objects, but is very different from both fundamental and first overtone progressions (Fig. 5).


In a next step we analyze the cycle-to-cycle variations in the periodicity using the so-called diagram. The diagram constructed for the moments of brightness maxima is plotted in the top panel of Fig. 8. The zero epoch was arbitrarily chosen at the first maximum in the Kepler data set. A least squares fit to the residuals resulted in the best fitting period of 4.125642 d, which is somewhat longer than any formerly published value for V2279 Cyg. We then included all ground-based observations we could find to construct a new diagram using the ephemeris
.
Table 3 contains the moments of maxima, the corresponding epochs and the residuals of the available observations. We assigned different weights to data from different sources. These weights (between 1 and 5) correspond to the ‘goodness’ of the seasonal light curve, larger number means better coverage and smaller scatter (for Kepler data W=5). The period of V2279 Cyg show large fluctuations during the last decade (see the lower panel of Fig. 8). Our additional ground-based photometric data indicate a very recent change in the period that we will investigate using future quarters of Kepler data. We note that the star has a high contamination index (Table 1), indicating that the 18 percent of the measured flux comes form other sources.
| JD⊙ | E | W | Reference | |
| 2 400 000 | [d] | |||
| 51474.9729 | 843 | 1.7218 | 2 | NSVS |
| 52626.3311 | 564 | 1.4177 | 1 | Integral OMC |
| 53051.2057 | 461 | 1.4842 | 3 | Schmidt et al. |
| 53368.6341 | 384 | 1.7304 | 1 | Schmidt et al. |
| 54265.3816 | 191 | 1.2317 | 1 | SWASP |
| 54645.2207 | 75 | 0.0030 | 1 | SWASP |
| 54954.6214 | 0 | 0.0105 | 5 | Kepler |
| … | … | … | … | … |
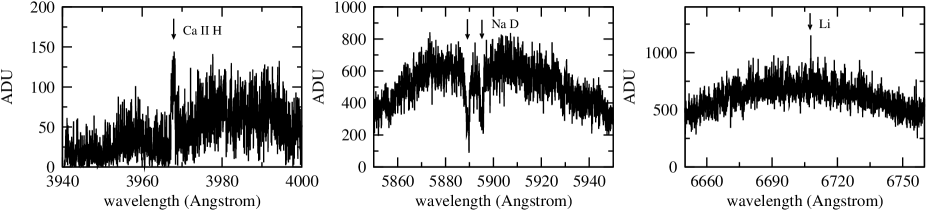
The spectrum of V2279 Cyg offers the clearest evidence that this star has been misclassified as a Cepheid. We have plotted three segments of the spectrum taken with the tres spectrograph in Fig. 9 containing these lines: Ca ii H (3968.5 Å), Na D (5890 and 5896 Å) and Li (6708 Å). While the Na D lines are normal, the characteristics of the two other lines do not support a Cepheid nature of V2279 Cyg. The Li (6708 Å) is never seen in emission in Cepheids, while the Ca emission implies chromospheric activity, which is also not a Cepheid characteristic. We fitted theoretical template spectra from the extensive spectral library of Munari et al. (2005) to the spectrum and determined the following atmospheric parameters: K, , and km s-1. The resulting parameters are also incompatible with a Cepheid variable, but suggest a cool main-sequence star with moderate rotation.
Summarizing the previous subsections, we conclude that all the candidates turned out not to be Cepheids except the already known Cepheid V1154 Cyg, which we will describe in detail in the following.
6 V1154 Cyg the only Kepler Cepheid
In this section we analyze both Kepler data and ground-based follow-up observations of what is apparently the only Cepheid being observed in Kepler’s FOV.
6.1 Observational data prior Kepler
Brightness variation of V1154 Cyg was discovered by Strohmeier et al. (1963). Cepheid type variation and a periodicity somewhat shorter than 5 d were obvious from the photographic magnitudes leading to the discovery. The first reliable light curve based on photoelectric observations was published by Wachmann (1976). Further multicolour photoelectric and CCD photometric data were published by Szabados (1977), Arellano Ferro et al. (1998), Ignatova & Vozyakova (2000), Berdnikov (2008) and Pigulski et al. (2009). This latter paper contains the data of a dedicated photometric survey of the whole Kepler field. Space photometric data of V1154 Cyg are also available from the Hipparcos satellite ESA (1997) and the Scientific Archive of the Optical Monitoring Camera (OMC) on board INTEGRAL. None of these previous data can compete with Kepler in photometric quality.
In addition, a large number of radial velocity data have been collected on V1154 Cyg by the Moscow CORAVEL team (Gorynya et al., 1998). These data obtained between show a slight change in the mean velocity averaged over the pulsation cycle, thus Gorynya et al. (1996) suspected spectroscopic binarity of this Cepheid. However, radial velocity data obtained by Imbert (1999) much earlier than the Moscow data and covering a reasonably long time interval do not indicate binarity.
Molenda-Żakowicz et al. (2008) determined basic parameters for our target: , spectral type: G2Ib, K, , and km s-1. These parameters are all consistent with a Cepheid, and place V1154 Cyg inside the theoretical instability strip presented in Fig. 1. The chemical composition of V1154 Cyg was determined independently by Luck et al. (2006) in a major project of Cepheid spectroscopy. They published a value of .

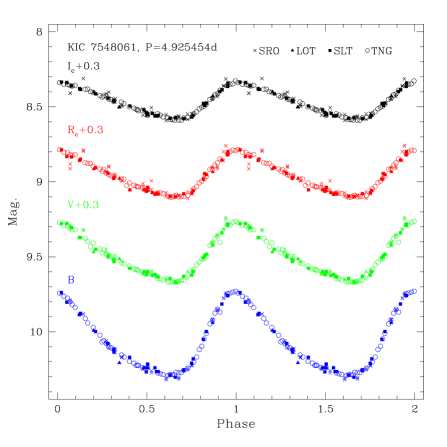
6.2 Multicolour photometry of V1154 Cyg
Fig. 10 shows a multicolour light curve for V1154 Cyg. It contains points in each filter obtained with four different telescopes as described in Section 5.1. The amplitudes and amplitude ratios are consistent with V1154 Cyg being a Cepheid, e.g. the ratio of the and amplitude is 0.6, which is exactly what is expected. Fig. 5 shows that the average Fourier parameters of V1154 Cyg fit well all the progressions, although in each case they are slightly lower than the main progression.
As a check, the colours of V1154 Cyg were compared to other Galactic Cepheids in
Fig. 11. The observed colours of and were
derived from the light curves. To correct for extinction, we adopted
the colour excess from
Fernie et al. (1995)121212http://www.astro.utoronto.ca/DDO/research/cepheids/
/table_colourexcess.html
(after removing the systematic trend in Fernie system using the
prescription given in Tammann et al. 2003). The extinction-free colours are
and . As shown in Fig. 11,
these colours fit well within the period-colour relations defined by the
Galactic Cepheids.
6.3 Analysis of the Kepler light curves
With almost a year of continuous data, it is in principle possible to study the stability of the light curve of a classical Cepheid over several dozen pulsation cycles. However, because instrumental effects are still present in the data, it is too early to perform such an analysis at least until pixel-level data become available, which would allow the data reduction to be optimized for this particular type of star.
The frequency content of the light curve of V1154 Cyg was investigated with standard Fourier transform methods by applying well-tested software packages: SigSpec (Reegen, 2007), Period04 (Lenz & Breger, 2005) and MuFrAn (Kolláth, 1990). The distorted parts of the LC light curves have been omitted, because their presence causes spurious frequency peaks around the main frequencies. The affected parts are the entire Q0 and in Q2. The frequency spectrum shows the main pulsation frequency at d-1 and many harmonics. Two harmonics ( and ) are clearly visible in the upper panel of Fig. 12. Prewhitening with these peaks reveals further harmonics up to the order with very low amplitudes. This is the first time that such high-order harmonics have been detected, underlining the accuracy of the Kepler observations. The effect of instrumental artefacts (trends, amplitude variation) is clearly seen in the remaining power around . Apart from that the frequency spectrum is completely free of additional power at the significance level up to the Nyquist frequency as shown in the lower two panels of Fig. 12.
Before finishing this paper, Q5 SC data became available for V1154 Cyg. To investigate the high-frequency range we used this 94.7 d long data set and the 33.5 d long SC data taken in Q1. The two data sets have a very similar frequency content, and we chose to plot the Q5 SC frequency spectrum in panel d of Fig. 12, because the longer timebase ensures better frequency resolution and higher SNR.
The top of the grass of the remaining spectrum is 5 mag, while the average is 2 mag in the spectrum up to 50 d-1. Above that the top of the grass of the remaining spectrum decreases to 1.5 mag, and from 100 d-1 it remains constant. The average of the remaining peaks is below 1 mag in this high-frequency range. The residual spectrum shows no signal of any shorter period nonradial pulsation modes or solar-like oscillations.
The frequencies, amplitudes and phases of the detected and identified peaks based on Q1Q4 LC data are listed in Table 4. The zero epoch was chosen close to moment of the first data point, i.e. . The errors have been estimated from Period04. Searching for only one frequency of the highest amplitude at a time and prewhitening for it and then repeating the procedure gave practically the same results as searching for all the harmonics simultaneously.

| ID | freq. | ampl. | phase | ||
|---|---|---|---|---|---|
| d-1 | d-1 | mag | rad | rad | |
| 0.2030244 | 0.0000002 | 0.144984 | 0.794350 | 0.000027 | |
| 0.4060514 | 0.0000010 | 0.039291 | 4.403636 | 0.000097 | |
| 0.6090704 | 0.0000041 | 0.009880 | 1.926416 | 0.000385 | |
| 0.8120798 | 0.0000375 | 0.001090 | 5.812189 | 0.003496 | |
| 1.0151798 | 0.0000668 | 0.000611 | 5.508786 | 0.006232 | |
| 1.2181468 | 0.0000683 | 0.000598 | 3.132366 | 0.006361 | |
| 1.4211946 | 0.0001077 | 0.000379 | 0.442772 | 0.010040 | |
| 1.6241924 | 0.0001820 | 0.000224 | 4.130455 | 0.016973 | |
| 1.8272617 | 0.0003652 | 0.000112 | 1.421814 | 0.034039 | |
| 2.0304263 | 0.0006842 | 0.000060 | 4.893997 | 0.063769 | |
| 2.2334364 | 0.0001591 | 0.000026 | 2.184016 | 0.148302 |
6.4 Behaviour of the pulsation period
This is the first occasion that cycle-to-cycle changes in the pulsation period of a Cepheid can be followed. The analysis of Kepler data of V1154 Cyg is published in a separate paper (Derekas et al. 2011, in prep.). Here we study the long-term behaviour of the pulsation period.
The computed times of maxima were calculated from the period fitted to the Kepler data. One point was derived for the mid-epoch of annual sections for each available photometric time series taken from the literature. Besides the Kepler maxima and available CCD and photoelectric observation we publish for the first time V1154 Cyg data from digitized Harvard plates and eye estimations from Sternberg Astronomical Institute (SAI) photographic plates. The passband of these observations is close to Johnson . We also used visual and CCD observations from the AAVSO International Database. Where both Johnson and data were available at the same epoch, we retained only the maxima.
These data points are listed in the first column of Table 5. Column 2 lists the epoch number ( was arbitrarily taken at the first maximum of the Kepler data). Weights were assigned to individual data sets similarly to the case of V2279 Cyg. The weights are listed in Column 4. The final ephemeris was derived by a weighted linear least squares fit to the preliminary residuals computed from a formerly published (usually slightly incorrect) period value which is an inherent step in the method. No weight was assigned to the photographic normal maxima, these residuals were omitted from fitting procedure. The residuals in Column 3 have been calculated with the final ephemeris
.
This period is considered to be more accurate than the one obtained by fitting the frequency and its harmonics. The source of data is given in the last column of Table 5. The diagram is shown in Fig. 13. This plot indicates that the pulsation period has been constant during the last 40 y. In principle, the moments of maximum light differ for different passbands. From simultaneous observations we find a difference of d between the and maxima in the sense of , which is neglected in Fig. 13. We note that this does not change our conclusions in any way.
6.5 Radial velocities of V1154 Cyg
The suspected spectroscopic binarity of V1154 Cyg can be investigated with the help of the new radial velocity data, most of them obtained with the Tautenburg 2.0 m telescope (see Table 6). The comparison with the data taken from the literature (Gorynya et al., 1998) and Imbert (1999) does not give a new evidence of spectroscopic binarity because the -velocity (mean radial velocity averaged over a complete pulsational cycle) derived from the new data practically coincides with that obtained from the previous observations – see Fig. 14. Quantitatively, the difference is km s-1 and km s-1 between our new data and data of Gorynya et al. (1998) and Imbert (1999), respectively.
We add that a period derived from all the available radial velocity data is in very good agreement with (less than 2- from) the photometric period derived in the previous subsection.
| JD⊙ | E | W | filter | Reference | |
| 2 400 000 | [d] | (Instrument) | |||
| 14862.215 | 8140 | 0.3154 | 0 | PG | this work (Harvard) |
| 15675.172 | 7975 | 0.0584 | 0 | PG | this work (Harvard) |
| 16492.860 | 7809 | 0.0043 | 0 | PG | this work (Harvard) |
| … | … | … | … | … | … |
| 40962.4929 | 2841 | 0.0188 | 3 | V | Wachmann (1976) |
| 41494.5033 | 2733 | 0.0426 | 3 | V | Szabados (1977) |
| 46291.8422 | 1759 | 0.0107 | 3 | V | Berdnikov (2008) |
| … | … | … | … | … | … |
| 54955.7450 | 0 | 0.0185 | 5 | Kp | this work (Kepler) |
| 54960.6690 | 1 | 0.0170 | 5 | Kp | this work (Kepler) |
| 54965.5787 | 2 | 0.0014 | 5 | Kp | this work (Kepler) |

| JD⊙ | RV | SNR | Obs. | |
|---|---|---|---|---|
| 2 450 000+ | km s-1 | km s-1 | ||
| 4267.4519 | 17.22 | 0.7 | 60 | OACt |
| 5338.5157 | 8.069 | 0.033 | 193 | TLS |
| 5359.3851 | 14.597 | 0.053 | 72 | TLS |
| 5376.4405 | 1.216 | 0.006 | 107 | TLS |
| 5376.4621 | 0.921 | 0.006 | 110 | TLS |
| 5378.5110 | 1.540 | 0.006 | 110 | TLS |
| 5381.4465 | 0.243 | 0.007 | 91 | TLS |
| 5381.4681 | 0.076 | 0.007 | 96 | TLS |
| 5389.4482 | 15.779 | 0.046 | 74 | TLS |
| 5393.5050 | 7.969 | 0.019 | 93 | TLS |
| 5397.4266 | 7.848 | 0.040 | 214 | TLS |
| 5428.3559 | 14.464 | 0.048 | 80 | TLS |
| 5429.3496 | 12.620 | 0.048 | 75 | TLS |
| 5430.3332 | 3.570 | 0.015 | 101 | TLS |
| 5431.4743 | 5.302 | 0.019 | 141 | TLS |
6.6 Pulsation mode of V1154 Cyg
Cepheids pulsate in one of the first three radial modes (fundamental (F), first (O1) and second overtone (O2)) or simultaneously in two or three of them. Some triple-mode Cepheids pulsate in the first three overtones at the same time. From a pulsational and evolutionary point of view it is important to determine the pulsational mode of a monoperiodic Cepheid. Cepheids with pulsational periods similar to V1154 Cyg may pulsate in the fundamental or the first overtone mode. The usual way of distinction is the use of Fourier parameters that show characteristic progression as a function of period. However, the Fourier parameters of radial velocity curves are indistinguishable for fundamental and first overtone pulsators with periods around 5 d (see Fig. 3 of Baranowski et al. 2009). Light curve Fourier parameters suffer from similar problems. Based on Fig. 5, and are the most promising parameters for mode discrimination. However, a closer inspection reveals that there is a difference between values of fundamental and first overtone Galactic Cepheids close to 5 d period, therefore this particular phase difference is not a good discriminator in the case of V1154 Cyg. is higher for F Cepheids, and lower for O1 Cepheids. However it is amplitude dependent, and if we decrease the amplitude of the F Cepheid it also goes to zero. V1154 Cyg is not a low-amplitude Cepheid, and based on alone, it can be classified as a fundamental mode pulsator. Though to draw a firm conclusion, we need more pieces of evidence.
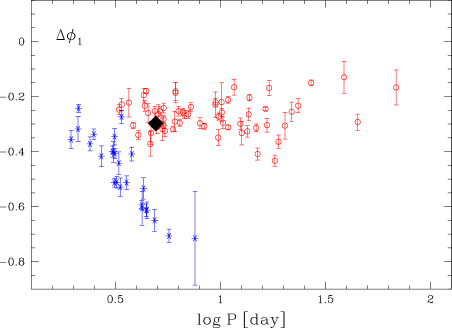
Analysis of the first order phase lag () between the Johnson light curve and radial velocity may come to the rescue (Ogłoza et al., 2000; Szabó et al., 2007). The phase lag method is a reliable tool to establish Cepheid pulsation mode in this pulsation period regime. We used the simultaneous new RV data (Table 6) and Johnson photometry (Fig. 10 and Table 2) and derived which places our Cepheid firmly among fundamental mode Cepheids as is clearly seen in Fig. 15.
7 Conclusions
We described the pre-launch selection of Cepheid candidates within the Kepler FOV. Of our forty candidates only five remained after inspection of the Kepler light curves. Aided by additional ground-based multicolour and spectroscopic observations we excluded further four stars including V2279 Cyg (KIC 8022670), which is most likely a rapidly rotating K dwarf with flares showing prominent emission lines. Our results show that its previous classification as a Cepheid is not correct. This leaves only one star, V1154 Cyg KIC 7548061), which is a well-known Cepheid.
Kepler has provided one of the most accurate Cepheid light curves to date. High-order harmonics of the main pulsational mode were detected for the first time up to the harmonic. Reliable investigation of cycle-to-cycle variations in the light curve is currently hampered by instrumental effects, but will be investigated as pixel-level data or finally corrected data are available for V1154 Cyg. Period variation is investigated in a separate paper (Derekas et al. 2011, in prep).

New, high-precision radial velocity measurements of V1154 Cyg do not confirm spectroscopic binarity hypothesized by Gorynya et al. (1996). Measuring the phase lag between simultaneous photometric and radial velocity data of the pulsation allowed us to determine unambiguously that V1154 Cyg is a fundamental mode pulsator.
An intriguing feature of classical Cepheids is the possible presence of nonradial pulsation modes in the case of a number of first-overtone Cepheids in the Large Magellanic Cloud (Moskalik & Kołaczkowski, 2009). Indeed, theoretical computations by Mulet-Marquis et al. (2007) predict the presence of high-order nonradial mode close to and beyond the blue edge of the Cepheid instability strip. Although V1154 Cyg pulsates in the fundamental mode, we have searched for, but have not found any short period variability (nonradial or stochastically excited modes).
New kinds of investigations will become possible with upcoming years-long Kepler data when all instrumental effects are understood. These include analyses of the light curve variation from cycle to cycle, and the detection of low-mass companions through the light-time effect.
Acknowledgments
Funding for thr Kepler Mission is provided by NASA’s Science Mission Directorate. This project has been supported by the ‘Lendület’ program of the Hungarian Academy of Sciences and the Hungarian OTKA grant K83790. Financial support from the ESA (PECS programme No. C98090) is gratefully acknowledged. CCN thanks the funding from National Science Council (of Taiwan) under the contract NSC 98-2112-M-008-013-MY3. RS is supported by the Austrian Science Fund (FWF project AP 2120521). We acknowledge assistance of the queue observers, Chi-Sheng Lin and Hsiang-Yao Hsiao, from Lulin Observatory. Part of this project is based on data from the OMC Archive at LAEFF, pre-processed by ISDC. We acknowledge with thanks the variable star observations from the AAVSO International Database contributed by observers worldwide and used in this research. The authors gratefully acknowledge the entire Kepler team, whose outstanding efforts have made these results possible.
References
- Akerlof et al. (2000) Akerlof C., Amrose S., Balsano R. et al., 2000, AJ, 119, 1901
- Antonello & Lee (1981) Antonello E., Lee A. S., 1981, ApJ, 248, 291
- Antonello & Morelli (1996) Antonello E., Morelli P. L., 1996, A&A, 312, 541
- Antonello & Poretti (1986) Antonello E., Poretti E., 1986, A&A, 169, 149
- Antonello, Poretti & Reduzzi (1990) Antonello E., Poretti E., Reduzzi L., 1990, A&A, 236, 138
- Arellano Ferro et al. (1998) Arellano Ferro A., Rojo Arellano R., González-Bedolla S., Rosenzweig P., 1998, ApJS, 117, 167
- Baranowski et al. (2009) Baranowski R., Smolec R., Dimitrov W. et al., 2009, MNRAS, 396, 2194
- Batalha et al. (2010) Batalha N. M., Borucki W. J., Koch D. G. et al., 2010, ApJ, 713, L109
- Berdnikov (2008) Berdnikov L. N., 2008, VizieR On-line Data Catalog: II/285
- Berdnikov (2010) Berdnikov L. N., 2010, in Variable Stars, the Galactic Halo and Galaxy Formation, Eds.: C. Sterken, N. Samus, & L. Szabados, Moscow, Sternberg Astr. Inst.
- Bertin & Arnouts (1996) Bertin, E., Arnouts, S., 1996, A&AS, 117, 393
- Blomme et al. (2010) Blomme J., Debosscher J., De Ridder J. et al., 2010, ApJ, 683, 433
- Borucki et al. (2010) Borucki W. J., Koch D., Basri G. et al., 2010, Science, 327, 977
- Bruntt et al. (2008) Bruntt H., Evans N. R., Stello D. et al., 2008, ApJ, 683, 433
- Burki et al. (1986) Burki G., Schmidt E. G., Arellano Ferro A., Fernie J. D., Sasselov D., Simon N. R., Percy J. R., Szabados L., 1986, A&A, 168, 139
- Dahlmark (2000) Dahlmark L., 2000, IBVS, No. 4898
- ESA (1997) ESA 1997, Hipparcos Catalogue, ESA SP-1200
- Fernie et al. (1995) Fernie J. D., Evans N. R., Beattie B., Seager, S., 1995, IBVS, 4148, 1
- Gilliland et al. (2010a) Gilliland R. L., Brown T. M., Christensen-Dalsgaard J. et al., 2010a, PASP, 122, 131
- Gilliland et al. (2010b) Gilliland R. L., Jenkins J. M., Borucki W. J. et al., 2010b, ApJ, 713, L160
- Gorynya et al. (1996) Gorynya N. A., Samus’ N. N., Rastorguev A. S., Sachkov M. E., 1996, AstL, 22, 175
- Gorynya et al. (1998) Gorynya N. A., Samus’ N. N., Sachkov M. E., Rastorguev A. S., Glushkova E. V., Antipin S. V., 1998, AstL, 24, 815
- Hartman et al. (2004) Hartman J. D., Bakos G., Stanek K. Z., Noyes R. W., 2004, AJ, 128, 1761
- Ignatova & Vozyakova (2000) Ignatova V. V., Vozyakova O. V., 2000, Astron. Astrophys. Trans., 19, 133
- Imbert (1999) Imbert M., 1999, A&AS, 140, 79
- Jenkins et al. (2010) Jenkins J. M., Caldwell D. A., Chandrasekaran H. et al., 2010a, ApJ, 713, L87
- Jenkins et al. (2010) Jenkins J. M., Caldwell D. A., Chandrasekaran H. et al., 2010b, ApJ, 713, L120
- Kazarovets et al. (2003) Kazarovets E. V., Kireeva N. N., Samus N. N., Durlevich O. V., 2003, IBVS, No. 5422
- Klagyivik & Szabados (2009) Klagyivik P., Szabados L., 2009, A&A, 504, 959
- Koch et al. (2010) Koch D. G., Borucki W. J. Basri G. et al., 2010, ApJL, 713, 79
- Kolenberg et al. (2010) Kolenberg K., Szabó R., Kurtz D. W. et al., 2010, MNRAS, accepted, arXiv:1011.5908
- Kolláth (1990) Kolláth Z., 1990, Occ. Tech. Notes, Konkoly Obs. No. 1.
- Landolt (2009) Landolt A. U., 2009, AJ, 137, 4186
- Lenz & Breger (2005) Lenz P., Breger M., 2005, CoAst, 146, 53
- Luck et al. (2006) Luck R. E., Kovtyukh V. V., Andrievsky S. M., 2006, AJ, 132, 902
- Mantegazza & Poretti (1992) Mantegazza L., Poretti E., 1992, A&A, 261, 137
- Moffett & Barnes (1985) Moffett T. J., Barnes T. G. III, 1985, ApJS, 58, 843
- Molenda-Żakowicz et al. (2008) Molenda-Żakowicz J., Frasca A., Latham D. W., 2008, AcA, 58, 419
- Moskalik & Kołaczkowski (2009) Moskalik P., Kołaczkowski Z., 2009, MNRAS, 394, 1649
- Mulet-Marquis et al. (2007) Mulet-Marquis C., Glatzel W., Baraffe I., Winisdoerffer C., 2007, A&A, 465, 937
- Munari et al. (2005) Munari, U., Sordo R., Castelli F., Zwitter T., 2005, A&A, 442, 1127
- Ogłoza et al. (2000) Ogłoza W., Moskalik P., Kanbur S., 2000, ASP Conf. Ser. 203, 235
- Pigulski et al. (2009) Pigulski A., Pojmański G., Pilecki B., Szczygieł, D. M., 2009, AcA, 59, 33
- Pojmanski & Maciejewski (2004) Pojmanski G., Maciejewski G., 2004, AcA, 54, 153
- Poretti (1994) Poretti E., 1994, A&A, 285, 524
- Reegen (2007) Reegen P., 2007, A&A, 467, 1353
- Samus et al. (2002) Samus N. N. et al., 2002, Astr. Lett., 28, 174
- Schmidt et al. (2007) Schmidt E. G., Langan S., Rogalla D., Thacker-Lynn L., 2007, AJ, 133, 665
- Simon & Lee (1981) Simon N. R., Lee A. S., 1981, ApJ, 248, 291
- Spreckley & Stevens (2008) Spreckley S. A., Stevens I. R., 2008, MNRAS, 388, 1239
- Strohmeier et al. (1963) Strohmeier W., Knigge R., Ott H., 1963, Bamberg Veröff., V, Nr. 16
- Szabados (1977) Szabados L., 1977, Commun. Konkoly. Obs. Hung. Acad. Sci., Budapest, No. 70
- Szabó et al. (2007) Szabó R., Buchler J. R., Bartee J., 2007, ApJ, 667, 1150
- Szabó et al. (2010) Szabó R., Kolláth Z., Molnár L. et al. 2010, MNRAS, 409, 1244
- Tammann et al. (2003) Tammann G. A., Sandage A., Reindl B., 2003, A&A, 404, 423
- Voges et al. (1999) Voges W., Aschenbach B., Boller Th. et al., 1999, A&A, 349, 389
- Wachmann (1976) Wachmann A. A., 1976, A&AS, 23, 249
- Woźniak et al. (2004) Woźniak P. R., Vestrand W. T., Akerlof C. W. et al., 2004, AJ, 127, 2436