Molecular Gas in NUclei of GAlaxies (NUGA)
XIV. The barred LINER/Seyfert 2 galaxy NGC 3627
††thanks: Based on observations
carried out with the IRAM Plateau de Bure Interferometer. IRAM is supported by the
INSU/CNRS (France), MPG (Germany), and IGN (Spain).
We present 12CO(1–0) and 12CO(2–1) maps of the interacting barred LINER/Seyfert 2 galaxy NGC 3627 obtained with the IRAM interferometer at resolutions of 21 13 and 09 06, respectively. We also present single-dish IRAM 30 m 12CO(1–0) and 12CO(2–1) observations used to compute short spacings and complete interferometric measurements. These observations are complemented by IRAM 30 m measurements of HCN(1–0) emission detected in the center of NGC 3627. The molecular gas emission shows a nuclear peak, an elongated bar-like structure of 18″ (900 pc) diameter in both 12CO maps and, in 12CO(1–0), a two-arm spiral feature from 9″ (450 pc) to 16″ (800 pc). The inner 18″ bar-like structure, with a north/south orientation (PA = 14∘), forms two peaks at the extremes of this elongated emission region. The kinematics of the inner molecular gas shows signatures of non-circular motions associated both with the 18″ bar-like structure and the spiral feature detected beyond it. The 1.6 m -band 2MASS image of NGC 3627 shows a stellar bar with a PA = , different from the PA (= ) of the 12CO bar-like structure, indicating that the gas is leading the stellar bar. The far-infrared Spitzer-MIPS 70 and 160 m images of NGC 3627 show that the dust emission is intensified at the nucleus and at the ansae at the ends of the bar, coinciding with the 12CO peaks. The GALEX far-ultraviolet (FUV) morphology of NGC 3627 displays an inner elongated (north/south) ring delimiting a hole around the nucleus, and the 12CO bar-like structure is contained in the hole observed in the FUV. The torques computed with the HST-NICMOS F160W image and our PdBI maps are negative down to the resolution limit of our images, 60 pc in 12CO(2–1). If the bar ends at 3 kpc, coincident with corotation (CR), the torques are negative between the CR of the bar and the nucleus, down to the resolution limit of our observations. This scenario is compatible with a recently-formed rapidly rotating bar which has had insufficient time to slow down because of secular evolution, and thus has not yet formed an inner Lindblad resonance (ILR). The presence of molecular gas inside the CR of the primary bar, where we expect that the ILR will form, makes NGC 3627 a potential smoking gun of inner gas inflow. The gas is fueling the central region, and in a second step could fuel directly the active nucleus.
Key Words.:
galaxies: individual: NGC 3627 – galaxies: spiral – galaxies: active – galaxies: nuclei – galaxies: ISM – galaxies: kinematics and dynamics1 Introduction
The Nuclei of Galaxies (NUGA) project (García-Burillo et al. 2003) is an IRAM Plateau de Bure Interferometer (PdBI) and 30 m single-dish survey of nearby low-luminosity active galactic nuclei (LLAGN). The aim is to map, at high resolution (05-2″) and high sensitivity (2-4 mJy beam-1), the distribution and dynamics of the molecular gas in the inner kpc of the galaxies of our sample, and to study the different mechanisms for gas fueling of LLAGN.
NUGA galaxies analyzed so far show that there is no unique circumnuclear molecular gas feature linked with nuclear activity, but rather a variety of molecular gas morphologies which characterize the inner kpc of active galaxies. We have found one- and two-armed instabilities (García-Burillo et al. 2003), well-ordered rings and nuclear spirals (Combes et al. 2004; Casasola et al. 2008a), circumnuclear asymmetries (Krips et al. 2005), large-scale bars (Boone et al. 2007; Hunt et al. 2008), and smooth disks (Casasola et al. 2010). Among these morphologies, analyzing the torques exerted by the stellar gravitational potential on the molecular gas shows that only four NUGA galaxies: NGC 6574 (Lindt-Krieg et al. 2008), NGC 2782 (Hunt et al. 2008), NGC 3147 (Casasola et al. 2008a), and NGC 4579 (García-Burillo et al. 2009) show evidence for gas inflow. These galaxies have several features in common: (1) a large circumnuclear mass concentration (i.e., a dominant stellar bulge); (2) a high circumnuclear molecular gas fraction (10%); and (3) kinematically decoupled bars with overlapping dynamical resonances. The large amount of gas around the nucleus, combined with dynamical features that enable the gas to penetrate the inner Lindblad Resonance (ILR), seem to be necessary (and perhaps sufficient) ingredients for inducing gas inflow in circumnuclear scales.
The existence of different nuclear molecular morphologies can be sought in the variety of timescales characterizing nuclear activity. Strong fueling only lasts for a time of , where yr is the age of the Universe (Heckman et al. 2004). Thus, the total time during which strong fueling can occur is around yr; if there are fueling events per black hole per Hubble time, each event would have a duration of yr. This implies that the strong accretion phase is a fraction of the characteristic galaxy dynamical time ( yr). Although large-scale bars can produce gas inflow (e.g., Combes & Gerin 1985; Sakamoto et al. 1999) and in some cases also drive powerful starbursts (e.g., Knapen et al. 2002; Jogee et al. 2005), a correlation between large-scale bars and nuclear activity has not yet been verified (e.g., Mulchaey & Regan 1997). This lack of correlation is probably related to the different timescales for bar-induced gas inflow (300 Myr, Jogee et al. 2005), AGN duty cycles ( yr), and intermittent active accretion every yr (Ferrarese et al. 2001; Marecki et al. 2003; Janiuk et al. 2004; Hopkins & Hernquist 2006; King & Pringle 2007). The comparison of these different timescales suggests that most AGN are in an intermediate phase between active accretion episodes making the detection of galaxies with nuclear accretion somewhat difficult.
Gravitational torques act on timescales of 106-7 yr and are the most efficient mechanism in driving the gas from large spatial scales (some tens of kpc) to intermediate spatial scales (a few hundreds of pc). Dynamical friction and viscous torques are often invoked, in addition to gravitational torques, as possible mechanisms of AGN fueling. However, dynamical friction of giant molecular clouds in the stellar bulge of a galaxy tends to be a slow, inefficient process which, to first approximation, can be neglected relative to gravity torques (García-Burillo et al. 2005). Viscous torques can be more effective, and are favored in the presence of large density gradients and high galactic shear (see García-Burillo et al. 2005, for details). Nevertheless, they are relatively inefficient when there are strong (positive) gravity torques.
This paper is dedicated to the galaxy NGC 3627, the eleventh object of the core NUGA sample studied on a case-by-case basis. NGC 3627 (Messier 66, = 10.2 Mpc, = 73 km s-1 Mpc-1) is an interacting (e.g., Casasola et al. 2004) and barred galaxy classified as SAB(s)b showing signatures of a LINER/Seyfert 2 type nuclear activity (Ho et al. 1997). With NGC 3623 and NGC 3628, it forms the well-known Leo Triplet (M 66 Group, VV 308). Since the discovery of a long plume in Hi extending about 50′ to the east of NGC 3628 (Zwicky 1956; Haynes et al. 1979), evidence of past interactions between NGC 3627 and NGC 3628 (the two largest spirals in the group), the Leo Triplet has been extensively studied from the radio to the optical, and in X-ray bandpasses. Optical broad-band images of NGC 3627 reveal a pronounced and asymmetric spiral pattern with heavy dust lanes, indicating strong density wave action (Ptak et al. 2006). While the western arm is accompanied by weak traces of star formation (SF) visible in H, the eastern arm contains a star-forming segment in its inner part (Smith et al. 1994). NGC 3627 also possesses X-ray properties of a galaxy with a recent starburst (Dahlem et al. 1996). Both the radio continuum (2.8 cm and 20 cm) and the 12CO(1–0) emissions show a nuclear peak, extend along the leading edges of the bar forming two broad maxima at the bar ends, and then the spiral arms trail off from the bar ends (Haan et al. 2008; Paladino et al. 2008; Haan et al. 2009). On the contrary, the Hi emission exhibits a spiral morphology without signatures of a bar in the atomic gas (Haan et al. 2008; Walter et al. 2008; Haan et al. 2009).
| Parameter | Valueb | Referencec |
|---|---|---|
| a | 11h20m15.02s | (1) |
| a | 12∘59′2950 | (1) |
| 744 km s-1 | (1) | |
| RC3 Type | SAB(s)b | (2) |
| Nuclear Activity | LINER/Seyfert 2 | (3) |
| Inclination | 613 | (1) |
| Position Angle | 178∘ 1∘ | (1) |
| Distance | 10.2 Mpc (1″ = 49 pc) | (2) |
| LB | L⊙ | (4) |
| M | M⊙ | (5) |
| M | M⊙ | (6) |
| Mdust(60 and 100 m) | M⊙ | (4) |
| LFIR | L⊙ | (7) |
-
a
(, ) is the phase tracking center of our 12CO interferometric observations, assumed coincident with the dynamical center of NGC 3627 (see Sect. 4.1).
-
b
Luminosity and mass values extracted from the literature have been scaled to the distance of = 10.2 Mpc.
- c
| Reference | Telescope | Diameter | Primary beam or FOVa | Beam | Flux |
|---|---|---|---|---|---|
| [m] | [″] | [″ ″] | [Jy km s-1] | ||
| Young et al. (1995) | FCRAO | 14 | 45 | 786 | |
| This paper | PdBI+30 m | 42 | 2.1 1.3 | 668 | |
| This paper | PdBI+30 m | 22b | 2.1 1.3 | 359 | |
| This paper | PdBI | 22b | 2.0 1.3 | 251 | |
| This paper | 30 m | 30 | 22 (central position) | 343c | |
| Helfer et al. (2003) | NRAO | 12 | 55 (inner 50″50″) | 1100–1200 | |
| This paper | 30 m | 30 | 22 (inner 50″50″) | 1097d |
-
a
Primary beam is considered for single-dish observations, while field-of-view (FOV) for interferometric or combined (interferometric+single-dish) ones.
-
b
The photometry has been performed within 22″, the 12CO(1–0) primary beam for the 30 m telescope.
-
c
The 12CO(1–0) recovered flux for the central position (0″, 0″).
-
d
The 12CO(1–0) recovered flux for inner 50″50″, mapping with 7″spacing (see Sect. 2.2).
The most recent Hi mass determination for NGC 3627 has been obtained by Haan et al. (2008), M108 M⊙ (reported to our adopted distance of Mpc), on average less than the typical value expected for interacting galaxies of the same Hubble type (Casasola et al. 2004). The H2 mass content estimated by Kuno et al. (2007) is M⊙ (scaled to our distance of Mpc for NGC 3627).
These H2 and Hi mass values give a H2/Hi mass ratio of 5.1, high compared to the average ratio expected for galaxies similar to NGC 3627, MM (Casasola et al. 2004). The high H2/Hi mass ratio in NGC 3627 is probably due to the tidal interaction with NGC 3628, since this galaxy has “captured” much of the Hi in NGC 3627 (Zhang et al. 1993).
Other molecular transitions have been detected in NGC 3627, including HCN(1–0), HCN(2–1), HCN(3–2), HCO+(1–0), and HCO+(3–2), suggesting the presence of high density gas (Gao & Solomon 2004; Krips et al. 2008). We list in Table 1 the main observational parameters of NGC 3627.
The structure of this paper is as follows. In Sect. 2, we describe our new observations of NGC 3627 and the literature data with which we compare them. In Sects. 3 and 4, we present the observational results, both single-dish and interferometric, describing morphology, excitation conditions, and kinematics of the molecular gas in the inner kpc of NGC 3627. Comparisons between 12CO observations and those obtained at other wavelengths are given in Sect. 5. In Sect. 6, we describe the computation of the gravity torques derived from the stellar potential in the inner region of NGC 3627, and in Sect. 7, we give an dynamical interpretation of the results. Finally, Sect. 8 summarizes our main results.
We assume a distance to NGC 3627 of Mpc, (HyperLeda DataBase111Paturel et al. (2003), http://leda.univ-lyon1.fr) and a Hubble constant km s-1 Mpc-1. This distance means that 1″ corresponds to 49 pc.
 |
 |
2 Observations
2.1 Interferometric observations
We observed NGC 3627 with the IRAM PdBI (6 antennas) in the ABCD configuration of the array between 2003 September and 2004 February in the 12CO(1–0) [115 GHz] and the 12CO(2–1) [230 GHz] line. The PdBI receiver characteristics, the observing procedures, and the image reconstruction are similar to those described in García-Burillo et al. (2003). The quasar 3C454.3 was used for bandpass calibration, 3C273 for flux calibration, and 1546+027 for phase and amplitude calibrations.
Data cubes with 512 512 pixels (0 27 for 12CO(1–0) and 0 13 for 12CO(2–1)) were created over a velocity interval of -242.5 km s-1 to +242.5 km s-1 in bins of 5 km s-1. The images presented here were reconstructed using the standard IRAM/GILDAS222http://www.iram.fr/IRAMFR/GILDAS/ software (Guilloteau & Lucas 2000) and restored with Gaussian beams of dimensions 20 13 (PA = 23∘) at 115 GHz and 09 06 (PA = 28∘) at 230 GHz. We used natural and uniform weightings to generate 12CO(1–0) and 12CO(2–1) maps, respectively. This allows to maximize the flux recovered in 12CO(1–0) and optimize the spatial resolution in 12CO(2–1). In the cleaned maps, the rms levels are and for the 12CO(1–0) and 12CO(2–1) lines, respectively at a velocity resolution of 5 km s-1. At a level of 3 no 3 mm (1 mm) continuum was detected toward NGC 3627 down to an rms noise level of (). The conversion factors between intensity and brightness temperature are at 115 GHz and at 230 GHz. All velocities are referred to the systemic velocity = 744 km s-1 and offsets are relative to the phase tracking center of our observations (11h20m15.02s, 12∘59′29.50″) [see later Sect. 4.1]. All maps are centered on this position (see Table 1) and are not corrected for primary beam attenuation.
2.2 Single-dish observations
We performed IRAM 30 m telescope observations of NGC 3627 on July 16-19, 2002, in a raster pattern with 7″ spacing. By using 4 SIS receivers, we simultaneously observed the frequencies of the 12CO(1–0) [115 GHz], the 12CO(2–1) [230 GHz], and the HCN(1–0) [89 GHz] lines. The 12CO(2–1) line has been observed in dual-polarization. The half power beam widths (HPBW) are 22″, 12″, and 29″ for 12CO(1–0), 12CO(2–1), and HCN(1–0) lines, respectively. Typical system temperatures were 110-145 K at 115 GHz, 320-750 K at 230 GHz, and 110-145 K at 89 GHz. For the single-dish data reduction, the Continuum and Line Analysis Single-dish Software (CLASS2) was used. Throughout the paper we express the line intensity scale in units of the beam-averaged radiation temperature (Tmb). Tmb is related to the equivalent antenna temperature reported above the atmosphere (T) by TTmb, where is the telescope main-beam efficiency. At 115 GHz = 0.79, at 230 GHz = 0.54, and at 89 GHz = 0.82. All observations were performed in “wobbler-switching” mode, with a minimum phase time for spectral line observations of 2 s and a maximum beam throw of 240″. The pointing accuracy was 3″ rms. The single-dish maps presented in this paper are centered on the phase tracking center of our interferometric observations (see Table 1).
2.3 Short spacing correction
An interferometer is limited by the minimum spacing of its antennas. Because two antennas can not be placed closer than some minimum distance (), signals on spatial scales larger than some size () will be attenuated. This effect, called the “missing flux” problem, is resolved by using single-dish observations to compute short spacings and complete the interferometric measurements.
By combining 30 m and PdBI data, we found the best compromise between good angular resolution and complete restoration of the missing extended flux by varying the relative weights of 30 m and PdBI observations. The combined PdBI+30 m maps have angular resolutions of 21 13 at PA = for the 12CO(1–0) and 09 06 at PA = for the 12CO(2–1). In the combined maps, the rms uncertainty in 5 km s-1 width velocity channels is 3.6 mJy beam-1 and 6.5 mJy beam-1 for the 12CO(1–0) and 12CO(2–1) lines, respectively. For these maps, the conversion factors between intensity and brightness temperature are at 115 GHz and at 230 GHz. All interferometric figures presented in this paper are realized with short-spacing-corrected data.
Within 22″, the 12CO(1–0) HPBW for the 30 m telescope, the map including only PdBI observations recovers a flux SCO(1-0) = 251 Jy km s-1, 70 of the total flux measured with the merged PdBI+30 m map, SCO(1-0) = 359 Jy km s-1. Table 2 reports both 12CO(1–0) flux values determined with our observations (single-dish, interferometric, and combined PdBI+30 m) and those present in literature. In this table, Col. (1) indicates the reference, Cols. (2) and (3) are the telescope (single-dish or interferometer) and the diameter of the single-dish telescope respectively, Col. (4) is the primary beam of the instrument or the diameter used for the performed photometry, Col. (5) is the beam in interferometric measurements, and Col. (6) gives the measured flux. Table 2 shows that 12CO(1–0) fluxes we obtained with interferometric observations, single-dish, and combined measurements (PdBI+30 m) are in good mutual agreement with each other and with data present in literature. Our 30 m observations give a value SCO(1-0) = 343 Jy km s-1 for the central position, consistent with flux value found with PdBI+30 m data within the 12CO(1–0) 30 m–HPBW (22″). The whole region covered with 30 m observations (50″50″) gives a flux of 1097 Jy km s-1, in agreement with the BIMA SONG survey333Berkley-Illinois-Maryland Association Survey of Nearby Galaxies. (NRAO 12 m) measurements (Helfer et al. 2003, see Fig. 50, 1100–1200 Jy km s-1). Moreover, within the 42″primary beam field of the PdBI, we recovered 85 of the flux detected by Young et al. (1995) for the central position with the FCRAO (786 Jy km s-1), a good agreement considering the uncertainties in the amplitude calibration and the non-correction by the primary beam attenuation.
2.4 Other images of NGC 3627
We also acquired the large-scale 12CO(1–0) emission image available thanks to the BIMA SONG survey performed with the 10-element BIMA millimeter interferometer (Welch et al. 1996) at Hat Creek, California. This image was first published by Regan et al. (2001) and Helfer et al. (2003), and covers a field of 350″410″(centered on the galaxy) with a pixel size of 1″, and a beam of 6655.
Several infrared (IR) images are included in our analysis: the Spitzer-IRAC 3.6 m image (to trace the stellar component), the Spitzer-IRAC 8 m image (to visualize the Polycyclic Aromatic Hydrocarbons [PAH] features), and the Spitzer-MIPS 70 and 160 m images (to study the dust emission and resolve the SF regions). These IR images are available thanks to the project “SINGS: The Spitzer Infrared Nearby Galaxies Survey” (Kennicutt et al. 2003). The IRAC images cover a sky area of 1600″1890″and 1220″1420″at 3.6 m and 8 m respectively, both with a pixel size of 075, and spatial resolutions of 1-2″. The MIPS 70 m image covers 1940″3645″with a pixel size of 45, and the MIPS 160 m image 2025″3460″with a pixel size of 9″.
We also use two near-infrared (NIR) images (1.65 m): the first was taken from the Two Micron All Sky Survey (2MASS) and covers a FOV of 1212′, with a resolution of 25. The second 1.6 m -band image of NGC 3627 is available thanks to the F160W filter on the Near-Infrared Camera and Multi-Object Spectrometer (NICMOS, camera 3 [NIC3]) on board the Hubble Space Telescope (HST). This image covers a FOV of 51″51″, has a resolution of 02, and is not exactly centered on the galaxy but offset from our phase tracking center 7″ toward west and 74 toward south. It is part of a survey of 94 nearby galaxies from the Revised Shapley Ames Catalog (Böker et al. 1999).
Finally, we also use a far-ultraviolet (FUV) image from the GALEX satellite, whose band is centered at = 1516 Å. This image has been already used and studied in the context of the GALEX Nearby Galaxies Survey (NGS, Gil de Paz et al. 2007). The image covers a square region on the sky of size 5760″5760″, i.e., much larger than the extent of the optical disk of NGC 3627, with 15 pixels. As the image was reduced with the GALEX data pipeline, it is already expressed in intensity units and skysubtracted. The total FUV calibrated magnitude is 16.340.02, corresponding to a FUV flux density of 105719 Jy.
3 Single-dish results
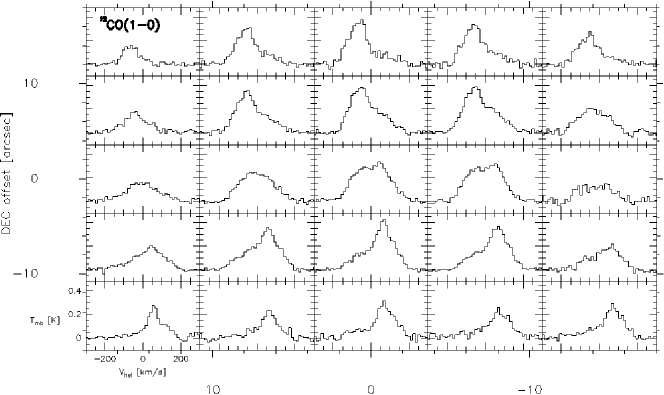
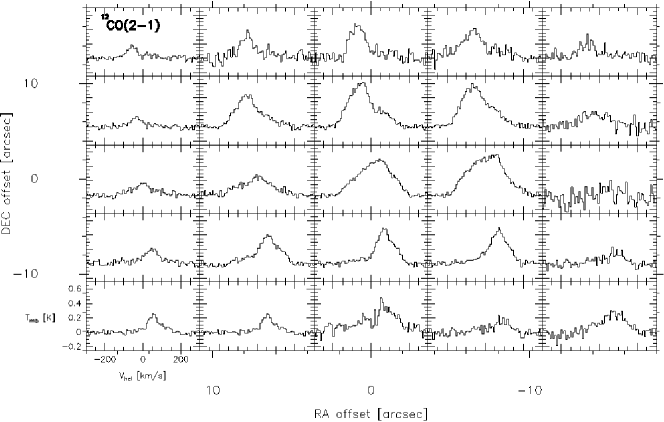
The observations performed with the A and B receivers of the IRAM 30 m telescope in the two 12CO lines covered the inner 50″, corresponding to the central 2.5 kpc (in diameter) of the galaxy (Fig. 1). The observed positions show that the central region of NGC 3627 hosts extended molecular emission both in 12CO(1–0) and 12CO(2–1). The maximum detected Tmb is 0.4 K in 12CO(1–0) at the offset position (0″, -7″), and 0.6 K in 12CO(2–1) at the offset position (0″, 7″).
We estimate a flux of 1097 Jy km s-1 within the inner 50″50″(see Table 2 and Sect. 2.3), in good agreement with previous single-dish flux determinations (e.g., Helfer et al. 2003). Assuming a H2-CO conversion factor of / cm-2 (K km s-1)-1 (Solomon & Barrett 1991), the 12CO(1–0) integrated flux allows us to derive the H2 mass within the observed region as:
| (1) |
We derive an H2 mass of M9.9 within the inner 50″50″, and taking into account the mass of helium, the total molecular mass is M1.3.
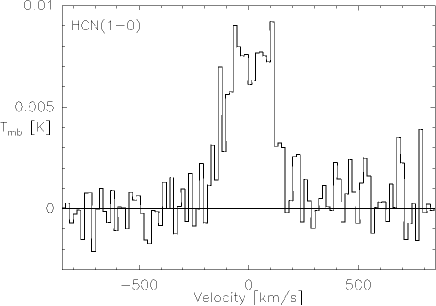
The HCN(1–0) line has been observed for inner 25 positions with 7″ spacing, covering the central 56″ (2.7 kpc in diameter). The HCN(1–0) average spectrum over the 55 grid is displayed in Fig. 2 and shows a peak at Tmb0.009 K. The HCN(1–0) velocity integrated intensity of the central position (0″, 0″) is IHCN(1-0) = 3.10.3 K km s-1 with v = 23732 km s-1, consistent with the results obtained by Krips et al. (2008) for the same position observed with the same instrument (IHCN(1-0) = 2.70.2 K km s-1 with v = 29030 km s-1). The CO(1–0)/HCN(1–0) ratio averaged on the center of galaxy is roughly 10, a value intermediate between the ratios found in spatially resolved molecular disks around AGN, such as NGC 6951 (Krips et al. 2007) and NGC 1068 (Krips et al. 2008), and those found in pure starburst galaxies such as M 82 (Krips et al. 2008).
4 Interferometric results
4.1 Dynamical center
The phase tracking center of our observations (see Table 1) coincides almost exactly with the nuclear radio source detected at 15 GHz (VLA/2 cm) by Nagar et al. (2000) [11h20m15.01s, 12∘59′2976] and at 8.4 GHz (VLA/3.6 cm) by Filho et al. (2000) [11h20m15.0s, 12∘59′30″]. Thus, in the following, we assume that our observations are centered on the dynamical center of NGC 3627.
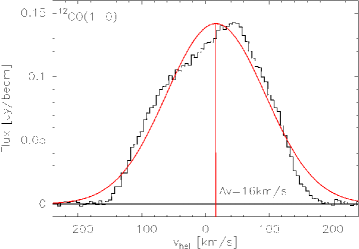
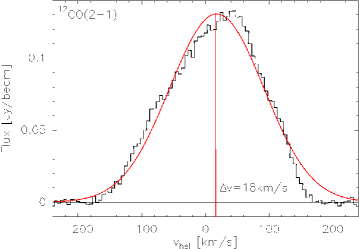
The spectral correlators were centered at 114.992 GHz for 12CO(1–0) and 229.979 GHz for 12CO(2–1), corresponding to = 727 km s-1. Since for NGC 3627 the difference between LSR and heliocentric velocity is 0 km s-1, our observations were centered on = = 727 km s-1. In the inner 2″ of NGC 3627 the velocity centroid is 16 km s-1 redshifted with respect to the heliocentric velocity of the center of our 12CO(1–0) observations (Fig. 3, left panel). Similarly to 12CO(1–0), for 12CO(2–1) we find that the velocity centroid is 18 km s-1 redshifted with respect to the heliocentric velocity (Fig. 3, right panel). Assuming an intermediate value between the systemic heliocentric velocity determined for the 12CO(1–0) and that for the 12CO(2–1), we estimate = 744 km s-1.
This estimation of the systemic heliocentric velocity is 24 km s-1 redshifted with respect to the systemic heliocentric velocity determined from Hi observations (720 km s-1, HyperLeda Database; Haan et al. 2008). In interacting galaxies and in those with a lopsided Hi morphology, a discrepancy between systemic velocity derived from 12CO and Hi observations is not unusual. NGC 4579 (García-Burillo et al. 2009) and NGC 5953 (Casasola et al. 2010) exhibit differences of 50 km s-1 between 12CO and Hi velocities, perhaps due to the interaction history of the galaxy and the different effect of the ram pressure on the atomic and molecular gas (García-Burillo et al. 2009). In NGC 3627, the role of interaction history and the ram-pressure, although not negligible, could have shifted the Hi barycenter with respect to the molecular one less strongly than in NGC 4579 and NGC 5953.
4.2 CO distribution and mass
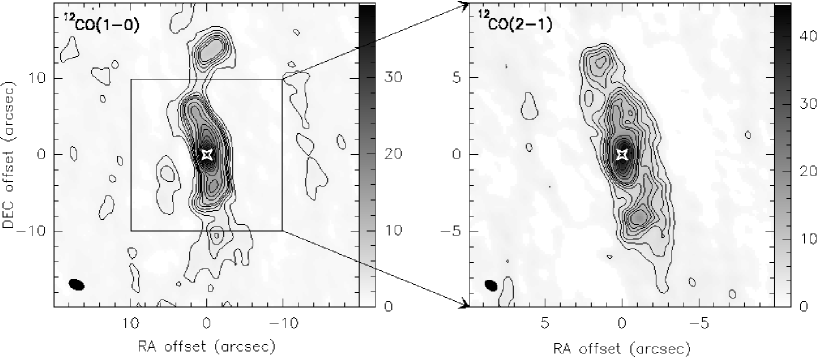
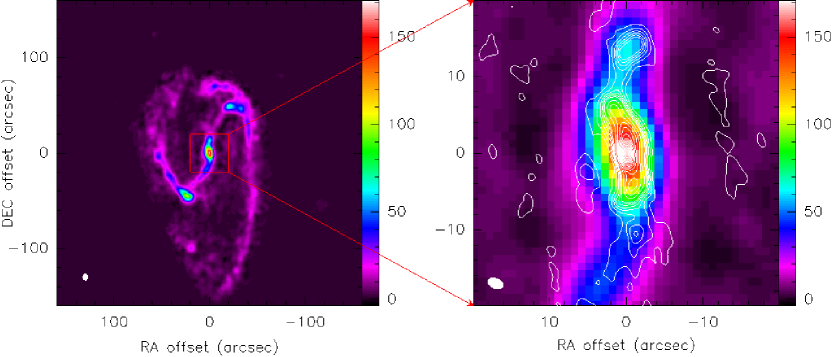
Figure 4 shows the 12CO(1–0) and 12CO(2–1) integrated intensity distributions in the inner 40″ (2 kpc) of NGC 3627. The 12CO(1–0) emission (Fig. 4, left panel) exhibits a peak at the nucleus, extends along a bar-like structure of 18″ (900 pc) diameter with a north/south orientation (see later Sect. 4.4 for the discussion on the PA) and two peaks at its extremes, at 5-6″ (270 pc), with the southern one more evident. The 12CO(1–0) morphology also shows a two-arm spiral feature from 9″ (450 pc) to 16″ (800 pc), with two peaks over these spiral arms at 12-14″ (650 pc). A similar and more resolved distribution is found in 12CO(2–1) [Fig. 4, right panel]. Like the nuclear peak, the two peaks at the ends of the inner 18″ bar-like structure at 5-6″, are more evident than in 12CO(1–0).
The 12CO distribution found here agrees well with previous molecular gas maps, such as that given by Regan et al. (2001) and Helfer et al. (2003) in the context of the BIMA SONG survey and that obtained by Kuno et al. (2007) with the 45 m telescope of the Nobeyama Radio Observatory. Although we only observed the inner 2 kpc of the galaxy, the good PdBI resolution allows us to investigate the nuclear molecular gas distribution in NGC 3627 more in detail than in BIMA SONG survey (typical resolution of 6″) and with the 45 m NRAO telescope (FWHM15″). The 12CO distribution is completely different from the ringed Hi morphology which exhibits an inner hole where instead the molecular gas is located (Haan et al. 2008; Walter et al. 2008).
Applying Eq. (1) to combined PdBI+30 m data, we derived a total H2 mass of M6.0 ( Jy km s-1, see Table 2) within the 42″ primary beam field of the PdBI. Taking into account the mass of helium, the total molecular mass is Mmol8.2. This is roughly 63% of the molecular gas mass within a 50″ diameter (see Sect. 3). The 18″ 12CO(1–0) bar-like structure contributes an H2 mass of M2.1, roughly one-third of the H2 mass computed within 42″, although the feature occupies an area of only 5% of the 42″ beam. NGC 3627, compared to other NUGA galaxies, is not particularly massive in molecular gas, especially with respect to the extraordinary case of NGC 1961 with an H2 mass of 1.8 (Combes et al. 2009).
4.3 CO(2–1)/CO(1–0) line ratio
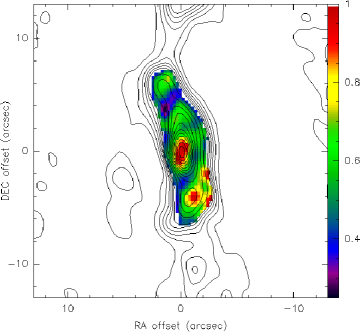
Information about the local excitation conditions of the molecular gas can be inferred from the line ratio R21=I21/I10. This ratio is obtained by comparing the 12CO maps of the two transitions, at the same resolution and with the same spatial frequency sampling. Figure 5 shows R21 ratio with 12CO(1–0) contours as in Fig. 4 (left panel). In the observed region, the line ratio ranges from 0.25 to 1 but the bulk of the emission has a ratio between 0.4 and 0.7. These R21 line ratio values are consistent with R21 = 0.6 obtained by Krips et al. (2008), and more in general with optically thick emission in spiral disks (e.g., Braine & Combes 1992; García-Burillo et al. 1993). The R21 peaks of 1 are reached in the center of NGC 3627 and at the southern extreme of the elongated 12CO emission region. A higher excitation of the molecular gas in the nucleus, suggested by a higher R21 line ratio, is consistent with the HCN(1–0) emission in the same region (see Sect. 3).
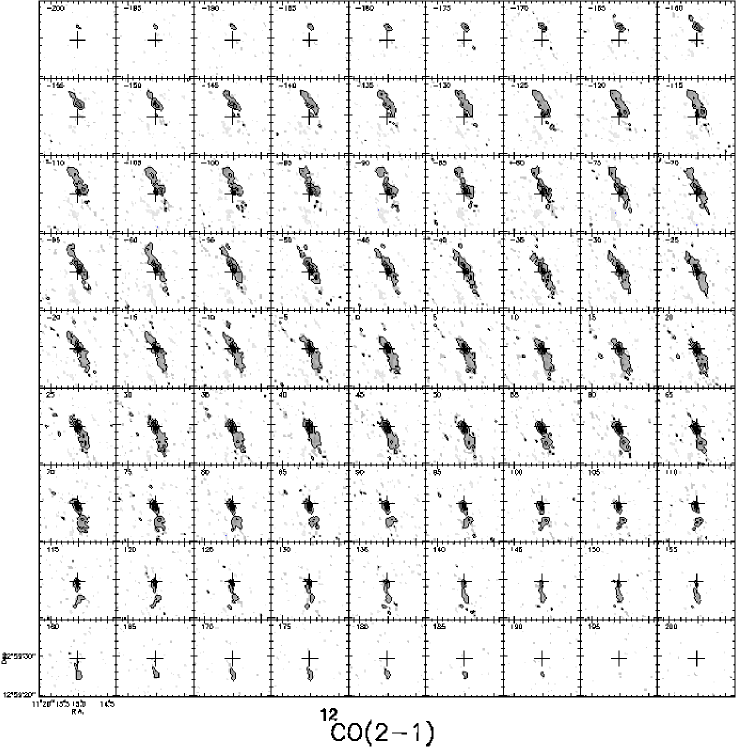
4.4 CO Kinematics
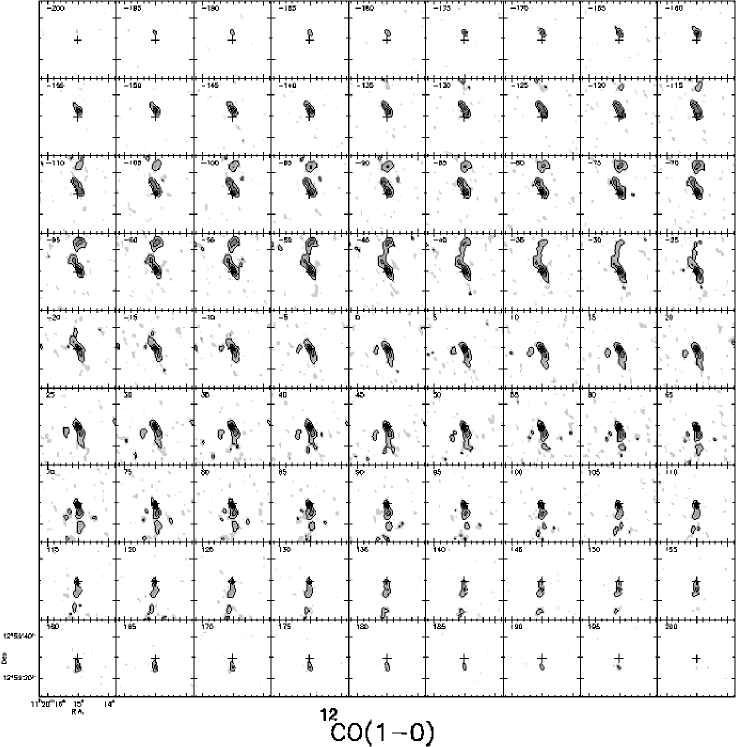
Figures 6 and 7 show the velocity-channel maps of 12CO(1–0) and 12CO(2–1) emission, respectively, in the central region of NGC 3627. The inner 12CO emission of the galaxy exhibits signatures of non-circular motions both at negative and positive velocities. These non-circular components are associated both with the 18″ bar-like structure and the spiral feature detected beyond the bar-like structure and will be discussed in detail later, in Sect. 4.5, where we analyze the rotation curve derived with our 12CO data.
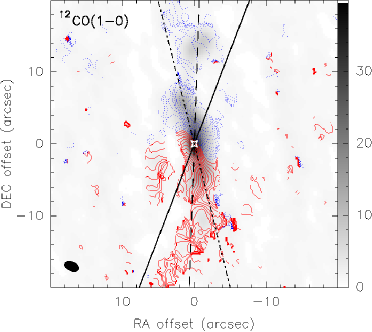
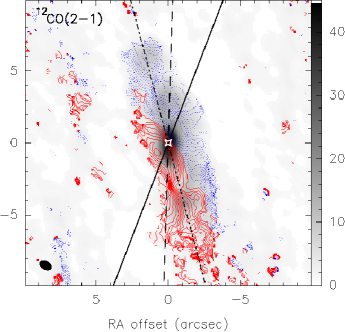
12CO(1–0) isovelocity contours (first-moment map) are superposed on the 12CO(1–0) integrated intensity in Figure 8 (left panel). The white star indicates the dynamical center of the galaxy, assumed coincident with the phase tracking center of our observations, and the velocities are relative to the systemic heliocentric velocity, = 744 km s-1 (see Sect. 4.1). The dashed line traces the position angle of the major axis of the observed region, PA = 178∘ 1∘ (almost vertical), obtained by maximizing the symmetry in the position velocity diagrams. This position angle is close to that of the entire galaxy, as given by the surface brightness profiles (172∘, see Sect. 5.2), and given in the Uppsala General Catalog (173∘). The dot-dashed line traces the position angle of the major axis of the bar-like structure, PA = 14∘ 2∘. The right panel of Fig. 8 shows 12CO(2–1) isovelocity contours on the 12CO(2–1) integrated intensity, where the position angle of the major axis of the observed region is very similar to that found for the 12CO(1–0) inner region (PA = 15∘ 2∘). The continuous lines, in the left and right panels of Fig. 8, show the PA of the stellar bar identified in the NIR with the -band 2MASS image (PA = ) [see below the left panel of Fig. 16 and Sect. 5.2]. The different PAs of the stellar bar and the molecular gas bar-like structure suggest that the gas is leading the stellar bar. Signatures of non-circular motions are visible also in Fig. 8, since the isovelocity contours appear severely tilted along the molecular gas bar-like structure both in 12CO(1–0) and 12CO(2–1).
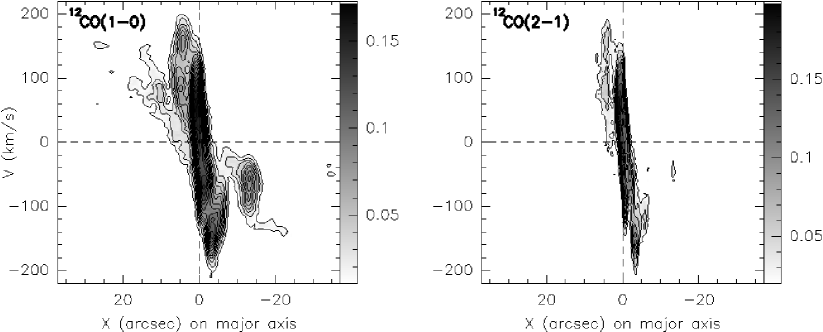
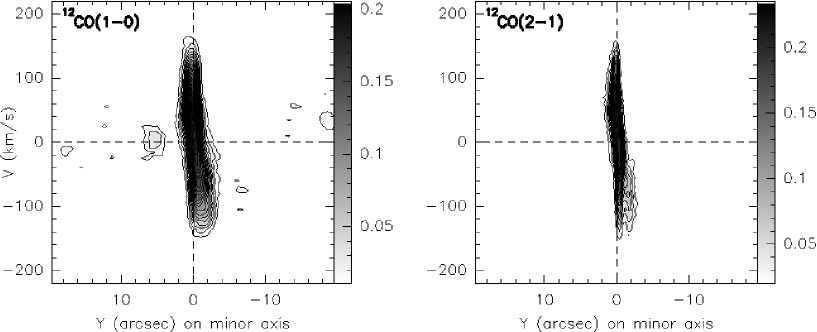
Figures 9 and 10 show position-velocity (p-v) cuts along the major (PA = 178∘) and minor axis (PA = 88∘) of NGC 3627, respectively. In both figures, the 12CO(1–0) emission is given in the left panel and 12CO(2–1) in the right. Our p-v plots along major axis are consistent with the 12CO(1–0) p-v diagram obtained by Regan et al. (2002), where the different velocity range between nuclear region and bar ends is yet clearer, because they mapped in 12CO(1–0) the whole galaxy. Regan et al. (2002)’s p-v diagram (Fig. 5a in their paper) shows that the components we found at 10–15″ from the center at velocities of 60–80 km s-1 (not corrected for inclination) maintain this velocity also at larger radii (until 50″ from the center), and then again increase and reach the velocity assumed by bar ends.
4.5 CO rotation curve and dynamical mass
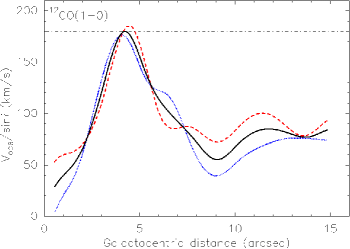
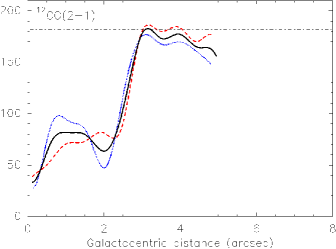
We have derived a rotation curve (RC) from the p-v diagram along the kinematic major axis of NGC 3627 (PA = 178 ∘). By fitting multiple gaussian profiles to the spectra across the major axis we calculated the terminal velocities, and the fitted velocity centroids, corrected for inclination (, 613), give for each galactocentric distance. Figure 11 shows RCs for 12CO(1–0) [left] 12CO(2–1) [right], where for each line we plotted both the two curves derived from either side of the major axis and their combination into a average by spline interpolation. This interpolation is justified by the similar behavior of the positive velocity curve and the negative velocities for both lines.
The 12CO(1–0) RC reaches a maximum of 180 km s -1 (velocity corrected for inclination) at r43 (0.2 kpc), and then decreases until velocities between 60 km s -1 and 85 km s-1 maintaining these velocities until 15″ (0.74 kpc) from the center (Fig. 11, left panel). The 12CO(2–1) RC shows a similar maximum velocity, 183 km s-1, reached at r5″(Fig. 11, right panel). At larger distances from the nucleus (r15″), we expect that the RC again increases until 180 km s-1, the velocity at the ends of the bar, consistently with p-v plots mapping the whole galaxy (e.g., Regan et al. 2002). Asymmetries are also seen in the H RC of NGC 3627 (Chemin et al. 2003), both in the inner disk (between 25″and 34″from the nucleus, already outside the range of our 12CO observations) and at larger radii (88″). The form of the RC of NGC 3627, with remarkable dips in velocity near the nucleus, is not unusual for galaxies with circumnuclear bars or gas disks (e.g., Rubin et al. 1997).
Such behavior often reflects non-circular motions depending both on the internal structure of the galaxy (e.g., the bar and consequent streaming motions) and the orbital parameters of the interaction with nearby companions. Another important source of non-circular motions may be the kinematic feedback to the gas from star formation (Beauvais & Bothun 1999). Regions of intense SF and turbulent motions in those regions may lead to an increase in the local velocity dispersion. In NGC 3627, the dips may be due to all three mechanisms, a combination of the effects of the interaction, the strong bar, and the kinematic feedback to the gas from SF.
From the RC, we can estimate the dynamical mass within a certain radius with the formula where is in , in kpc, in km s-1, and is a factor related to the geometry. The choice of to use in the above formula is complicated by the presence of dips in the RC (Fig. 11). Although these dips are due to non-circular motions, at larger radii both CO (e.g., Regan et al. 2002) and Hi (e.g., Zhang et al. 1993; Haan et al. 2008) RCs are flat and at the same velocity found at the bar ends. We can thus estimate the dynamical mass using the maximum velocity of 180 km s-1 (corrected for inclination) reached at 210 pc from the center.
Assuming for a value of 0.8, intermediate between the value appropriate for a spherical distribution (1.0) and that for a flat disk (0.6), the above formula gives a dynamical mass of M M⊙ within a radius of 43 (0.2 kpc). Continuing to neglect non-circular motions and assuming a roughly flat RC also at larger radii, the dynamical mass should be M M⊙ within a radius of 21″ (1 kpc). In the same region, we estimate a H2 mass of 6.0 M⊙ (see Sect. 4.2), 10% of the dynamical mass. Zhang et al. (1993) found a dynamical mass of M (value scaled to our adopted distance of Mpc) within a radius of 23″, a value consistent with our determination in a similar region, considering uncertainties from a different assumed inclination and rotation velocity. Moreover, Zhang et al. (1993) found a ratio M/Mdyn11% within the radius of 23″, similar to our value. Nevertheless, because of the clear signature of non-circular motions in the RC, our estimate of dynamical mass is very uncertain, probably 50%.
5 Comparison with other data
Here we present a comparison of our 12CO observations and images at other wavelengths available for NGC 3627. These comparisons allow both to assess possible correlations between different tracers of the ISM and to determine the location of the dynamical resonances, useful for probing gas inflow in the circumnuclear region of the galaxy. All images have been centered on the phase tracking center of our 12CO interferometric observations (see Table 1), and -when necessary- properly rotated with North up and E left.
5.1 Another CO map: NUGA vs. BIMA SONG
The left panel of Figure 12 shows the BIMA SONG 12CO(1–0) emission image of NGC 3627. This image reveals, like in the optical, a nuclear barred structure and a pronounced and asymmetric spiral pattern. A close-up of the inner 40″of the BIMA SONG 12CO(1–0) map with our 12CO(1–0) contours overlaid, as in Fig. 4 (left panel), is shown in the right panel of Fig. 12. The two 12CO data sets agree quite well; the only significant disagreement is present toward the south, where our higher-resolution 12CO(1–0) contours delineate a barred structure that develops mainly toward the south, while the BIMA SONG 12CO(1–0) emission is more rotated toward the east/south-east.
5.2 Near- and mid-infrared emission
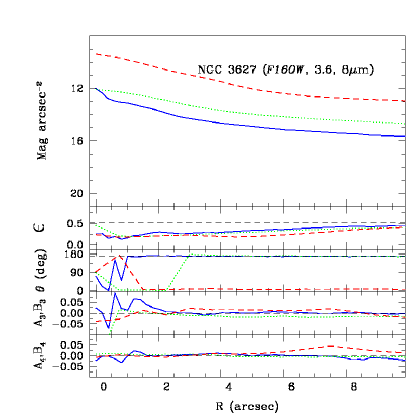
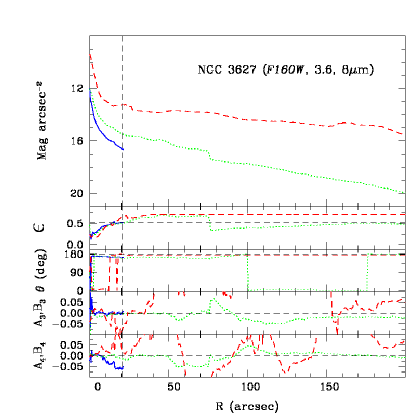
NIR images of NGC 3627 have been used both to derive the surface brightness profiles and to perform comparisons with our 12CO observations. We compared the surface brightness profiles of the ground- and space-based images by extracting elliptically averaged profiles, centered on the brightness peaks. The position angle and ellipticity were allowed to vary in the ellipse fitting. These radial profiles are shown in Figure 13, where the dashed horizontal lines in the lower panels correspond to the adopted position angle (PA) and inclination (i). The three profiles (HST F160W represented by the solid (blue) line, IRAC 3.6 m by the dotted (green) line, and IRAC 8 m by the dashed (red) line) are quite similar, in particular the HST F160W and the IRAC 3.6 m profiles show a similar trend within the inner 10″. Also shown are the runs of ellipticity , ellipse position angle , and residuals of the ellipse fitting. The adopted PA is 178∘ (see Sect. 4.4), similar to the fitted PA of 172∘. The inclination computed from the elliptical fits of the IRAC 3.6 m image converges to 61.3∘, very close to the inclination given by NED, 62.5∘.
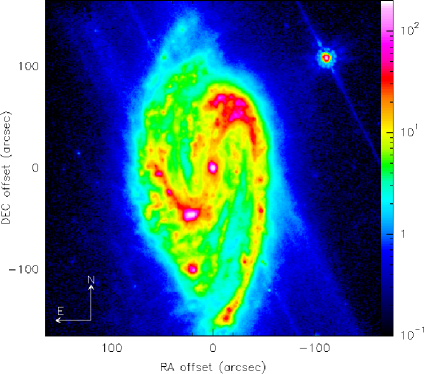
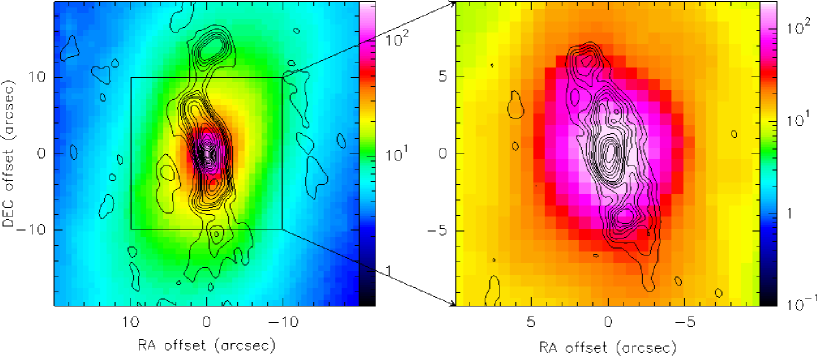
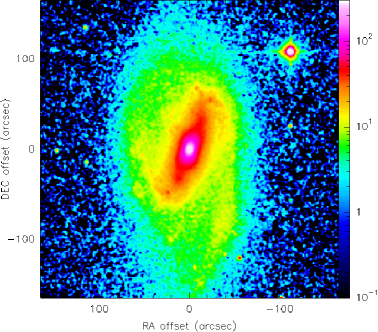
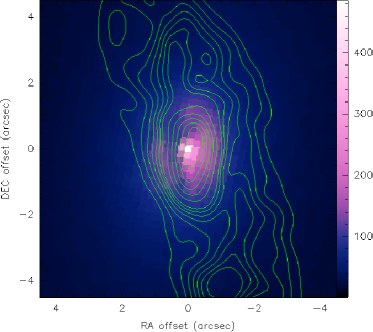
Figure 14 shows a large-scale view of NGC 3627 at 8 m (Spitzer-IRAC). The longest-wavelength 8 m IRAC band is dominated by PAHs and perhaps some hot dust continuum emission. This figure clearly reveals a spiral pattern, asymmetric with respect to the major axis, and heavy dust lanes, signature of a strong density wave action. This image also shows an evident perturbed morphology of the eastern arm. The bulk of the inner warm dust emission appears configured in a smooth elongated (north/south) disk, but the large-scale bar seen in the BIMA-SONG CO image is clearly reflected in the 8 m emission.
Figure 15 shows the stellar morphology traced by the 3.6 m (Spitzer-IRAC) emission in the circumnuclear region of NGC 3627, with overlaid 12CO(1–0) [left panel] and 12CO(2–1) [right panel] intensity contours. This comparison shows that the large-scale 3.6 m stellar bar and the molecular gas bar-like feature have different orientation in the plane of the galaxy. The stellar bar has a PA of , while the molecular bar has a PA of 14∘ in 12CO(1–0) and 15∘ in 12CO(2–1) [see Sect. 4.4]. This difference in orientation suggests that the molecular gas is leading the stellar bar. The right panel of Fig. 13 shows clear signatures of a bar-like feature at 3.6 m at a radius of 60-70″: the surface brightness undergoes an inflection; the ellipticity dips; and the PA changes slightly. The bar would thus have a radius between 3 and 3.4 kpc.
The 1.6 m (-band, 2MASS) large-scale morphology of NGC 3627 is shown in the left panel of Figure 16. Most of the stellar mass in a typical galaxy is locked up in cool stars, whose light is emitted longward of 1 m. Since the stellar spectrum tends to peak around 1.6 m, corresponding to the -band NIR window, 1.6 m emission is an effective tracer of stellar mass. Like the emission at 3.6 m, the 1.6 m morphology of NGC 3627 is much smoother than that found at 8 m (Fig. 14); the former maps trace the older stellar population, while the latter is tracing the sites of star formation which tend to be clumpy, with a more inhomogeneous distribution. Like the 3.6 m emission, the -band image shows a large-scale stellar bar with PA = and a radius of roughly 3-3.4 kpc (60-70″).
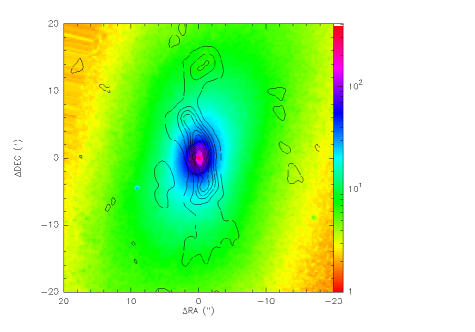
Another -band image of NGC 3627 is available thanks to the F160W filter on the HST/NIC3 camera, described in Sect. 2.4. Although the smaller FOV of the NIC3 camera (51″51″), the superior spatial resolution of the F160W/HST -band image (02), compared with that of the -band 2MASS image (25), allows to visualize more in detail the nuclear region of NGC 3627. The right panel of Fig. 16 shows the inner 9″of NGC 3627 of the F160W/HST -band image with overlaid 12CO(2–1) contours (in green) as in Fig. 4 (left panel). Although the morphology of the nuclear 12CO(2–1) emission is more elongated relative to the 1.6 m (F160W/HST) one, the sizes of the two inner (3″) distributions are similar and the two central peaks coincide. The central emission at 1.6 m is distributed in a disk, with a central peak and a depression toward the NE caused by dust extinction. The dust feature gives a clue about the orientation of the galactic disk. Because dust on the near side of the galaxy obscures what is behind it, we can deduce that the eastern side is closer than the western side. Such an orientation would be consistent with the blue-shifted velocities toward the north (see Fig. 8), and the expectation that the spiral arms should be trailing.
5.3 Far-infrared emission
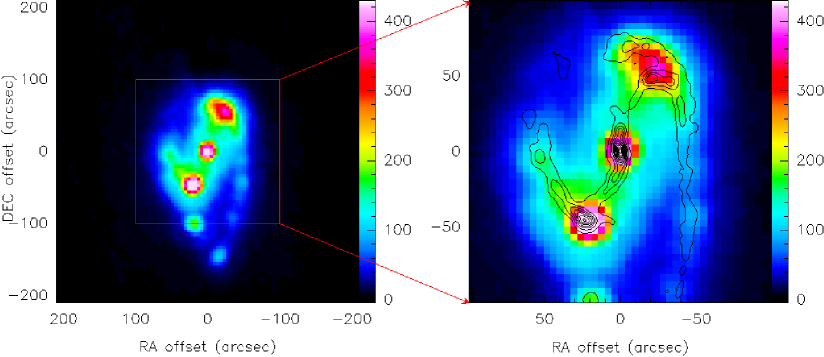
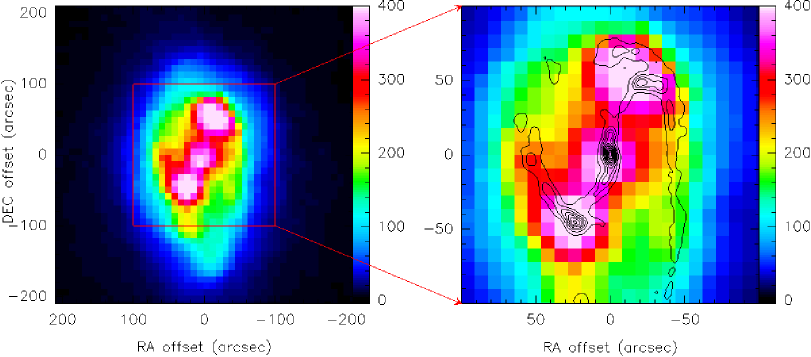
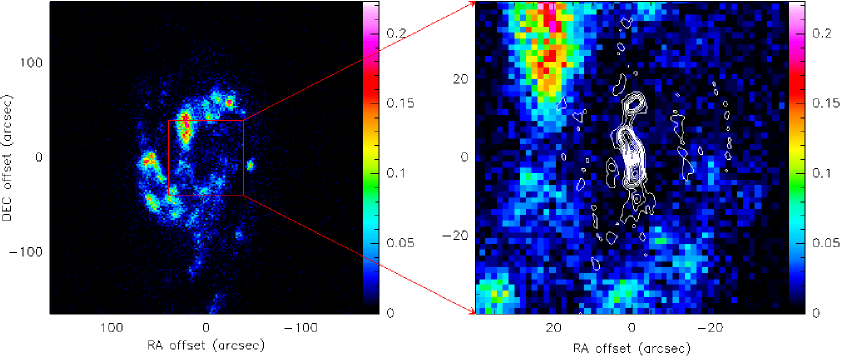
Most of the dust mass in galaxies is relatively cool, radiating primarily at wavelengths of the Spitzer-MIPS 70 and 160 m bands. The left panels of Figures 17 and 18, which display the inner 420″of the Spitzer-MIPS 70 and 160 m images of NGC 3627, respectively, show that the dust emission is intensified at the nucleus and at the ansae at the ends of the bar. The right panels of these figures display the BIMA 12CO(1–0) integrated intensity contours overlaid on the Spitzer-MIPS 70 m image (Fig. 17) and the Spitzer-MIPS 160 m image (Fig. 18) for the inner 200″ of NGC 3627. These comparisons show a very good correlation between the dust emission peaks and the 12CO emission along the bar. These regions with strong dust and 12CO emission could be the “highly obscured star-forming regions” identified by Prescott et al. (2007) by comparing 24 m and H maps. This dust-CO correlation is particularly important in terms of SF, discussed below in Sect. 5.5.
5.4 Far-ultraviolet morphology
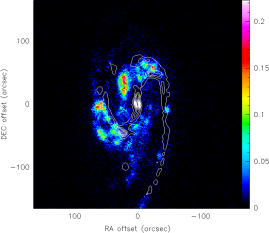
The left panel of Figure 19 shows the FUV image of NGC 3627 obtained with the GALEX satellite, described in Sect. 2.4. It can be seen that NGC 3627 has an asymmetric spiral structure in the FUV outside the range of our 12CO observations, as seen at other wavelengths (IR, but also 12CO from BIMA SONG survey). There is an inner elongated (north/south) ring delimiting a “hole”, or rather a net depression in the FUV emission around the nucleus. Along the edge of this ring, the FUV emission is not homogeneously distributed, but its north/northeastern arc exhibits FUV emission in the form of several clumps stronger than the rest of the ring. In the FUV, the eastern spiral arm, less extended, appears more luminous than the western one, while in the IR (8 m [Fig. 14] and 1.6 m [Fig. 16]) the two spiral arms are equally intense. The implication is that dust is suppressing the emission of the western arm. A similar ring is visible also in Hi (Haan et al. 2008, 2009), larger than in the FUV GALEX emission but with the same elongated (north/south) morphology. The right panel of Fig. 19 shows our 12CO(1–0) contours as in Fig. 4 (left panel) superimposed on the FUV GALEX image for the inner 80″of NGC 3627. The 12CO bar-like structure is contained in the inner hole observed in the FUV, indicating an anti-correlation between 12CO and FUV. The same anti-correlation is observable by comparing the FUV GALEX image with BIMA 12CO(1–0) contours, as displayed in Figure 20. Although the large scale views of the galaxy in FUV and 12CO(1–0) are similar (as demonstrated by the extension of the arms, especially the western one), in Fig. 20 we can appreciate some offsets between the two emissions. Shifts between molecular gas and FUV peaks are present along both spiral arms, and the strongest FUV peak, along the ring in the north/northeast direction, has no counterpart in molecular gas emission.
Offsets and anti-correlations between FUV and 12CO (or FIR and Hi) emissions have also been seen in other spiral galaxies such as M 100 (Rand 1995; Sempere & García-Burillo 1997; Calzetti et al. 2005), M 51 (Calzetti et al. 2005), and NGC 3147 (Casasola et al. 2008a). These anti-correlations may relate to star formation efficiency and timescale variations in response to a spiral density wave. The SF and its related tracers are often located in different regions of a galaxy: FUV emission is more prominent at the outer edge of the spiral arms, where typically dust extinction is low, while FIR emission is stronger at the inner edge.
The FUV-CO anti-correlation found in NGC 3627 is particularly interesting in terms of the Kennicutt-Schmidt (KS) law (Kennicutt 1998), which relates the star formation rate (SFR) density () to the gas surface density (). Bigiel et al. (2008) have found that at high gas surface densities, when the gas is predominantly molecular, the KS law is linear (, with 1) and a correlation between FUV and CO is expected. However, more than one factor may disturb the KS correlation, especially on small spatial scales. First, FUV traces older SF episodes than either H or 24 m emission; hence the sites of potential future SF (as traced by CO) may be disconnected from past SF sites (FUV). Second, feedback from massive stellar winds and supernovae may disrupt the ISM on small spatial scales and degrade the KS correlation. Finally, if the molecular gas is not in dynamical equilibrium, perhaps through the action of the large-scale bar, it would not be expected to be associated with sites of current SF. The lack of correlation in the context of the KS law for this and other NUGA galaxies will be discussed in a forthcoming paper dedicated to this topic.
5.5 Star formation in NGC 3627
The FIR luminosity is often used as a measure of the current star formation rate (SFR), since it is assumed that FIR emission is mainly due to dust heating by massive young stars. The total IR luminosity of NGC 3627 is 1.3 erg s-1, according to the precepts of Draine & Li (2007) and with fluxes from Dale et al. (2005). This corresponds to a SFR of M⊙ yr-1 (Kennicutt 1998). In the bulge of NGC 3627, there is little observed SF (Smith et al. 1994; Regan et al. 2002), and the SFR given by H within a nuclear region of diameter 16″ is 0.078yr-1 (Regan et al. 2002), 3 times lower than found in the bar itself, and 4 times lower than the spiral arms (Regan et al. 2002). Part of this deficit in the nuclear H-derived SFR may arise from dust extinction, given that the mean AV in the inner 50″ (diameter) is 2 mag (Calzetti et al. 2007). In any case, in NGC 3627, most of the SF is extranuclear, along the bar, particularly where it terminates and the spiral arms emerge (see Figs. 17 and 18).
The 70 m emission is confined mainly to the nucleus and the bar, particularly the ansae (see Fig. 17). The 160 m emission (albeit with lower resolution), is more broadly distributed, especially around the bar. This IR morphology suggests that the dust along the bar is warmer than around the bar, probably heated by the massive stars in the recent star-formation episodes.
In galaxies with weak SF activity (e.g. NGC 4736, Smith et al. 1994), dust heating by non-OB stars may also contribute significantly (e.g., de Jong et al. 1984; Bothun et al. 1989). This more quiescent heating source may be especially important in the central regions of early/type spiral galaxies with massive bulges and little nuclear or circumnuclear SF, such as NGC 3627. The ratio of FIR to H luminosity for the bulge of NGC 3627 is of 8100, significantly larger than for the star-forming regions in this galaxy, between 1000 and 2000. The L(FIR)/L(H) ratio is also higher than can be accounted for by obscured SF with a normal initial mass function, using extinction measurements derived from 12CO(1–0) and FIR data (Smith et al. 1994). Thus, the older stars probably contribute significantly to the dust heating in the bulge of NGC 3627 (Smith et al. 1994).
A low nuclear SFR is consistent with the CO/HCN ratio (10) discussed in Sect. 3. Higher ratios suggest that excitation by SF is dominant over AGN excitation in the circumnuclear region, but we found a “normal” CO/HCN ratio for NGC 3627, not surprisingly given its low SFR.
6 Computation of the torques on the molecular gas
The gravitational torques derived from the stellar potential in the inner region of NGC 3627 allow to account for the gas kinematics derived from CO and examine the efficiency of gravitational torques exerted on the gas. As described in previous NUGA papers (e.g., García-Burillo et al. 2005), to compute the gravitational torques we assume that NIR images give the best approximation for the total stellar mass distribution, being less affected than optical images by dust extinction or stellar population bias.
6.1 Evaluation of the gravitational potential
We computed the torques using both HST-NICMOS F160W and Spitzer-IRAC 3.6 m images. They yield complementary results, the torques computed from the HST-NICMOS F160W image compared with the 12CO PdBI contours allow to investigate the nuclear region of NGC 3627, while the torques derived from the Spitzer-IRAC image in combination with the 12CO BIMA contours are much better adapted to visualize the whole spiral structure of the galaxy. We perform the subtraction of foreground stars, deprojection, and resampling, as described in other NUGA papers (e.g., García-Burillo et al. 2005).
Here, we briefly recall some definitions and assumptions used to evaluate the gravitational torques. NIR images are completed in the vertical dimension by assuming an isothermal plane model with a constant scale height, equal to 1/12th of the radial scale-length of images. With a Fourier transform method we derive the potential and we assume a constant mass-to-light (M/L) ratio able to reproduce the observed 12CO RCs. Beyond a radius of 20″(or 1.96 kpc in diameter), the mass density is set to 0 in the HST-NICMOS F160W image, thus suppressing any spurious terms. This assumption is sufficient to compute the potential over the PdBI 12CO(1–0) primary beam. For the Spitzer-IRAC 3.6 m image, this radius truncation is done at 169″(or 16.6 kpc in diameter).
For the non-axisymmetric part of the potential , we decompose in Fourier components (-modes), following Combes & Sanders (1981):
where and are the amplitude and phase of the -mode, respectively.
The strength of each -Fourier component, , is defined by the ratio between tangential and radial forces, . The strength of the total non-axisymmetric perturbation is defined by:
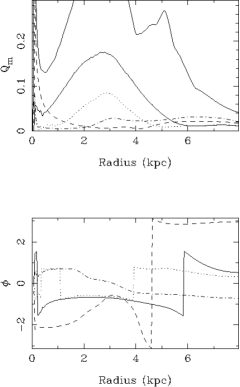
where and represent the maximum amplitude of the tangential force and the mean axisymmetric radial force, respectively. Figure 21 shows the strengths (top panel) and phases (bottom panel) vs. radius for the Spitzer-IRAC 3.6 m image and for the first components.
6.2 Evaluation of the gravity torques
The forces per unit mass ( and ), obtained from the derivatives of on each pixel, allow to compute the torques per unit mass by:
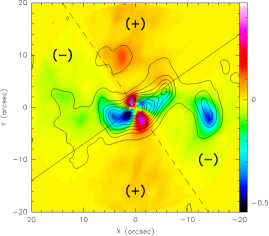
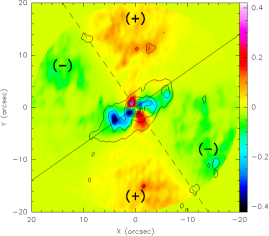
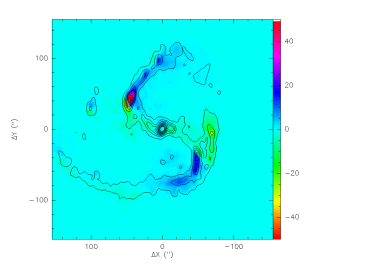
The torque map is oriented according to the sense of rotation in the plane of the galaxy. The combination of the torque map and the gas density map allows to derive the net effect on the gas at each radius. Figures 22 and 23 show gravitational torque maps, computed from the HST-NICMOS F160W image, weighted by the gas surface density , normalized to their maximum value, for NUGA PdBI 12CO(1–0) and 12CO(2–1), respectively. The difference in orientation between the large-scale bar and the major axis of the galaxy (19∘ in the sky plane) implies that the deprojected difference in PAs is 35∘. In both figures, the continuum line is oriented along the large-scale bar in the plane of the galaxy (PA = 35∘), the dashed one orthogonally to the continuum line. In the two quadrants labeled with (+) the torques are positive, while in those labeled with (-) the torques are negative. The derived torques change sign following a characteristic 2D butterfly pattern produced by the bar. Figure 24 shows the gravitational torque map, derived from the Spitzer-IRAC 3.6 m image, weighted by the gas surface density , normalized to their maximum value, for BIMA 12CO(1–0). The observed gas distribution is representative of the time spent by a molecular cloud on a typical orbit at this location.

By using as the actual weighting function, we first compute the torque per unit mass averaged over azimuth:
where is, for definition, the time derivative of the specific angular momentum of the gas averaged azimuthally, =. Then, to have dimensionless quantities, we normalize this variation of angular momentum per unit time to the angular momentum at this radius and to the rotation period. Finally, we estimate the efficiency of the gas flow as the average fraction of the gas specific angular momentum transferred in one rotation () by the stellar potential, as a function of radius:
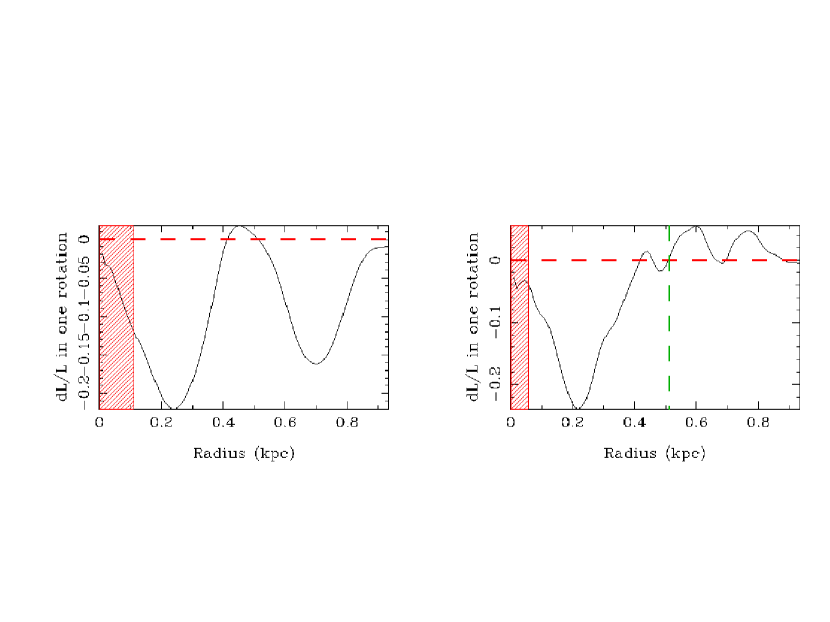
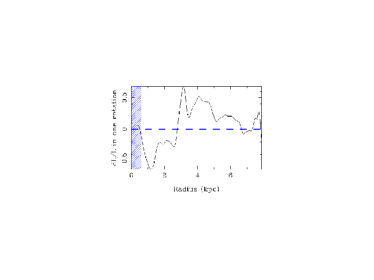
where is assumed to be well represented by its axisymmetric estimate, . Figures 25 show curves computed with the HST-NICMOS F160W image for NGC 3627 derived from the PdBI 12CO(1–0) [left] and the 12CO(2–1) [right] data. The (red) dashed area corresponds to the resolution limit of our observations. In the left panel, the 12CO(1–0) map resolution is 125 pc, while in the right panel the 12CO(2–1) map resolution is 59 pc. In the right panel, the (green) vertical dashed line at 0.51 kpc indicates the 12CO(2–1) FOV at the PdBI. These figures show that the torques are negative within the inner 0.4 kpc, down to the resolution limit of our observations, and reach a (negative) peak at 0.2 kpc for both 12CO(1–0) and 12CO(2–1). For 12CO(1–0), they oscillate and become negative again at 700 pc. This second (negative) peak is not present in 12CO(2–1), because it is outside the 12CO(2–1) FOV. Figures 26 show NUGA PdBI 12CO(1–0) [left] and the 12CO(2–1) [right] contours overlaid on the HST-NICMOS F160W image. This figure clearly shows that the gas is leading the bar (the sense of the rotation is direct) since the PA of the bar is , while the bulk emission of the molecular gas is distributed along a bar-like structure with a PA of for the 12CO(1–0) line and of for the 12CO(2–1) one (see Fig. 8 and Sect. 4.4). This explains the negative torques observed in Figs. 25.
Figure 27 shows the large-scale curves computed with the Spitzer-IRAC 3.6 m image and the BIMA-SONG images. The (blue) dashed area corresponds to the resolution limit of BIMA observations, 670 pc. In this figure, the torques are negative within the inner 3 kpc, down to the resolution limit of BIMA maps, and positive at larger radii. Resonances in barred galaxies are related to the pattern speed of the stellar bar, which can be inferred from the angular velocity at the corotation (CR) radius. In early-type barred galaxies, CR is located near the end of the bar between and (Elmegreen 1996). As said before, in NGC 3627, the torques are negative within the inner 3 kpc, and the radius of 3 kpc would correspond to the end of the bar, or to the CR radius estimated by Chemin et al. (2003) between 2.6 and 3.7 kpc. The large-scale gas response inside the bar is twisted, i.e., the gas appears along the bar leading edges (see Fig. 4). This is due to the dissipation there where the torques act, and it is a scenario which does not require any inner Lindblad resonance (ILR). In any case, the PdBI-based torques from the NICMOS image (Fig. 25) are more reliable in the center than the ones inferred from BIMA observations and the IRAC image (Fig. 27) because of the higher spatial resolution of the PdBINICMOS.
7 Dynamical interpretation
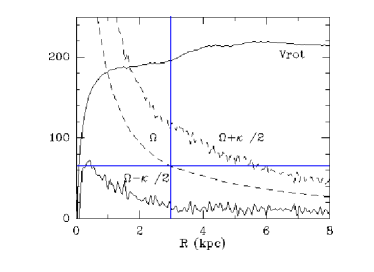
Figure 28 shows the model RC (Vrot) obtained from the Spitzer-IRAC 3.6 m image, and the derived frequencies , , and for NGC 3627. We have also derived a model RC from the HST-NICMOS F160W image, which is identical to the model RC from the Spitzer-IRAC 3.6 m image until 1.3 kpc from the center (it is not shown in the figure because it adds no new information). The model RC has been calibrated to the H RC derived from Chemin et al. (2003), to have V = 212 km s-1 at 8 kpc. Fig. 28 shows that if the stellar bar ends at 3 kpc (blue vertical line), with a pattern speed of the bar 65 km s-1 kpc-1 (blue horizontal line) then the CR of the bar would be at 3.3 kpc, consistent with the results of Chemin et al. (2003) who estimated the CR radius between 2.6 and 3.7 kpc. The curve could be marginally compatible with an ILR at r = 500 pc, but because there is no clear ring signature in the morphology, we exclude the presence of an ILR. In addition, since there is a strong bar, true precessing rate is lower than the epicyclic approximation curve, and therefore the curve is only an upper limit. Hence there is probably no ILR. The absence of an ILR was already discussed in Sect. 6.2, where we elaborated such a scenario.
The pattern speed of NGC 3627 has been measured by several authors. Chemin et al. (2003) have assumed that the inner ring-like feature found by Regan et al. (2002) but not by us, corresponds to the location of an ultra-harmonic resonance. Rand & Wallin (2004), using the BIMA SONG data and the Tremaine-Weinberg method, have measured a pattern speed of the bar of 50 km s-1 kpc-1, in good agreement with our determination.
In the presence of an ILR, the torques should be negative between the CR of the bar and the ILR. For NGC 3627, without an ILR, the torques are negative between the CR of the bar and the AGN, down to the resolution limit of our observations. Such a conclusion would be the natural outcome of a scenario in which a young and rapidly rotating bar has had no time to slow down due to secular evolution, and has not yet formed any ILR. The presence of molecular gas inside the ILR of the primary bar, or where we expect that the ILR will form, makes NGC 3627 a potential smoking gun of inner gas inflow. In this scenario, the gas there is certainly fueling the central region, and in a second step could fuel directly the AGN. Finding smoking gun evidence of AGN fueling is proving to be quite challenging, perhaps because of the short-lived nature of the mechanisms responsible.
8 Summary and conclusions
The molecular gas, traced by 12CO(1–0) and 12CO(2–1) transitions, in the interacting barred LINER/Seyfert 2 galaxy NGC 3627 is distributed along a bar-like structure of 18″ (900 pc) diameter (PA = 14∘) with two peaks at the extremes. The 1.6 m -band 2MASS and 3.6 m Spitzer-IRAC images of NGC 3627 show a stellar bar in the nucleus with PA = , different from the PA (= ) of the molecular gas bar-like structure, suggesting that the gas is leading the stellar bar. Instead, the GALEX FUV emission of NGC 3627 displays an inner elongated (north/south) ring delimiting a hole around the nucleus and containing the 12CO 18″ bar-like structure. This kind of anti-correlation between FUV, molecular gas, and the stellar bar is perhaps related to star formation efficiency and timescale variations in response to a spiral density wave. The gravity torques exerted by the stellar potential on the gas computed with the HST-NICMOS F160W image and our PdBI maps are negative within the inner 0.4 kpc, down to the resolution limit of our observations.
The torques computed with the Spitzer-IRAC 3.6 m image and BIMA 12CO map (with a resolution limit of 670 pc) are also negative within the inner 3 kpc. If the bar ends at 3 kpc, with a pattern speed of the bar 65 km s-1 kpc-1 then the CR of the bar would be at 3.3 kpc. There is no clear ring signature and we thus exclude the presence of an ILR. Without an ILR, the torques are negative between the CR of the bar and the AGN, down to the resolution limit of our observations. This scenario is compatible with a young/incipient bar which had no time to slow down from secular evolution, and has not yet formed any ILR. NGC 3627 is a potential smoking gun of inner gas inflow: the gas is certainly fueling the central region, and in a second step could fuel directly the AGN.
NGC 3627 is the fifth smoking gun NUGA galaxy, together with NGC 6574 (Lindt-Krieg et al. 2008), NGC 2782 (Hunt et al. 2008), NGC 3147 (Casasola et al. 2008a), and NGC 4579 (García-Burillo et al. 2009). The common feature shared by these galaxies is a slowly rotating stellar bar (or oval) with overlapping dynamical resonances (Casasola et al. 2008b) associated with kinematically decoupled inner bars or ovals. Such resonances and kinematic decoupling are fostered by a large central mass concentration and high gas fraction. NGC 3627 is the unique potential smoking gun NUGA galaxy with only one slowly rotating stellar bar. For NGC 3627, this drives a molecular bar-like structure, apparently sufficient to transport the gas toward the AGN that, in a second step, could fuel directly the active nucleus.
Acknowledgements.
The authors would like to thank the referee, Greg Bothun, whose comments have been very useful for improving the original version of the paper. We thank the scientific and technical staff at IRAM for their work in making our 30 m and PdBI observations possible. This research has made use of the NASA/IPAC Extragalactic Database (NED), HyperLeda Database, IRAS Catalog, Spitzer archive, and images.References
- Beauvais & Bothun (1999) Beauvais, C., & Bothun, G. 1999, ApJS, 125, 99
- Bigiel et al. (2008) Bigiel, F., Leroy, A., Walter, F., Brinks, E., de Blok, W. J. G., Madore, B., & Thornley, M. D. 2008, AJ, 136, 2846
- Böker et al. (1999) Böker, T., et al. 1999, ApJS, 124, 95
- Boone et al. (2007) Boone, F., et al. 2007, A&A, 471, 113 (NUGA VII)
- Bothun et al. (1989) Bothun, G. D., Lonsdale, C. J., & Rice, W. 1989, ApJ, 341, 129
- Braine & Combes (1992) Braine, J., & Combes, F. 1992, A&A, 264, 433
- Calzetti et al. (2005) Calzetti, D., et al. 2005, ApJ, 633, 871
- Calzetti et al. (2007) Calzetti, D., et al. 2007, ApJ, 666, 870
- Casasola et al. (2004) Casasola, V., Bettoni, D., & Galletta, G. 2004, A&A, 422, 941
- Casasola et al. (2008a) Casasola, V., Combes, F., García-Burillo, S., Hunt, L. K., Léon, S., & Baker, A. J. 2008a, A&A, 490, 61 (NUGA X)
- Casasola et al. (2008b) Casasola, V., et al. 2008b, “Tumbling, Twisting, and Winding Galaxies: Pattern Speeds along the Hubble Sequence” Conference, Padova, August 25-28, 2008, Memorie della Società Astronomica Italiana, arXiv:0811.1971
- Casasola et al. (2010) Casasola, V., Hunt, L. K., Combes, F., García-Burillo, S., Boone, F., Eckart, A., Neri, R., & Schinnerer, E. 2010, A&A, 510, A52 (NUGA XIII)
- Chemin et al. (2003) Chemin, L., Cayatte, V., Balkowski, C., Marcelin, M., Amram, P., van Driel, W., & Flores, H. 2003, A&A, 405, 89
- Combes & Sanders (1981) Combes, F., & Sanders, R. H. 1981, A&A, 96, 164
- Combes & Gerin (1985) Combes, F., & Gerin, M. 1985, A&A, 150, 327
- Combes et al. (2004) Combes, F., et al. 2004, A&A, 414, 857 (NUGA II)
- Combes et al. (2009) Combes, F., et al. 2009, A&A, 503, 73 (NUGA XII)
- Dahlem et al. (1996) Dahlem, M., Heckman, T. M., Fabbiano, G., Lehnert, M. D., & Gilmore, D. 1996, ApJ, 461, 724
- Dale et al. (2005) Dale, D. A., et al. 2005, ApJ, 633, 857
- de Jong et al. (1984) de Jong, T., Clegg, P. E., Rowan-Robinson, M., Soifer, B. T., Habing, H. J., Houck, J. R., Aumann, H. H., & Raimond, E. 1984, ApJ, 278, L67
- Draine & Li (2007) Draine, B. T., & Li, A. 2007, ApJ, 657, 810
- Elmegreen (1996) Elmegreen, B. 1996, IAU Colloq. 157: Barred Galaxies, 91, 197
- Ferrarese et al. (2001) Ferrarese, L., Pogge, R. W., Peterson, B. M., Merritt, D., Wandel, A., & Joseph, C. L. 2001, ApJ, 555, L79
- Filho et al. (2000) Filho, M. E., Barthel, P. D., & Ho, L. C. 2000, ApJS, 129, 93
- Gao & Solomon (2004) Gao, Y., & Solomon, P. M. 2004, ApJS, 152, 63
- García-Burillo et al. (1993) García-Burillo, S., Guelin, M., & Cernicharo, J. 1993, A&A, 274, 123
- García-Burillo et al. (2003) García-Burillo, S., et al. 2003, A&A, 407, 485 (NUGA I)
- García-Burillo et al. (2005) García-Burillo, S., Combes, F., Schinnerer, E., Boone, F., & Hunt, L. K. 2005, A&A, 441, 1011 (NUGA IV)
- García-Burillo et al. (2009) García-Burillo, S., et al. 2009, A&A, 496, 85 (NUGA XI)
- Gil de Paz et al. (2007) Gil de Paz, A., et al. 2007, ApJS, 173, 185
- Guilloteau & Lucas (2000) Guilloteau, S., & Lucas, R. 2000, Imaging at Radio through Submillimeter Wavelengths, 217, 299
- Haan et al. (2008) Haan, S., Schinnerer, E., Mundell, C. G., García-Burillo, S., & Combes, F. 2008, AJ, 135, 232
- Haan et al. (2009) Haan, S., Schinnerer, E., Emsellem, E., García-Burillo, S., Combes, F., Mundell, C. G., & Rix, H.-W. 2009, ApJ, 692, 1623
- Haynes et al. (1979) Haynes, M. P., Giovanelli, R., & Roberts, M. S. 1979, ApJ, 229, 83
- Heckman et al. (2004) Heckman, T. M., Kauffmann, G., Brinchmann, J., Charlot, S., Tremonti, C., & White, S. D. M. 2004, ApJ, 613, 109
- Helfer et al. (2003) Helfer, T. T., Thornley, M. D., Regan, M. W., Wong, T., Sheth, K., Vogel, S. N., Blitz, L., & Bock, D. C.-J. 2003, ApJS, 145, 259
- Ho et al. (1997) Ho, L. C., Filippenko, A. V., & Sargent, W. L. W. 1997, ApJS, 112, 315
- Hopkins & Hernquist (2006) Hopkins, P. F., & Hernquist, L. 2006, ApJS, 166, 1
- Hunt et al. (2008) Hunt, L. K., et al. 2008, A&A, 482, 133 (NUGA IX)
- Janiuk et al. (2004) Janiuk, A., Czerny, B., Siemiginowska, A., & Szczerba, R. 2004, ApJ, 602, 595
- Jogee et al. (2005) Jogee, S., Scoville, N., & Kenney, J. D. P. 2005, ApJ, 630, 837
- Kennicutt (1998) Kennicutt, R. C., Jr. 1998, ARA&A, 36, 189
- Kennicutt et al. (2003) Kennicutt, R. C., Jr., et al. 2003, PASP, 115, 928
- King & Pringle (2007) King, A. R., & Pringle, J. E. 2007, MNRAS, 377, L25
- Knapen et al. (2002) Knapen, J. H., Pérez-Ramírez, D., & Laine, S. 2002, MNRAS, 337, 808
- Krips et al. (2005) Krips, M., et al. 2005, A&A, 442, 479 (NUGA III)
- Krips et al. (2007) Krips, M., et al. 2007, A&A, 468, L63
- Krips et al. (2008) Krips, M., Neri, R., García-Burillo, S., Martín, S., Combes, F., Graciá-Carpio, J., & Eckart, A. 2008, ApJ, 677, 262
- Kuno et al. (2007) Kuno, N., et al. 2007, PASJ, 59, 117
- Lindt-Krieg et al. (2008) Lindt-Krieg, E., Eckart, A., Neri, R., Krips, M., Pott, J.-U., García-Burillo, S., & Combes, F. 2008, A&A, 479, 377 (NUGA VIII)
- Marecki et al. (2003) Marecki, A., Spencer, R. E., & Kunert, M. 2003, Publications of the Astronomical Society of Australia, 20, 46
- Mulchaey & Regan (1997) Mulchaey, J. S., & Regan, M. W. 1997, ApJ, 482, L135
- Nagar et al. (2000) Nagar, N. M., Falcke, H., Wilson, A. S., & Ho, L. C. 2000, ApJ, 542, 186
- Paladino et al. (2008) Paladino, R., Murgia, M., Tarchi, A., Moscadelli, L., & Comito, C. 2008, A&A, 485, 679
- Paturel et al. (2003) Paturel, G., Petit, C., Prugniel, P., Theureau, G., Rousseau, J., Brouty, M., Dubois, P., & Cambrésy, L. 2003, A&A, 412, 45
- Prescott et al. (2007) Prescott, M. K. M., et al. 2007, ApJ, 668, 182
- Ptak et al. (2006) Ptak, A., Colbert, E., van der Marel, R. P., Roye, E., Heckman, T., & Towne, B. 2006, ApJS, 166, 154
- Rand (1995) Rand, R. J. 1995, AJ, 109, 2444
- Rand & Wallin (2004) Rand, R. J., & Wallin, J. F. 2004, ApJ, 614, 142
- Regan et al. (2001) Regan, M. W., Thornley, M. D., Helfer, T. T., Sheth, K., Wong, T., Vogel, S. N., Blitz, L., & Bock, D. C.-J. 2001, ApJ, 561, 218
- Regan et al. (2002) Regan, M. W., Sheth, K., Teuben, P. J., & Vogel, S. N. 2002, ApJ, 574, 126
- Rubin et al. (1997) Rubin, V. C., Kenney, J. D. P., & Young, J. S. 1997, AJ, 113, 1250
- Sakamoto et al. (1999) Sakamoto, K., Okumura, S. K., Ishizuki, S., & Scoville, N. Z. 1999, ApJ, 525, 691
- Sempere & García-Burillo (1997) Sempere, M. J., & Garcia-Burillo, S. 1997, A&A, 325, 769
- Smith et al. (1994) Smith, B. J., Harvey, P. M., Colome, C., Zhang, C. Y., Difrancesco, J., & Pogge, R. W. 1994, ApJ, 425, 91
- Solomon & Barrett (1991) Solomon, P. M., & Barrett, J. W. 1991, Dynamics of Galaxies and Their Molecular Cloud Distributions, 146, 235
- Walter et al. (2008) Walter, F., Brinks, E., de Blok, W. J. G., Bigiel, F., Kennicutt, R. C., Thornley, M. D., & Leroy, A. 2008, AJ, 136, 2563
- Welch et al. (1996) Welch, W. J., et al. 1996, PASP, 108, 93
- Young et al. (1995) Young, J. S., et al. 1995, ApJS, 98, 219
- Zhang et al. (1993) Zhang, X., Wright, M., & Alexander, P. 1993, ApJ, 418, 100
- Zwicky (1956) Zwicky, F. 1956, PASP, 68, 121