Dense gas and the nature of the outflows ††thanks: The Appendix is only available in electronic form at http://www.edpsciences.org,††thanks: Haystack Observatory data as CLASS files are available in electronic form at the CDS via anonymous ftp to cdsarc.u-strasbg.fr (130.79.128.5) or via http://cdsweb.u-strasbg.fr/cgi-bin/qcat?J/A+A/vol/page
We present the results of the observations of the and the inversion transitions of the NH3 molecule toward a large sample of 40 regions with molecular or optical outflows, using the 37 m radio telescope of the Haystack Observatory. We detected NH3 emission in 27 of the observed regions, which we mapped in 25 of them. Additionally, we searched for the H2O maser line toward six regions, detecting H2O maser emission in two of them, HH265 and AFGL 5173. We estimate the physical parameters of the regions mapped in NH3 and analyze for each particular region the distribution of high density gas and its relationship with the presence of young stellar objects. In particular, we identify the deflecting high-density clump of the HH270/110 jet. We were able to separate the NH3 emission from the L1641-S3 region into two overlapping clouds, one with signs of strong perturbation, probably associated with the driving source of the CO outflow, and a second, unperturbed clump, which is probably not associated with star formation. We systematically found that the position of the best candidate for the exciting source of the molecular outflow in each region is very close to an NH3 emission peak. From the global analysis of our data we find that in general the highest values of the line width are obtained for the regions with the highest values of mass and kinetic temperature. We also found a correlation between the nonthermal line width and the bolometric luminosity of the sources, and between the mass of the core and the bolometric luminosity. We confirm with a larger sample of regions the conclusion of Anglada et al. (1997) that the NH3 line emission is more intense toward molecular outflow sources than toward sources with optical outflow, suggesting a possible evolutionary scheme in which young stellar objects associated with molecular outflows progressively lose their neighboring high-density gas, weakening both the NH3 emission and the molecular outflow in the process, and making optical jets more easily detectable as the total amount of gas decreases.
Key Words.:
ISM: jets and outflows – ISM: molecules – stars:formation1 Introduction
Over the last decades, a great effort has been made to study the processes that take place in the earliest stages of stellar evolution. It is now widely accepted that low-mass stars begin their lives in the densest cores of molecular clouds and that the earliest stages of stellar evolution are associated with processes involving a strong mass loss, traced by molecular outflows, Herbig-Haro objects, and optical jets, which emanate from the deeply embedded young stellar objects. These mass-loss processes have been proposed as a way to eliminate the excess of material and of angular momentum as well as to regulate the IMF (Shu, Adams & Lizano 1987). The molecular outflow phase is known as one of the earliest observable phases of the stellar evolution. Several studies indicate that most, if not all, of the Class 0 and Class I sources drive molecular outflows (e.g. Davis et al. 1999) and that an important fraction of these sources are associated with Herbig-Haro objects, as well as with molecular outflows (Eiroa et al. 1994; Persi et al. 1994). These results suggest that both phenomena start and coexist in the early stages of the star-formation process.
These outflows emanating from protostars collide with the remaining molecular cloud and disperse the surrounding material, and determine the evolution of the dense core where the star is born (Arce & Sargent 2006). In this sense, the study of these mass-loss processes and the molecular environment of the embedded objects from which they emanate has became an important tool in order to better understand the earliest stages of stellar evolution.
Ammonia observations have proved to be a powerful tool for studying the dense cores where the stars are born. Since the first surveys of dense cores (Torrelles et al. 1983, Benson & Myers 1989, Anglada et al. 1989), a clear link was established between dense cores, star formation and outflows (see e.g., the review of André et al. 2000). From these surveys, it was clearly established that the driving sources of outflows are usually embedded in the high-density gas, which is traced by the NH3 emission, and are located very close to the emission peak (Torrelles et al. 1983; Anglada et al. 1989). Following these results, Anglada et al. (1997) (hereafter Paper I) undertook a survey of dense cores to investigate the relationship between the type of outflow and the dense gas associated with their exciting sources. A statistical study of the sources observed in that survey reveals that the ammonia emission is more intense toward molecular outflow sources than toward sources with only optical outflows, indicating that molecular outflows are associated with a larger amount of high-density gas. From this result, a possible evolutionary scheme was suggested in which young objects associated with molecular outflows progressively lose their neighboring high-density gas, while both the NH3 emission and the molecular outflow become weaker in the process, and the optical jets become more easily detectable as the total amount of gas and extinction decreases. In this sense, the observations of high-density tracers, such as the NH3 molecule, confirm the decrease of high-density gas around the stars.
We present here new ammonia observations. Additional regions allow us to obtain a sample of outflow regions observed in ammonia that doubles the number used in Paper I. We selected a sample of 40 star-forming regions, taking into account the presence of molecular outflows, optical outflows, or both, and mapped with the Haystack 37 m telescope the NH3 emission around the suspected outflow exciting sources. In Sect. 2 we describe the observational procedure, in Sect. 3 we present the observational results (the discussion of individual sources is presented in Appendix A), in Sect. 4 we discuss the global results, in Sect. 5 we describe the relationship between the high-density gas and the nature of the outflow based on the sample, and in Sect. 6 we give our conclusions.
2 Observations
We observed the =(1,1) and the =(2,2) inversion transitions of the ammonia molecule with the 37 m radio telescope at Haystack Observatory111Radio Astronomy at Haystack Observatory of the Northeast Radio Observatory Corporation was supported by the National Science Foundation in 1993 January, 1996 May and 1997 December. At the frequencies of these transitions (23.6944960 GHz and 23.7226320 GHz, respectively), the half power beam width of the telescope was and the beam efficiency at an elevation of was for the observations made in 1993 and for the observations made in 1996 and 1997. In all the observing sessions, we used a cooled K-band maser receiver and a 5 000-channel autocorrelation spectrometer with a full bandwidth of 17.8 MHz. The calibration was made with the standard noise-tube method. All spectra were corrected for elevation-dependent gain variations and for atmospheric attenuation. The rms pointing error of the telescope was . Typical system temperatures were K, K and K for the observations made in 1993, 1996, and 1997, respectively. The observations were made in the position switching mode in 1993 and 1997 and in frequency switching mode in 1996. During the data reduction the observed spectra were smoothed to a velocity resolution of km s-1, achieving a sensitivity of K per spectral channel.
| Region | Reference Positiona𝑎aa𝑎a Position where the observations were centered | Observation | Outflowb𝑏bb𝑏bCO = Molecular outflow; HH = Isolated Herbig-Haro object; jet = Optical outflow; H2 = Molecular hydrogen outflow. | Ref. | Molecular | Ref. | Ref. | Alternative | ||
|---|---|---|---|---|---|---|---|---|---|---|
| Epoch | Type | Observations | (pc) | Name | ||||||
| M120.1+3.0-Nc𝑐cc𝑐c See Paper I for H2O results on IRAS 00213+6530 in this region | 1993 Jan | CO | 1 | - | - | 850 | 1 | - | ||
| M120.1+3.0-Sd𝑑dd𝑑dSee Paper I for H2O results on IRAS 00259+6510 in this region | 1993 Jan | CO | 1 | - | - | 850 | 1 | - | ||
| L1287 | 1993 Jan | CO | 2 | HCO+,HCN,CS,NH3 | 2,3,4,5 | 850 | 2 | RNO1B/1C | ||
| L1293 | 1993 Jan | CO | 6 | HCN,HCO+ | 6 | 6 | - | |||
| NGC 281 A-W | 1993 Jan | CO | 7 | CS,NH3,HCN,HCO+,C18O,C34S | 8,9,10,80 | 9 | S184 | |||
| HH 156 | 1997 Dec | jet | 11 | - | - | 140 | 11 | CoKu Tau 1 | ||
| HH 159 | 1996 May | jet, CO | 12,13 | - | - | 160 | 12 | DG Tau B | ||
| HH 158 | 1996 May | jet | 14 | C18O, CS | 15,16 | 160 | 14 | DG Tau | ||
| HH 31 | 1996 May | jet, CO? | 11,79 | CS,C18O | 17,18 | 160 | 23 | - | ||
| HH 265 | 1996 May | HH | 19 | CS,NH3,C18O | 81 | 160 | 20 | L1551MC | ||
| L1551 NE | 1996 May | CO, jet | 21,22 | - | - | 160 | 20 | L1551 | ||
| L1642 | 1993 Jan | CO, HH | 23,24 | HCO+,C18O | 25 | 200 | 25 | HH 123 | ||
| L1634 | 1996 May, 1997 Dec | CO,H2,jet | 26,27 | - | - | 460 | 28 | HH 240/241,RNO 40 | ||
| HH 59 | 1996 May | HH | 29 | - | 460 | 29 | - | |||
| IRAS 05358 | 1993 Jan | CO | 7 | HCN,HCO+,CS,NH3,C34S | 30,31,81 | 7 | - | |||
| L1641-S3 | 1993 Jan, 1996 May | CO | 32 | NH3,CS | 33,34 | 480 | 32 | - | ||
| HH 68 | 1996 May | HH | 29 | 460 | 29 | - | ||||
| CB 34 | 1993 Jan | CO, jet, H2 | 35,36 | C18O,CS,NH3,HCN | 37,38,39,40 | 41 | HH 290 | |||
| HH 270/110 | 1997 Dec | jet | 42 | C18O | 83 | 460 | 42 | L1617 | ||
| IRAS 05490 | 1993 Jan | CO | 7 | CS | 8 | 43 | S242 | |||
| HH 111 | 1993 Jan | CO, jet, H2 | 44,45,46 | CS | 47 | 460 | 44 | L1617 | ||
| HH 113 | 1996 May | jet | 44 | - | - | 460 | 44 | L1617 | ||
| AFGL 5173 | 1996 May | CO | 7 | CS | 8 | 7 | - | |||
| CB 54 | 1993 Jan | CO | 35 | C18O,CS,HCN | 37,38,40 | 41 | LBN 1042 | |||
| L1709 | 1996 May | CO | 48 | - | - | 160 | 49 | - | ||
| L379 | 1993 Jan | CO | 32 | C18O,NH3 | 50,51 | 32 | - | |||
| L588 | 1997 Dec | CO?, HH | 48,52 | - | - | 310 | 52 | HH 108/109 | ||
| CB 188 | 1993 Jan | CO | 35 | HCN,CS,C18O | 40,38,37 | 300 | 41 | - | ||
| L673e𝑒ee𝑒eAdditional NH3 data were obtained in 1990 February (see Paper I). | 1996 May | CO | 53 | NH3,CS,C34S,HCN | 54,55,56 | 300 | 57 | RNO 109 | ||
| HH 221 | 1996 May | jet | 58 | - | - | 1 800 | 58 | Parsamyan 21 | ||
| L797 | 1993 Jan | CO | 35 | HCN,CS,C18O | 59,38,37 | 700 | 41 | CB 216 | ||
| IRAS 20050 | 1996 May | CO | 60 | CS,HCO+,HCN,C18O | 60,61,78,84 | 700 | 62 | - | ||
| V1057 Cyg | 1996 May | CO | 63 | - | - | 700 | 49 | - | ||
| CB 232 | 1993 Jan | CO | 35 | C18O,CS | 37,38 | 600 | 41 | B158 | ||
| IC 1396E | 1993 Jan | CO | 32 | C18O,CS,NH3,HCN,HCO+ | 64,65,66,10 | 750 | 32 | GRS 14,IC1396N | ||
| L1165 | 1997 Dec | CO, HH | 48,67 | - | - | 750 | 67 | HHL75,HH 354 | ||
| IRAS 22134 | 1996 May | CO | 68 | CS,C18O | 86,88 | 2 600 | 87 | S134 | ||
| L1221 | 1996 May | CO, HH | 69,70 | CS,HCO+, HCN,C18O | 69 | 200 | 69 | HH 363 | ||
| L1251e𝑒ee𝑒eAdditional NH3 data were obtained in 1990 February (see Paper I). | 1996 May | CO, HH | 71,72 | NH3,CS,C18O | 54,55,73 | 300 | 74 | - | ||
| NGC 7538 | 1993 Jan | CO | 75 | HCN,CS,C34S,HCO+ | 76,77,85 | 2 700 | 75 | - | ||

We searched for ammonia emission in the 40 regions listed in Table 2. In all cases, we first made measurements on a five-point grid centered on the position given in Table 2, with a full beam separation between points. The NH3(1,1) line was detected in 27 sources. The NH3(2,2) line was observed in 15 sources and was detected in 10 of them. The observed spectra of the NH3(1,1) and NH3(2,2) lines at the position of the emission peak are shown in Figs. 1 and 2.
In Tables 3 and 4 we give the NH3(1,1) and NH3(2,2) line parameters obtained from a multicomponent fit to the magnetic hyperfine structure at the position of the emission peak. The intrinsic line widths obtained range from km s-1 to km s-1 for the NH3(1,1) line and from km s-1 to for the NH3(2,2) line. The values of optical depth obtained are in the range 0.1-5 for the NH3(1,1) and 0.1-0.5 for the NH3(2,2) line. We also used a single Gaussian fit to the main line to obtain the main beam brightness temperature at the position of the emission peak. The values obtained for the main beam brightness temperature for the detected sources range from K to K for the NH3(1,1) line and from K to K for the NH3(2,2) line.
Additionally, we searched for the - H2O maser line (at the frequency of 22.235080 GHz) toward the reference position of the six sources listed in Table 5. The H2O observations were carried out in 1996 May 16 and 17 with the same spectrometer and bandwidth used for the NH3 observations. We reached a typical (1) sensitivity of 1 Jy per spectral channel. Of the six sources observed in H2O, we only detected significant () H2O emission in two of them, HH 265 and AFGL 5173. The spectra of these H2O masers are shown in Fig. 3. In Table 5 we give the maser line parameters obtained from a Gaussian fit.
| Region | Positiona𝑎aa𝑎a Position of the emission peak, where line parameters were obtained (in offsets from the position given in Table 1). | b𝑏bb𝑏bVelocity of the line peak with respect to the local standard of rest. | c𝑐cc𝑐cMain beam brightness temperature of the main line of the transition, obtained from a single Gaussian fit. For undetected sources a upper limit is given. | d𝑑dd𝑑dIntrinsic line width, obtained taking into account optical depth and hyperfine broadening, but not the spectral resolution of the spectrometer. | e𝑒ee𝑒eOptical depth of the main line derived from the relative intensities of the magnetic hyperfine components. | f𝑓ff𝑓fDerived from the transfer equation, where is the “amplitude” (Pauls et al. 1983), is the filling factor, is the excitation temperature of the transition, is the background radiation temperature and is the intensity in units of temperature. Note that , for | g𝑔gg𝑔gBeam-averaged column density for the rotational level . Upper limit is obtained from where is derived from the transfer equation assuming a filling factor . If the beam averaged column density is proportional to the “amplitude” A, and the explicit dependence on disappears, reducing to providing the lower limit for the beam-averaged column density (e.g., Ungerechts et al. 1986) |
| (arcmin) | ( | (K) | (K) | ||||
| M120.1+3.0-N | 4.7 – 16.4 | ||||||
| 3.5 – 12.2 | |||||||
| M120.1+3.0-S | 2.5 – 9.0 | ||||||
| L1287 | 18.7 – 30.9 | ||||||
| L1293 | 3.6 – 7.7 | ||||||
| NGC 281 A-W | 5.6 – 27.0 | ||||||
| HH 156 | (0,0) | - | - | - | - | - | |
| HH 159 | (0,0) | - | - | - | - | - | |
| HH 158 | (0,0) | - | - | - | - | - | |
| HH 31 | 7.7 – 16.1 | ||||||
| HH265 | 6.3 – 14.0 | ||||||
| L1551 NE | 4.6 – 22.6 | ||||||
| L1642 | - | - | - | - | - | ||
| L1634 | 4.6 – 8.5 | ||||||
| HH 59 | - | - | - | - | - | ||
| IRAS 05358 | 12.6 – 24.6 | ||||||
| L1641-S3 | 7.4 – 14.4 | ||||||
| 5.8 – 13.2 | |||||||
| HH 68 | - | - | - | - | - | ||
| CB 34 | 3.8 – 8.3 | ||||||
| HH 270/110 | 2.4 – 8.9 | ||||||
| 2.6 – 4.8 | |||||||
| IRAS 05490 | 1.9 – 3.0 | ||||||
| HH 111 | 1.6 – 3.9 | ||||||
| HH 113 | - | - | - | - | - | ||
| AFGL 5173 | - | - | - | - | - | ||
| CB 54 | 3.5 – 10.8 | ||||||
| L1709 | - | - | - | - | - | ||
| L379 | 47.2 – 87.9 | ||||||
| L588 | 5.6 – 16.4 | ||||||
| CB 188 | - | - | - | - | - | ||
| L673 | 8.4 – 16.3 | ||||||
| HH221 | - | - | - | - | - | ||
| L797 | - | - | - | - | - | ||
| IRAS 20050 | 14.4 – 38.7 | ||||||
| 7.1 – 13.1 | |||||||
| V1057 CyghℎhhℎhLine parameters were obtained by averaging several positions of a five-point map. | i𝑖ii𝑖iObtained by adopting a upper limit for the intensity of the satellite lines. | j𝑗jj𝑗jThe highest value is obtained from the upper limit of and the lowest value is obtained assuming optically thin emission. | 0.5 – 14.5 | ||||
| CB 232 | 2.5 – 11.8 | ||||||
| IC 1396E | 6.1 – 16.6 | ||||||
| L1165 | 1.6 – 13.4 | ||||||
| IRAS 22134 | 2.3 – 6.0 | ||||||
| L1221 | 12.1 – 23.4 | ||||||
| L1251k𝑘kk𝑘kThis region was observed and mapped in Paper I. The undetection refers to the new observed positions. | - | - | - | - | - | ||
| NGC 7538 | 23.1 – 32.8 |
| Region | Positiona𝑎aa𝑎aPosition observed where line parameters have been obtained (in offsets from the position given in Table 1). | b𝑏bb𝑏bVelocity of the line peak with respect to the local standard of rest. | c𝑐cc𝑐cFlux density of the line peak. For undetected sources a upper limit is given. | d𝑑dd𝑑dFull width at half maximum. | e𝑒ee𝑒e Optical depth of the (2,2) main line derived from the ratio of the (1,1) to (2,2) antenna temperatures and the optical depth of the (1,1) line, assuming the same excitation temperature for both transitions. | f𝑓ff𝑓fVolume density, derived from the two-level model (Ho & Townes 1983). | g𝑔gg𝑔gBeam-averaged column density for the rotational level (2,2). Upper limit is derived from assuming that both filling factor and excitation temperature are the same for the (1,1) and (2,2) transitions. If , the beam-averaged column density is proportional to the “amplitude” A, and the explicit dependence on disappears, reducing to providing the lower limit for the beam-averaged column density (e.g., Ungerechts et al. 1986) |
| (arcmin) | ( | (K) | (K) | ||||
| M120.1+3.0-N | 0.2 – 0.7 | ||||||
| - | - | - | - | - | |||
| L1287 | 2.9 – 4.8 | ||||||
| L1293 | - | - | - | - | - | ||
| HH 31 | 0.1 | 0.2 – 0.4 | |||||
| HH 265 | - | - | - | - | - | ||
| IRAS 05358 | 2.8 – 5.5 | ||||||
| L1641-S3 | 0.5 – 1.0 | ||||||
| CB 34 | - | - | - | - | - | ||
| CB 54 | - | - | - | - | - | ||
| L379 | 7.7 – 14.3 | ||||||
| IRAS 20050 | 2.3 – 5.5 | ||||||
| CB 232 | - | - | - | - | - | ||
| IC 1396E | 1.2 – 3.2 | ||||||
| L1221 | 0.7 – 1.4 | ||||||
| NGC 7538 | 4.0 – 5.9 |

| Region | Positiona𝑎aa𝑎aPosition observed where line parameters have been obtained (in offsets from the position given in Table 1). | b𝑏bb𝑏bVelocity of the line peak with respect to the local standard of rest. | c𝑐cc𝑐cFlux density of the line peak. For undetected sources a upper limit is given. | d𝑑dd𝑑dFull width at half maximum. |
| (arcmin) | ( | (Jy) | ||
| M120.1+3.0-N | (2.8,1.4) | - | - | |
| HH 265 | (0,0) | |||
| (0,0) | ||||
| L1634 | (1.4,0) | - | - | |
| L1641-S3 | (0,0) | - | - | |
| AFGL 5137 | (0,0) | |||
| L1221 | (0,0) | - | - |

3 Results
In Table 6 we list the physical parameters of the molecular condensations, derived from the NH3 data given in Tables 3 and 4, following the procedures explained in the footnotes of Table 6. We mapped the NH3(1,1) emission in all the detected regions, except in V1057Cyg and L1551NE. Maps are shown in Figs. 7, 9 to 16, 18 to 29 and 31 to 36. In V1057 Cyg the emission is very weak in all positions. The spectrum of this region shown in Fig. 1 and the physical parameters listed in Table 6 were obtained by averaging several points of a five-point map. In L1551NE, we detected strong NH3 emission in four positions, but we were not able to map the region (see § A.8). A summary of the relevant information, taken from the literature, about the sources associated with these regions is given in Table 7.
We detected maser emission in the regions HH265 and AFGL 5173 (see Table 5). The position of the maser in AFGL 5173 coincides with that of IRAS 05553+1631, so that the maser could be excited by the IRAS source. We detected significant maser emission in the velocity range from 6.5 to 7.2 km s-1. Brand et al. (1994) detected highly variable H2O emission toward this source between 1989 March and 1991 January in the velocity range from to 13.1 km s-1. However no NH3 emission was detected toward the source AFGL 5173 (see Table 3). The results for individual sources are presented in Appendix A.
| Region | Sizea𝑎aa𝑎aMajor and minor axes of the half-power contour of the NH3 emission. For sources L1551 NE and V1057 Cyg the size of the beam has been adopted. | b𝑏bb𝑏bRotational temperature, derived from the ratio of column densities in the (1,1) and (2,2) levels (given in Tables 1 and 2, respectively), for the sources where the (2,2) line was detected. For the sources undetected in the (2,2) line, an upper limit was obtained assuming optically thin emission. For sources not observed in the (2,2) line, we assumed that , where the CO data are from Yang et al. 1990 (M120.1+3.0-S), Henning et al. 1994 (NGC 281 A-W), Moriarty-Schieven et al. 1995 (L1551 NE), Reipurth & Oldberg 1991 (HH 270/110 and HH 111), Snell et al. 1990 (IRAS 05490), Parker et al. 1991 (L588 and L1165), Levreault 1988 (V1057 Cyg) and Dobashi et al. 1994 (IRAS 22134). For L1634, K has been adopted. | c𝑐cc𝑐cBeam-averaged H2 column density, obtained from the NH3 column density adopting an NH3 abundance of [NH3/H2]= (see Anglada et al. 1995 for a discussion on NH3 abundances). The NH3 column density is obtained assuming that only the rotational metastable levels of the NH3 are significantly populated at their LTE ratios corresponding to . | d𝑑dd𝑑dMass of the condensation, derived from the beam-averaged H2 column density and the observed area. | e𝑒ee𝑒eVirial mass obtained from [/]=210[/pc][/km s-1]2, where is the radius of the clump, taken as half the geometrical mean of the major and minor axes, and is the intrinsic line width given in Table 2. | f𝑓ff𝑓fVolume density, derived from the two-level model (Ho & Townes 1983). | |||
|---|---|---|---|---|---|---|---|---|---|
| (arcmin) | (pc) | (K) | (cm-2) | () | () | (cm-3) | |||
| M120.1+3.0-N | 11.2 | 142 | 500 | 68 | 3. | 4 | |||
| M120.1+3.0-N | 89 | . | 6 | ||||||
| M120.1+3.0-S | 51 | 181 | . | 8 | |||||
| L1287 | 17.4 | 259 | 429 | 220 | 11. | 3 | |||
| L1293 | 71 | . | 7 | ||||||
| NGC 281 A-W | 505 | 2 413 | 871 | . | 3 | ||||
| HH31 | 9.7 | 4 | 9 | 2 | 12. | 4 | |||
| HH265 | 2 | . | 3 | ||||||
| L1551 NE | 0.6 | 3 | 1.6 | . | 1 | ||||
| L1634 | 19 | 35 | 21 | . | 1 | ||||
| IRAS 05358 | 20.6 | 575 | 1 121 | 707 | 5. | 9 | |||
| L1641-S3 ( km/s) | 49 | 96 | 20 | 10. | 1 | ||||
| L1641-S3 ( km/s) | 13.5 | 68 | 157 | 5 | 6. | 2 | |||
| CB 34 | 162 | . | 8 | ||||||
| HH 270/110 | 3.5 | 13.3 | 9 | . | 5 | ||||
| HH270/110 | 8 | 15 | 22 | . | 0 | ||||
| IRAS 05490 | 104 | 168 | 304 | . | 3 | ||||
| HH 111 | 3 | 8 | 14 | . | 6 | ||||
| CB 54 | 96 | . | 3 | ||||||
| L379 | 17.8 | 1 948 | 3 628 | 982 | 7. | 6 | |||
| L588 | 32 | 94 | 9 | . | 5 | ||||
| L673(SE)g𝑔gg𝑔gParameters of the southeastern clump. Parameters of the northwestern clump are given in Paper I | 3 | . | 9 | ||||||
| IRAS 20050 | 117 | 315 | 46 | 3. | 6 | ||||
| IRAS 20050 | 56 | 103 | 8. | 2 | |||||
| V1057 Cyg | 2 | 67 | 10 | . | 7 | ||||
| CB 232 | 21 | . | 2 | ||||||
| IC 1396E | 19.1 | 54 | 145 | 191 | 3. | 2 | |||
| L1165 | 41 | 347 | 23 | . | 3 | ||||
| IRAS 22134 | 310 | 787 | 283 | . | 3 | ||||
| L1221 | 12.5 | 7 | 13 | 6 | 10. | 5 | |||
| NGC 7538 | 28.3 | 2 514 | 3 571 | 2 599 | 12. | 2 | |||
| Region | IRAS | Ref. | Evolutionary | Ref. | Detection at | Ref. | H2O | Ref. | Outflow | Ref. | |
| () | status | other wavelengths | maser? | source? | |||||||
| M120.1+3.0-N | 00213+6530 | 12.9 | 1 | - | - | mm,cm | 109 | Yes | 2 | Yes | 1 |
| 00217+6533 | 12.0 | 1 | - | - | - | - | - | - | ? | 3 | |
| M120.1+3.0-S | 00259+6510 | 9.9 | 1 | - | - | - | - | No | 4 | Yes | 1 |
| 00256+6511 | 20.3 | 1 | - | - | - | - | - | - | ? | 3 | |
| L1287 | 00338+6312 | 1 800 | 5 | Class I?a𝑎aa𝑎aProbably young massive star/stars. | 6 | NIR,MIR,smm,mm,cm | 7,95,8,9,10 | Yes | 6 | ? | 11 |
| L1293 | 00379+6248 | 12 | - | - | - | - | Yes | 13 | Yes | 12 | |
| NGC 281 A-W | 00494+5617 | 8 790 | 14 | -a𝑎aa𝑎aProbably young massive star/stars. | - | NIR,FIR,mm | 7,15,14 | Yes | 16 | Yes | 11 |
| HH 31 | 04248+2612 | 0.36 | 17 | Class I | 17 | NIR,FIR,smm,mm | 17,18,19,20 | No | 13 | Yes | 21 |
| L1551 NE | 042881802 | 3.9 | 22 | Class 0 | 23 | NIR,smm,mm,cm | 24,19,20,25 | - | - | Yes | 23 |
| L1634 | 051730555 | 17 | 26 | Class 0 | 27 | NIR,FIR,smm,mm,cm | 28,18,29,24,27 | No | 30 | Yes | 28 |
| IRS 7b𝑏bb𝑏bNIR source. No IRAS source at this position. | 0.03c𝑐cc𝑐cSubmillimeter luminosity. | 27 | Class I/0 | 27 | NIR,smm | 28,27 | - | - | Yes | 28 | |
| IRAS 05358 | 05358+3543 | 6 300 | 31 | Herbig Ae/Be?a𝑎aa𝑎aProbably young massive star/stars. | 32 | NIR,MIR,smm,mm | 33,32,104,96,31 | Yes | 34 | Yes | 11 |
| L1641-S3 | 053750731 | 100 | 35 | Class I | 36 | NIR,FIR,smm,mm,cm | 36,37,29,35,38, | Yes | 39 | Yes | 40 |
| CB 34 | 05440+2059 | 130 | 41 | Class I | 42 | NIR,smm,mm,cm | 42,43,41,44 | Yes | 58 | Yes | 45 |
| HH 270/110 | 05487+0255 | 7 | 46 | Class I | 46 | NIR,FIR,cm | 47,46,48 | No | 49 | Yes | 46 |
| 05489+0256 | 5.3 | 50 | Class I | 50 | NIR,mm,cm | 50,97,48 | - | - | Yes | 51 | |
| IRAS 05490 | 05490+2658 | 4 200 | 11 | Class I?a𝑎aa𝑎aProbably young massive star/stars. | 7 | NIR,FIR,cm | 7,15 | No | 16 | Yes | 11 |
| HH 111 | 05491+0247 | 25 | 46 | Class 0 | 52 | NIR,smm,mm,cm | 53,26,54,55 | No | 30 | Yes | 46 |
| CB 54 | 070201618 | 400 | 43 | Class I | 41 | NIR,MIR,smm,mm,cm | 56,105,42,43,57 | Yes | 58 | Yes | 45 |
| L379 | 182651517 | 59 | -a𝑎aa𝑎aProbably young massive star/stars. | - | smm,mm,cm | 59,8 | Yes | 60 | Yes | 40 | |
| L588 | 183310035 | 3.7 | 26 | Class I | 61 | NIR,mm | 103,61 | - | - | ? | 61 |
| IRAS 20050 | 20050+2720 | 206 | 62 | Class 0 | 63 | NIR,FIR,mm,cm | 64,65,66,67 | Yes | 68 | Yes | 63 |
| 20049+2721 | 236d𝑑dd𝑑dIRAS luminosity. | - | - | - | NIR,cm | 64,67 | - | - | ? | - | |
| V1057 Cyg | 20571+4403 | 200 | 69 | FU Or | 70 | NIR,IR,FIR,cm,mm,smm | 71,72,73,74 | Yes | 75 | Yes | 76 |
| CB 232 | 21352+4307 | 14 | 41 | Class I | 42 | NIR,mm,smm | 42,41,77 | Yes | 58 | Yes | 45 |
| IC 1396E | 21391+5802 | 440 | 78 | Class 0 | 78 | NIR,FIR,mm,smm,cm,X-ray | 79,80,78,98,106 | Yes | 34 | Yes | 40 |
| L1165 | 22051+5848 | 120 | 81 | Class I/FU Or | 81 | NIR | 81,82 | No | 83 | Yes | 84,85 |
| IRAS 22134 | 22134+5834 | 7 943 | 111 | -a𝑎aa𝑎aProbably young massive star/stars. | - | NIR,FIR,mm | 107,86,108 | No | 110 | Yes | 86 |
| L1221 | 22266+6845 | 2.7 | 87 | Class I | 102 | NIR,mm | 103,99 | No | 88 | Yes | 87 |
| NGC 7538 | IRS 1-3b𝑏bb𝑏bNIR source. No IRAS source at this position. | 89 | -a | - | NIR,FIR,mm | 89,90 | Yes | 91,92 | Yes | 93 | |
| IRS 9b𝑏bb𝑏bNIR source. No IRAS source at this position. | 89 | -a | - | NIR,FIR,mm,cm,smm | 89,100,101 | Yes | 92 | Yes | 93 | ||
| IRS 11b𝑏bb𝑏bNIR source. No IRAS source at this position. | 10 000 | 67 | -a | - | FIR,mm,smm | 89,90 | Yes | 92 | Yes | 93 |
4 General discussion
4.1 Location of the exciting sources of the outflows
Through the and inversion transitions of the ammonia molecule we studied the dense gas in a sample of 40 regions with signs of star formation, as indicated by the presence of outflow activity. We detected ammonia emission in 27 regions and mapped 25 of them. This high ratio of detections is a clear indication of the strong association between outflow activity and NH3 emission. This result also confirms the young nature of the powering sources of the outflows included in our sample, because they appear to be still associated with (and most of them embedded in) the dense gas from which they have been formed.
In almost all the molecular outflow regions that we mapped in NH3, the emission peaks close ( pc) to the position of an object that was previously proposed as an outflow driving source candidate. The association with the ammonia emission peaks gives further support to the identification of these candidates as the outflow driving sources, following the criterion proposed by Anglada et al. (1989). The region IRAS 05490+2658 is the only region associated with a molecular outflow where the NH3 emission maximum is far ( pc) from the position of the proposed exciting source; since the NH3 emission peaks close to the center of symmetry of the outflow, for this region we suggest that the exciting source could be an undetected embedded object located close to the NH3 emission maximum.
For the sources of our sample that are only associated with optical signs of outflow the NH3 emission is generally weak. Among the nine proposed exciting sources of optical outflow that we observed, only HH270 and HH290 IRS are found close to an ammonia emission peak. In all the other cases, ammonia emission is not detected or there is no known object near the ammonia maximum that could be a good candidate to drive the optical outflow.
4.2 Physical parameters of the dense cores
The sizes of the condensations mapped in NH3 generally range from pc to pc. A somewhat higher value of 2 pc is obtained for the regions NGC 281 A-W, IRAS 22134+5834 and NGC 7538, the most distant sources of our sample. We found evidence that several of the condensations mapped are elongated (as was noted by Myers et al. 1991). However, in many regions our angular resolution is not good enough to allow us to further discuss the morphology of the sources. A high angular resolution interferometric study may be relevant for the sources of our sample that appear compact in our present single-dish study. Nevertheless, in several of the mapped regions (L673, M120.1+3.0-N, IRAS 20050+2720 and L1293), we can distinguish several clumps in the observed NH3 structure. In particular, in the regions M120.1+3.0-N and IRAS 20050+2720, two clumps with different velocities, but gravitationally bound, can be identified.
For the values of the kinetic temperature obtained for these regions (see Table 6), the expected thermal line widths are km s-1. This value is significantly lower than the intrinsic line widths we have obtained, which range from 0.3 to 3.8 km s-1(see Table 3). This result suggests that the star formation process probably introduces a significant perturbation in the molecular environment. The lower value for the intrinsic line width is found in the component at km s-1 of the L1641-S3 region, whose line widths are almost thermal. Although toward the position of the source IRAS 05375-0731 both the 3.8 km s-1 and 4.9 km s-1 ammonia components are observed, we argue in § A.11 that only the broad line emission at 4.9 km s-1 is likely associated with this YSO, while no embedded sources are known to be associated with the narrow line emission at 3.8 km s-1.
The highest value of the line width is obtained for NGC 7538, which is also the region with the highest value of the mass and kinetic temperature of our sample. In general, we found that the more massive regions present higher values of the line width (see Tables 3 and 6). Also, higher values of the line width are found for the most luminous sources (see Table 7). In Fig. 4 we plot the luminosity of the sources as a function of the nonthermal line width (subtracting the thermal component using the derived rotational temperature of the region), for the sources observed in this paper and in Paper I. But because our sample of sources is limited by the sensitivity of the telescope, the most luminous sources are located mainly at larger distances than the less luminous. In order to avoid this bias of luminosity with distance, we limited our analysis to sources closer than 1 kpc. We found that the luminosity and the nonthermal line width are related by with a correlation coefficient of . A similar correlation was found by Jijina et al. (1999). This correlation indicates that the most luminous sources produce a large perturbation in the surrounding material.
We also note that regions associated with CO molecular outflow have mostly higher values of the line width than regions with optical outflow only.

Partly because of our lack of angular resolution, we are not able to measure the velocity gradient in our regions in detail. However, it is remarkable that in L1287 our results show a strong velocity gradient with sudden velocity shifts of up to km s-1 between contiguous positions. A high angular resolution VLA study of this region (Sepúlveda et al. in preparation) shows that this region also exhibits a complex kinematics at small scale. Moreover, in two cases (M120.1+3.0-N and IRAS 20050+2720) the observed velocity distribution is compatible with two clumps that are gravitationally bound. The region L1641-S3 exhibits two velocity components separated by km s-1 that we interpreted as two distinct clumps of emission.
The H2 column densities we obtained are generally cm-2 (assuming [NH3/H2]= ), implying mean visual extinctions of mag. For L379 we obtained the highest H2 column density ( cm-2, corresponding to a visual extinction of mag), suggesting that this object is very deeply embedded.
The masses we obtained for the observed regions cover a wide range of values, from 1 to 3000 (the highest value corresponds to the NGC 7538 region). Most of the sources of our sample are low-mass objects, and the values of the mass obtained for their associated high-density cores are smaller than 100 . In general, the values derived for the mass coincide with the virial mass within a factor of 3. This overall trend suggests that most of the observed condensations are near the virial equilibrium and that the assumed NH3 abundance is adequate. However, we found four sources (HH 265, L588, L673, IRAS 20050+2720) for which the derived mass exceeds the virial mass by a large factor (). This result could imply that these clouds are still in the process of gravitational collapse.

Recently, Wu et al. (2010) find a strong correlation between the luminosity of a sample of high-mass sources and the mass of the cores, traced by several high-density tracers. Although their sample spans a wide range of distances, they assume that there is no distance effect on the clump masses. In order to check this correlation, and to ensure that there is no distance bias in our sample (see above), we selected sources closer than 1 kpc. In Fig. 5 we plot the luminosity of the source as a function of the mass of the core for the sources observed in this paper and in Paper I, using only sources with kpc. We found that both parameters are related by with a correlation coefficient of . The correlation we found for this sample is lower than the value we would obtain for the complete sample, including the more distant sources. Although for the complete sample the correlation can be caused by the distance bias of the sample (more luminous sources are, in general, more distant), for the sources closer than kpc there is still a significant correlation between luminosity and core mass, and this correlation is not caused by any distance bias. This result indicates that the sources formed in massive clumps can accrete more material and form more massive stars that are also more luminous.
5 Evolutive differences in the outflow sources
We detected and mapped the NH3 emission in 24 out of 30 regions associated with molecular outflow in our sample . In four of the six regions where we failed in detecting ammonia emission, the evidence for CO outflow is weak. In the 24 regions associated with molecular outflow, the NH3 emission is usually strong; the ammonia emission is faint ( K; see Table 3) only in three regions (IRAS 05490+2658, V1057 Cyg and L1165). On the other hand, in the regions without molecular outflow, the ammonia emission is usually undetectable or very faint. These results agree well with the results we obtained in Paper I, where we studied the relationship between the type of outflow and the intensity of the NH3 emission from a small sample of sources.
In order to substantiate the relationship between the type of outflow and the intensity of the ammonia emission, here we continue the study we began in Paper I, with a more complete sample of regions. The sample includes the regions observed in the present paper, the sources reported in Paper I, and also the results of other Haystack NH3 observations reported in the literature. We studied the distribution of the intensity of the NH3 emission, as measured by the main beam brightness temperature toward the outflow exciting source in this large sample of regions. As the main beam brightness temperature is a good measure of the intensity of the NH3 emission only for sources that fill the beam of the telescope, we included in the sample only the sources whose angular size of the ammonia emission is higher than the telescope beam. Thus, we used only sources with kpc.
Our final sample is presented in Table LABEL:histograma. It contains a total of 79 sources, with 30 sources associated with only molecular outflow, 40 sources associated with both molecular and optical outflows and 9 sources with only optical outflow.
In Fig. 6 (left) we present the distribution of the NH3 main beam brightness temperature toward the position of the proposed outflow exciting source (Table LABEL:histograma) for the three groups of sources. The mean values of the NH3 brightness temperature are K for regions with only optical outflow, K for regions with optical and molecular outflow, and K for sources with molecular outflow only.
Clearly the sources with only optical outflow tend to present lower values of the NH3 brightness temperature, while the distribution for sources with molecular outflow is shifted to higher values of the brightness temperature. The displacement to higher values of is similar for sources with only molecular outflow as for sources with both optical and molecular outflow. This was an expected result, because recent studies with high sensitivity detectors are revealing weak HH objects toward regions of high visual extinction, where previous observations failed in the detection. In our study, we did not take into account differences in the brightness of the Herbig-Haro objects or in the strength of the molecular outflow. We conclude, therefore, that the ammonia emission is in general more intense in molecular outflow sources than in sources without molecular outflow.
A similar result is obtained for the derived ammonia column densities. In Fig. 6 (right) we show the distribution of the derived ammonia column density (Table LABEL:histograma) for the three groups of sources. We note that the distribution for sources with CO outflow is shifted to higher values of the NH3 column density, while for sources with only HH outflow the distribution tends to lower values. The mean values for the NH3 column density are (NH3) cm-2 for regions with optical outflow only, (NH3) cm-2 for sources with molecular and optical outflow and (NH3) cm-2 for sources with molecular outflow only.
Recently, Davis et al. (2010) find from a study of outflows and their exciting sources in the Taurus region that sources driving CO outflows have redder near-IR colours than sources driving HH jets, and they conclude that CO outflow sources are more embedded in the high-density gas than the HH optical outflow sources. This result agrees well with ours.
All these results can be interpreted as an indication that molecular outflow sources are younger, since they are associated with a larger amount of high-density gas. As the star evolves, the surrounding material becomes less dense, decreasing the ammonia column density, and at the same time making the Herbig-Haro objects detectable. At the time when the molecular outflow has disrupted and swept out the molecular material surrounding the YSO, both the CO outflow and the NH3 column density are expected to be weak, and only the Herbig-Haro objects would be observable.
The ammonia emission and the observational appearance of outflows trace an evolutive sequence of sources. Molecular and optical outflow would be phenomena that dominate observationally at different stages of the YSO evolution. In younger objects, molecular outflows will be prominent, while optical outflows will progressively show up as the YSO evolves.
6 Conclusions
We detected the ammonia emission in 27 sources of a sample of 40 sources associated with molecular and/or optical outflows, and we were able to map 25 of them. We also searched for H2O maser emission toward 6 sources, and detected new H2O masers in HH 265 and AFGL 5173. Our main conclusions can be summarized as follows:
-
1.
In all molecular outflow regions mapped, the NH3 emission peak falls very close to the position of a very good candidate for the outflow excitation (except in the case of IRAS 05490+2658 where we propose an alternative location for the exciting source). On the other hand, the sources associated with optical outflow (except HH 270 IRS and HH 290 IRS) are not associated with an ammonia emission peak.
-
2.
Four regions (HH 265, L588, L673 and IRAS 20050+2720) could be in the process of gravitational collapse at scales pc, as their derived masses exceed the virial mass by a factor . The rest of ammonia condensations appear to be close to the virial equilibrium.
-
3.
In several regions the ammonia structure presents more than one clump. In the M120.1+3.0-N and IRAS 20050+2720 regions, two clumps with different velocities, which are gravitationally bound though were identified.
-
4.
We identified a high-density clump where the HH 270/110 jet can suffer the collision responsible for the deflection of the jet.
-
5.
We were able to separate the NH3 emission from the L1641-S3 region into two overlapping clouds, one with signs of strong perturbation, probably associated with the driving source of the CO outflow, and a second, quiescent clump, which probably is not associated with star formation.
-
6.
In general, the observed NH3 condensations are very cold, with line widths dominated by nonthermal (turbulent) motions. Among the observed sources, the more massive regions appear to produce a larger perturbation in their molecular high density environment.
-
7.
We found that generally the more luminous objects are associated with broader ammonia lines. A correlation between the nonthermal component of the line width and the luminosity of the associated object, was found for sources with 1 kpc.
-
8.
We found that there is a significant correlation between the luminosity of the source and the mass of the core and that this correlation is not caused by any distance bias in the sample. Both parameters are related by .
-
9.
The ammonia brightness temperature and column density of the sources decrease as the outflow activity becomes prominent in the optical. These results give an evolutive scheme in which young objects progressively lose their surrounding high-density gas. The ammonia emission and the observational appearance of outflows trace an evolutive sequence of sources.
Acknowledgements.
I.S. acknowledges the Instituto de Astrofísica de Andalucía for the hospitality during part of the preparation of this paper. G.A., R.E., R.L. and J.M.G. acknowledge support from MCYT grant AYA2008-06189-C03 (including FEDER funds). G.A. acknowledges support from Junta de Andalucía, Spain.References
- (1)
- (2) [] Afonso, J.M., Yun, Y.L., Clemens, D. P. 1998, AJ, 115, 1111
- (3)
- (4) [] Akabane, K., Tsunekawa, S., Inoue, M. et al. 1992, PASJ, 44, 421
- (5)
- (6) [] Alten, V. P., Bally, J., Devine, D, Miller, G. J. 1997, in Low Mass Star Formation - from Infall to Outflow, poster proceedings of IAU Symp. No. 182, eds. F. Malbet & A. Castets, p. 51
- (7)
- (8) [] Alves, J.F. 1995, Master Thesis, University of Lisbon
- (9)
- (10) [] Alves, J.F., Yun. J.L. 1995, ApJ, 438, L107
- (11)
- (12) [] Alves, J.F., Hartmann, L., Briceño, C., Lada, C.J. 1997, AJ, 113, 1395
- (13)
- (14) [] Anderson, I.M., Harju, J., Knee, L.B.G., Haikala, L.K. 1997, A&A, 321, 575
- (15)
- (16) [] André, Ph., Ward-Thompson, D., Barsony, M. 1993, ApJ, 406, 122
- (17)
- (18) [] André, Ph., Ward-Thompson, D., Barsony, M., 2000, in Mannings V., Boss A. P., Russell, S.S. eds., Protostars and Planets IV. Univ. of Arizona Press, Tucson, p. 59
- (19)
- (20) [] Anglada, G., Rodríguez, L.F., Torrelles, J.M., et al. 1989, ApJ, 341, 208
- (21)
- (22) [] Anglada, G., Rodríguez, L.F., Girart, J.M., Estalella, R.,Torrelles, J.M. 1994, ApJ, 420, 91
- (23)
- (24) [] Anglada, G., Estalella, R., Mauesberger, R., et al. 1995, ApJ, 443, 682
- (25)
- (26) [] Anglada, G., Sepúlveda, I., Gómez, J.F. 1997, A&AS, 121, 255
- (27)
- (28) [] Anglada, G., Rodríguez, L.F., Torrelles, J.M. 1998a, ASPC, 132, 303
- (29)
- (30) [] Anglada, G., Villuendas, E., Estalella, R. et al. 1998b, AJ, 116, 2953
- (31)
- (32) [] Arce, H.G. & Sargent, A.I. 2006, ApJ, 646, 1070
- (33)
- (34) [] Armstrong, J.T., Winnewisser, G., 1989, A&A, 210, 373
- (35)
- (36) [] Bachiller, R., Fuente, A., Tafalla, M. 1995, ApJ, 445, L51
- (37)
- (38) [] Bally, J., Devine, D., Alten, V. 1997, ApJ, 478, 603
- (39)
- (40) [] Beltrán, M.T., Estalella, R., Ho, P.T.P, Calvet, N., Anglada, G., Sepúlveda, I., 2002a, ApJ, 565, 1069
- (41)
- (42) [] Beltrán, M.T., Girart, J.M., Estalella, R., Ho, P.T.P., Palau, A. 2002b, ApJ, 573, 246
- (43)
- (44) [] Beltrán, M.T., Estalella, R., Girart, J.M. Ho, P.T.P., Anglada, G. 2008, A&A, 481, 93
- (45)
- (46) [] Beuther, H., Schilke, P., Gueth, F., et al. 2002, A&A, 387, 931
- (47)
- (48) [] Beuther, H., Schilke, P., Menten K.M. et a. 2002, ApJ, 566, 945
- (49)
- (50) [] Beuther, H., Leurini, S., Schilke, P. et al. 2007, A&A, 466, 1065
- (51)
- (52) [] Benson, P. J., Myers, P.C. 1989, ApJS, 71, 89
- (53)
- (54) [] Blitz, L., Fich, M., Stark, A.A. 1982, ApJS, 49, 183
- (55)
- (56) [] Brand, J., Cesaroni, R., Caselli, P. et al. 1994, A&AS, 103, 541
- (57)
- (58) [] Busquet, G. Palau, A., Estalella, R., et al. 2009, A&A, 506, 1183
- (59)
- (60) [] Campbell, B., Thompson, R.I. 1984, ApJ, 279, 650
- (61)
- (62) [] Cao, Y.X., Zeng, Q., Deguchi, S., Kameya, O., Kaifu, N., 1993, AJ, 105, 1027
- (63)
- (64) [] Carpenter, J.M., Snell, R.L., Schloerb, F.P. 1990, ApJ, 362, 147
- (65)
- (66) [] Carpenter, J.M., Snell, R.L., Schloerb, F.P. 1995, ApJ, 450, 201
- (67)
- (68) [] Carpenter, J.M., Snell, R.L., Schloerb, F.P., Skrutskie, M.F. 1993, ApJ, 407, 657
- (69)
- (70) [] Cesaroni, R., Walmsley, C.M., Koempe, C., Churchwell, E. 1991, A&A, 252, 278
- (71)
- (72) [] Cesaroni, R., Felli, M., Walmsley, C.M. 1999, A&AS, 136, 333
- (73)
- (74) [] Cernicharo, J., Neri, R., Reipurth, B. 1997, in Herbig-Haro Flows and the Birth of Low Mass Stars, IAU Sym No.182, eds. B. Reipurth and C. Bertout, p. 141
- (75)
- (76) [] Chen, H., Tokunaga, A.T. 1994, ApJS, 90, 149
- (77)
- (78) [] Chen, H., Myers, P.C., Ladd, E.F., Wood, D.O.S. 1995, ApJ, 455, 377
- (79)
- (80) [] Chen, H., Tafalla, M., Greene, T.P., Myers, P.C., Wilner, D.J., 1997, ApJ, 475, 163
- (81)
- (82) [] Chini, R., Reipurth, B., Sievers, A. et al. 1997, A&A, 325, 542
- (83)
- (84) [] Choi, M., Panis, J.-F., Evans, N.J.II 1999, ApJS, 122,519
- (85)
- (86) [] Choi, M., Tang, Y-W. 2006, ApJ, 648, 504
- (87)
- (88) [] Ciardi, D.R. & Gómez-Martín, C. 2007, ApJ, 664, 377
- (89)
- (90) [] Claussen, M.J., Wilking, B.A., Benson, P.J. et al. 1996, ApJS, 106, 111
- (91)
- (92) [] Clemens, D.P., Barvainis, R. 1988, ApJS, 68, 257
- (93)
- (94) [] Codella, C., Felli, M., Natale, V. 1996, A&A, 311, 971
- (95)
- (96) [] Codella, C., Scappini, F. 1998, MNRAS, 298, 1092
- (97)
- (98) [] Cohen, M. 1980, AJ, 85, 29
- (99)
- (100) [] Cohen, M., Schwartz, R.D. 1983, ApJ, 265, 877
- (101)
- (102) [] Cohen, M., Harvey, P.M.,Schwartz, R.D. 1985, ApJ, 296, 633
- (103)
- (104) [] Connelley, M.S., Reipurth, B., Tokunaga, A.T. 2007, AJ, 133, 1528
- (105)
- (106) [] Davis, C.J., Mundt, R., Eislöffel, J. 1994, ApJ, 437, L55
- (107)
- (108) [] Davis, C.J., Ray, T.P., Eislöffel, J., Corcoran, D. 1997, A&A, 324, 263
- (109)
- (110) [] Davis, C.J., Moriarty-Schieven, G., Eislöffel, J., Hoare, M.G., Ray, T.P. 1998, AJ, 115, 1118
- (111)
- (112) [] Davis, C.J., Chrysostomou, A., Hatchell, J. et al. 2010, MNRAS, in press.
- (113)
- (114) [] Dent, W.R.F., Matthews, H.E., Ward-Thompson, D. 1998, MNRAS, 301, 1049
- (115)
- (116) [] Devine, D., Reipurth, B., Bally, J. 1997, in Low Mass Star Formation - from Infall to Outflow, poster proceedings of IAU Symp. No. 182, eds. F. Malbet & A. Castets, p. 91
- (117)
- (118) [] Devine, D., Reipurth, B., Bally, J. 1999, AJ, 118, 972
- (119)
- (120) [] Di Francesco, J., Evans II, N.J., Harvey, P.M., Mundy, L.G., Butner, H.M. 1998, ApJ, 509,324
- (121)
- (122) [] Dobashi, K., Uehara, H. 2001, PASJ, 53, 799
- (123)
- (124) [] Dobashi, K., Nozawa, S., Hayashi, Y., Sato, F., Fukui, Y. 1994, AJ, 107, 2148
- (125)
- (126) [] Emerson, J.P. 1987, in Star Forming Regions, IAU Symp 115, p. 19
- (127)
- (128) [] Estalella, R., Mausberger, R., Torrelles, J.M. et al. 1993, ApJ, 419, 698
- (129)
- (130) [] Evans II, N.J., Balkum, S., Levreault, R. M., Hartmann L., Kenyon. S. 1994, ApJ, 424, 793
- (131)
- (132) [] Felli, M., Palagi, F., Tofani, G. 1992, A&A, 255, 293
- (133)
- (134) [] Fiebig, D. 1995, A&A, 298, 207
- (135)
- (136) [] Fiebig, D. 1997, A&A, 327, 758
- (137)
- (138) [] Fiebig, D., Duschl, W.J., Menten, K.M., Tscharnuter, W.M. 1996, A&A, 310, 199
- (139)
- (140) [] Fukui, Y. 1989 in Low Mass Star Formation and Pre-Main Sequence Objects, ed. B. Reipurth (Garching: ESO), 95
- (141)
- (142) [] Garnavich, P.M., Noriega-Crespo, A., Green, P.J. 1992, Rev. Mex. Astron. Astrofis. 24, 99
- (143)
- (144) [] Garnavich, P.M., Noriega-Crespo, A., Raga, A.C., Bohm, K-H. 1997, ApJ, 490, 752
- (145)
- (146) [] Genzel, R., Downes, D. 1977, A&AS, 30, 145
- (147)
- (148) [] Getman, K.V., Feigelson, E.D., Garmire, G., Bross, P., Wang, J. 2007, ApJ, 654, 316
- (149)
- (150) [] Gibb, A.G., Davis, C.J. 1998, AJ, 115, 1554
- (151)
- (152) [] Gredel, R., Reipurth, B. 1993, ApJ, 407, L29
- (153)
- (154) [] Greene, T.P., Lada, C.J. 1997, AJ, 114, 2517
- (155)
- (156) [] Gregersen, E. M., Evans, N.J.II, Zhou, S., Choi, M. 1997, ApJ, 484, 256
- (157)
- (158) [] Gómez, M., Whitney, B.A., Kenyon, S.J. 1997, AJ, 114, 1138
- (159)
- (160) [] Gómez, J.F., Gregorio-Monsalvo, I., Súarez, O., Kuiper, T.B.H. 2006, AJ, 132, 1322
- (161)
- (162) [] Gyulbudaghian, A.L. 1982, PAZh, 8, 232
- (163)
- (164) [] Han, F., Mao, R.Q., Lu, J. et al. 1998, A&AS, 127, 181
- (165)
- (166) [] Harju, J., Walmsley, C.M., Wouterloot, J.G.A. 1993, A&AS, 98, 51
- (167)
- (168) [] Hayashi, M., Hasegawa, T., Ohashi, N., Kazuyoshi, 1994, ApJ, 426, 234
- (169)
- (170) [] Henning, Th., Cesaroni, R., Walmsley, M., Pfau, W. 1992, A&AS, 93, 525
- (171)
- (172) [] Henning, Th., Martin, K., Reimann, H.-G., et al. 1994, A&A, 288, 282
- (173)
- (174) [] Herbig, G.H. 1974, Lick. Obs. Bull., No. 658
- (175)
- (176) [] Herbig, G.H. 1977, ApJ, 217, 693
- (177)
- (178) [] Herbig, G.H., Jones, B.F. 1983, AJ, 88, 1040
- (179)
- (180) [] Hilton, J., White, G.J., Rainey, R., Cronin, N.J. 1986, A&A, 154, 274
- (181)
- (182) [] Ho, P.T.P., Townes, C.H. 1983, ARA&A, 21, 231
- (183)
- (184) [] Hoddap, K-W., Ladd, E.F. 1995, ApJ, 453, 715
- (185)
- (186) [] Hogerheijde, M.R., van Dishoeck, E.F., Blake G.A., van Langevelde, H.J. 1998, ApJ, 502,315
- (187)
- (188) [] Huard, T.L., Sandell, G., Weintraub, D.A. 1999, ApJ, 526, 833
- (189)
- (190) [] Hughes, V.A., MacLeod, G.C. 1994, ApJ, 427, 857
- (191)
- (192) [] Jones, B.F., Cohen, M., Sirk, M., Jarrett, R. 1984, AJ, 89, 1404
- (193)
- (194) [] Kameya, O., Hasegawa. T.I., Hirano, N. et al. 1986, PASJ, 38,793
- (195)
- (196) [] Kameya, O., Hasegawa, T.I., Hirano, N., Takakubo, K., Seki, M. 1989, ApJ, 339, 222
- (197)
- (198) [] Kameya, O., Morita, K-I., Kawabe, R., Ishiguro, M. 1990, ApJ, 355, 562
- (199)
- (200) [] Kelly, M.L., Macdonald, G.H. 1995, Ap&SS, 224, 497
- (201)
- (202) [] Kelly, M.L., Macdonald, G.H. 1996, MNRAS, 282, 401
- (203)
- (204) [] Kenyon, S.J. 1999, in The Origin of Stars and Planetary Systems. Eds. C.J. Lada & N.D. Kylafis, Kluwer Academic Publishers, p. 613
- (205)
- (206) [] Kenyon, S.J., Hartmann, L.W. 1991, ApJ, 383, 664
- (207)
- (208) [] Kenyon, S.J., Hartmann, L., Gómez, M., Carr, J.S., Tokunaga, A. 1993, AJ, 105, 1505
- (209)
- (210) [] Kumar, M.S.N., Bachiller, R., Davis, C.J. 2002, ApJ, 576, 313
- (211)
- (212) [] Kumar, M.S.N., Ojha, D.K., Davis, C.J. 2003 ApJ, 598, 1107
- (213)
- (214) [] Kumar, M.S.N., Keto, E., Clerkin, E. 2006, A&A, 449, 1033
- (215)
- (216) [] Kun, M., Prusti, T. 1993, A&A, 272, 235
- (217)
- (218) [] Lada, C.J. 1991, in Star Forming Regions, IAU Symp. No. 115, eds. M. Peimbert & J. Jugaku, (Reidel, Dordrecht), p. 1
- (219)
- (220) [] Launhardt, R., Henning, Th. 1997, A&A, 326, 329
- (221)
- (222) [] Launhardt, R., Ward-Thompson, D., Henning, Th. 1997,MNRAS, 288, L45
- (223)
- (224) [] Launhardt, R., Evans II, N.J., Wang, Y., Clemens, D.P., Henning, Th., Yun, J.L. 1998, ApJS, 119, 59
- (225)
- (226) [] Lee, C.-F, Ho, P.T.P. 2005, ApJ, 632, 964
- (227)
- (228) [] Lee, C.-F, Mundy, L.G., Reipurth, B., Ostriker, E.C., Stone, J.M., 2000, ApJ, 542, 925
- (229)
- (230) [] Lee, C.-F, Mundy, L.G., Stone, J.M., Ostriker, E.C. 2002, ApJ, 576, 294
- (231)
- (232) [] Leurini, S., Beuther, H., Schilke, P. et al. 2007, A&A, 475, 925
- (233)
- (234) [] Levreault, R. M. 1988, ApJS, 67, 283
- (235)
- (236) [] Liljeström, T. 1991, A&A, 244, 483
- (237)
- (238) [] Liljeström, T., Mattila, K., Friberg, P. 1989, A&A, 210, 337
- (239)
- (240) [] Longmore, S.N, Burton, M.G., Minier, V., Walsh, A.J. 2006, MNRAS, 369, 1196
- (241)
- (242) [] López, R., Estalella, R., Raga, A.C., Riera, A., Reipurth, B., Heathcote, S.R., 2005, A&A, 432, 567
- (243)
- (244) [] McCutcheon, W.H., Sato, T., Purton, C.R., Matthews, H.E., Dewdney, P.E. 1995, AJ, 110, 1762
- (245)
- (246) [] McMuldroch, S., Blake, G.A., Sargent, A.I. 1995, AJ, 110, 354
- (247)
- (248) [] Minchin, N.R., Murray, A.G., 1994, A&A, 286, 579
- (249)
- (250) [] Mitchell, G.F., Hasewaga, T.I., Dent, W.R.F., Matthews, H.E. 1994, ApJ, 436, L177
- (251)
- (252) [] Morata, O., Estalella, R., López, R., Planesas, P. 1997, MNRAS, 292, 120
- Morata et al. (2003) Morata, O., Girart, J. M., & Estalella, R. 2003, A&A, 397, 181
- Morata et al. (2005) Morata, O., Girart, J. M., & Estalella, R. 2005, A&A, 435, 113
- (255) [] Moreira, M.C., Yun, J. L. 1995, ApJ, 454, 850
- (256) [] Moreira, M.C., Yun, J.L., Vázquez, R., Torrelles, J.M., 1997, AJ, 113, 137
- (257) [] Morgan, J.A., Snell, R.L., Strom, K.M. 1990, ApJ, 362, 274
- (258) [] Morgan, J.A., Schloerb, F.P., Snell, R.L., Bally, J. 1991, ApJ, 376, 618
- (259) [] Moriarty-Schieven, G.H., Wannier, P.G., Tamura, M., Keene, J., 1992, ApJ, 400, 260
- (260) [] Moriarty-Schieven, G.H., Wannier, P.G., Keene, J., Tamura, M. 1994, ApJ, 436, 800
- (261) [] Moriarty-Schieven, G.H., Butner, H.M., Wannier, P.G. 1995, ApJ, 455, L55
- (262) [] Moriarty-Schieven, G.H., Johnstone, D., Bally, J., Jenness, T. 2006, ApJ, 645, 357
- (263) [] Movsessian, T.A., Magakian, T.Y., Bally, J., et al. 2007, A&A, 470, 605
- (264) [] Mundt, R., Eislöffel, J. 1998, AJ, 116, 860
- (265) [] Mundt, R., Brugel, E.W., Bührke, T. 1987, ApJ, 319, 275
- (266) [] Mundt, R., Ray, T.P., Raga, A.C. 1991, A&A, 252, 740
- (267) [] Nielsen, A.S., Olberg, M., Knude, J., Booth, R.S. 1998, A&A, 336, 329
- (268) [] Ohashi, N., Kawabe, R., Ishiguro, M., Hayashi, M., 1991, AJ, 102, 2054
- (269) [] Ohashi, N., Hayashi, M., Kawabe, R., Ishiguro, M. 1996, ApJ, 466, 317
- (270) [] Onishi, T., Mizuno, A., Kawamura, A., Ogawa H., Fukui, Y. 1998, ApJ, 502, 296
- (271) [] Padgett, D.L., Brandner, W., Stapelfeld, K.R. et al. 1999, AJ, 117, 1490
- (272) [] Palla, F., Cesaroni, R., Brand, J. et al. 1993, A&A, 280, 599
- (273) [] Parker, N.D., Padman, R., Scott, P.F. 1991, MNRAS, 252, 442
- (274) [] Patel, N.A., Greenhill, L.J., Herrnstein, J. et al. 2000, ApJ, 538, 268
- (275) [] Pauls, T.A., Wilson, T.L., Bieging, J.H., Martin, R.N., 1983, A&A, 124, 23
- (276) [] Persi, P., Palagi, F., Felli, M. 1994, A&A, 291, 577
- (277) [] Price, S.D., Murdock, T.L., Shivanandan, K., Bowers, P.F. 1983, ApJ, 275, 125
- (278) [] Quanz, S.P., Henning, Th., Bouwman, J., Linz, H., Lahuis, F. 2007, ApJ, 658, 487
- (279) [] Reipurth, B. 1989, Nature, 340, 42
- (280) [] Reipurth, B., Graham, J.A. 1988, A&A, 202, 219
- (281) [] Reipurth, B., Heathcote, S. 1990, A&A, 229, 527
- (282) [] Reipurth, B., Olberg, M. 1991, A&A, 246, 535
- (283) [] Reipurth, B., Eiroa, C. 1992, A&A, 256, L1
- (284) [] Reipurth, B., Aspin, C. 1997, AJ, 114, 2700
- (285) [] Reipurth, B., Chini, R., Krügel, E., Kreysa, E., Sievers, A. 1993, A&A, 273, 221
- (286) [] Reipurth, B., Raga, A.C., Heathcote, S. 1996, A&A, 311, 989
- (287) [] Reipurth, B., Bally, J., Devine, D. 1997, AJ, 114, 2708
- (288) [] Reipurth, B., Hartigan, P., Heathcote, S., Morse, J.A., Bally, J. 1997, AJ, 114, 757
- (289) [] Reipurth, B., Devine, D., Bally, J. 1998, AJ, 116, 1396
- (290) [] Riera, A., López, R., Raga, A.C., Estalella, R., Anglada, G., 2003, A&A, 400, 213
- (291) [] Rodríguez, L.F., Hartmann, L.W., 1992, Rev.Mex.Astron.Astrofis., 24, 135
- (292) [] Rodríguez, L.F., Reipurth, B. 1994, A&A, 281, 882
- (293) [] Rodríguez, L.F., Haschick, A.D., Torrelles, J.M., Myers, P.C. 1987, A&A, 186, 319
- (294) [] Rodríguez, L.F., Anglada, G., Raga, A. 1995, ApJ, 454, L149
- (295) [] Rodríguez, L.F., Reipurth, B., Raga, A.C., Cantó, J. 1998, Rev. Mex. Astron. Astrofis., 34, 69
- (296) [] Sánchez-Monge, A., Palau, A., Estalella, R., Beltrán, M.T., Girart, J.M. 2008, A&A, 485, 497
- (297) [] Sandell, G., Hoglund, B., Kisliakov, A.G., 1983, A&A, 118,306
- (298) [] Sandell, G., Weintraub, D.A., 2001, 134, 115
- (299) [] Sandell, G., Goss, W.M., Wright. M. 2005, ApJ, 621, 839
- (300) [] Saraceno, P., Ceccarelli, C., Clegg, P. et al. 1996, A&A, 315, L293
- (301) [] Sato, F., Mizuno, A., Nagahama, T. et al. 1994, ApJ, 435, 279
- (302) [] Sepúlveda, I., 2001, Ph.D. Thesis, Universitat de Barcelona
- (303) [] Serabyn, E., Güsten, R., Mundy, L. 1993, ApJ, 404, 247
- (304) [] Scappini, F., Cecchi-Pestellini, C., Olberg, M., Casolani, A., Fanti, C. 1998, ApJ, 504, 866
- (305) [] Schwartz, R.D., Gyulbudaghian, A.L., Wilking, B.A. 1991, ApJ, 370, 263
- (306) [] Snell, R.L., Bally, J. 1986, ApJ, 303, 683
- (307) [] Snell, R.L., Dickman, R.L., Huang, Y.-L. 1990, ApJ, 352, 139
- (308) [] Sridharan, T.K., Beuther, H., Schilke, P., Menten, K.M., Wyrowski, F. 2002, ApJ, 566, 931
- (309) [] Stanke,T., McCaugherea M.J., Zinnecker,H. 2000,A&A, 355, 639
- (310) [] Stapelfeldt, K.R., Scoville, N.Z. 1993, ApJ, 408, 239
- (311) [] Staude, H.J., Neckel, Th. 1991, A&A, 244, L13
- (312) [] Staude, H.J., Neckel, Th. 1992, ApJ, 400, 556
- (313) [] Strom, K.M., Strom, S.E., Wolff, S.C., Morgan, J., Wenz, M. 1986, ApJS, 62, 39
- (314) [] Strom, K.M., Newton, G., Strom, S.E., et al. 1989, ApJS, 71, 183
- (315) [] Sugitani, K., Matsuo, H., Nakano, M., Tamura, M., Ogura, K. 2000, AJ, 119, 323
- (316) [] Swift, J.J., Welch, W.J., Di Francesco, J. 2005, ApJ, 620, 823
- (317) [] Swift, J.J., Welch, W.J., Di FRancesco, J., Stojimirović, I. 2006, ApJ, 637, 392
- (318) [] Tafalla, M., Bachiller, R., Wright, M.C.H., Welch, W.J. 1997, 474, 329
- (319) [] Tamura, M., Ohashi, N., Hirano, N., Itoh, Y., Moriarty-Schieven, G.H. 1996, AJ, 112, 2076
- (320) [] Tapia, M., Persi, P., Bohigas, J., Ferrari-Toniolo, M. 1997, AJ, 113, 1769
- (321) [] Tatematsu, K., Umemoto, T., Kameya, O. et al. 1993, ApJ, 404, 643
- (322) [] Tofani, G., Felli, M., Taylor, G.B., Hunter, T.R. 1995, A&AS, 112, 299
- (323) [] Torrelles, J.M., Rodríguez, L.F., Cantó, J. et al. 1983, ApJ, 274, 214
- (324) [] Ungerechts, H., Walmsley, C.M., Winnewisser, G. 1986, A&A, 157, 207
- (325) [] Umemoto, T., Hirano, N., Kameya, O. et al. 1991, ApJ, 377, 510
- (326) [] Wang, Y., Evans II, N.J., Zhou, S., Clemens, D.P. 1995, ApJ, 454,217
- (327) [] Weikard, H., Wouterloot, J.G.A., Castets, A., Winnewisser, G., Sugitani, K. 1996, A&A, 309, 581
- (328) [] Weintraub, D.A, Kastner, J., 1993, ApJ, 411, 767
- (329) [] Weintraub, D.A., Sandell, G., Duncan, W.D. 1991, ApJ, 382, 270
- (330) [] Werner, M.W., Becklin, E.E., Gatley, I. et al. 1979, MNRAS, 188,463
- (331) [] Wilking, B.A., Mundy, L.G., Blackwell, J.H., Howe, J.E. 1989, ApJ, 345, 257
- (332) [] Wilking, B.A., Blackwell, J.H., Mundy, L.G. 1990, AJ, 100, 758
- (333) [] Wilking, B.A., Mundy, L.G., McMullin, J., Hezel, T., Keene, J. 1993, AJ, 106, 250
- (334) [] Williams, S.J., Fuller, G.A., Sridharan, T.K. 2005, A&A, 434, 257
- (335) [] Whittet, D.C.B., Smith, R.G., Adamson, A.J. et al. 1996, ApJ, 458, 363
- (336) [] Whyatt, W., Girart, J.M., Viti, S., Estalella, R., Williams, D.A., 2009, A&A, submitted
- (337) [] Wouterloot, J.G.A., Walmsley, C.M. 1986, A&A, 168, 237
- (338) [] Wouterloot, J.G.A., Brand, J., Fiegle, K. 1993, A&AS, 98, 589
- (339) [] Wu, J., Evans II, N.J., Shirley, Y.L., Knez, C. 2010, arXiv:1004.0398v2 [astro-ph.GA]
- (340) [] Wu, Y., Henkel, C., Xue, R., Guan, X., Miller, M. 2007, 669, L37
- (341) [] Yang, J. 1990, Ph.D. Thesis, Nagoya University
- (342) [] Yang, J., Fukui, Y., Umemoto, T., et al. 1990, ApJ, 362, 538
- (343) [] Yang, J., Umemoto, T., Iwata, T., Fukui, Y. 1991, ApJ, 373, 137
- (344) [] Yang, J., Ohashi, N., Fukui, Y. 1995, ApJ, 455, 175
- (345) [] Yang, J., Ohashi, N., Yan, J. et al. 1997, ApJ, 475, 683
- (346) [] Yun, J.L., Clemens, D.P. 1994a, ApJS, 92, 145
- (347) [] Yun, J.L., Clemens, D.P. 1994b, AJ, 108, 612
- (348) [] Yun, J.L., Clemens, D.P. 1995, AJ, 109, 742
- (349) [] Yun, J.L., Moreira, M.C., Torrelles, J.M., Afonso, J.M., Santos, N.C. 1996, AJ, 111, 841
- (350) [] Zavagno, A., Molinari, S., Tommasi, E., Saraceno, P., Griffin, M. 1997, A&A, 325, 685
- (351) [] Ziener, R., Eislöffel, J. 1999, A&A, 347, 565
- (352) [] Zinchencko, I., Henning, Th., Schereyer, K. 1997, A&A, 124, 385
| Source | Outflow | Ref. | a𝑎aa𝑎afootnotemark: | (NH3)b𝑏bb𝑏bfootnotemark: | Ref. | Ref. | |
|---|---|---|---|---|---|---|---|
| associated | (K) | ( cm-2) | (pc) | ||||
| M120.1+3.0-N (IRAS 00213+6530) | CO | 1 | 0.65 | 0.9 | 2 | 850 | 1 |
| M120.1+3.0-S (IRAS 00259+6510) | CO | 1 | 0.57 | 0.7 | 2 | 850 | 1 |
| L1287 | CO | 1 | 2.51 | 4.6 | 2 | 850 | 1 |
| L1293 | CO | 1 | 1.06 | 1.1 | 2 | 850 | 1 |
| L1448 IRS1 | CO, HH | 72,70 | 0.3 | 0.3 | 4 | 350 | 3 |
| L1448 IRS2 | CO, HH | 70 | 1.9 | 1.8 | 4 | 350 | 3 |
| L1448 IRS3 | CO, HH | 23,5 | 3.1 | 4.2 | 4 | 350 | 3 |
| L1448 C | CO, HH | 23,70 | 2.5 | 3.3 | 4 | 350 | 3 |
| GL490 | CO | 6 | 7 | 900 | 8 | ||
| L1455 IRS1 | CO, HH | 9,70 | 1.9 | 1.0 | 4 | 350 | 3 |
| L1455 IRS2 | CO, HH | 9,70 | 2.5 | 1.6 | 4 | 350 | 3 |
| L1489 | CO, HH | 10,71 | 0.8 | 1.8 | 11 | 140 | 8 |
| HH 156 | HH | 1 | 2 | 140 | 1 | ||
| HH 159 | CO, HH | 1 | 2 | 160 | 1 | ||
| HH 158 | HH | 1 | 2 | 160 | 1 | ||
| HH 31 | CO?,HH | 1 | 0.56 | 0.7 | 2 | 160 | 1 |
| L1524 (Haro 6-10) | CO, HH | 73, 14 | 4 | 140 | 13 | ||
| L1551 IRS 5 | CO, HH | 15, 16 | 2.72 | 2.3 | 7 | 140 | 13 |
| HL Tau | CO, HH | 17, 18 | 7 | 140 | 13 | ||
| L1551 NE | CO, HH | 1 | 0.79 | 1.0 | 2 | 160 | 1 |
| L1642 | CO, HH | 1 | 2 | 125 | 1 | ||
| L1527 | CO, HH | 20,74,19 | 2.12 | 5.0 | 11 | 140 | 13 |
| L1634 (IRAS 05173–0555) | CO, HH | 1 | 1.0 | 1.1 | 2 | 460 | 1 |
| L1634 (IRS 7) | CO, HH | 83,84 | 0.59 | 0.8 | 2 | 460 | 1 |
| RNO 43 (IRAS 05295+1247) | CO, HH | 21,22 | 0.40 | 0.4 | 2 | 400 | 24 |
| HH 83 | CO, HH | 26,25 | 0.46 | 0.4–0.5 | 85 | 470 | 13 |
| HH 84 | HH | 25 | 0.3 | 0.5–1 | 85 | 470 | 13 |
| HH 33/40 | HH | 27 | 28 | 470 | 13 | ||
| HH 86/87/88 | HH | 25 | 85 | 470 | 13 | ||
| HH 34 | CO, HH | 30,29 | 1.3 | 1.1 | 4 | 480 | 31 |
| L1641-N | CO, HH | 32, 69 | 2.2 | 2.8 | 85 | 480 | 33 |
| HH 38-43 | HH | 27 | 4 | 480 | 31 | ||
| Haro 4-255 FIR | CO | 72 | 2.2 | 2.1 | 4 | 480 | 31 |
| L1641-S3(high velocity) | CO | 1 | 2.0 | 2.4 | 2 | 480 | 1 |
| HH 68 | HH | 1 | 2 | 460 | 1 | ||
| B35 | CO | 10 | 1.2 | 4.0 | 11 | 500 | 34 |
| HH 26 IR | CO, HH | 36,35 | 2.8 | 2.5 | 7 | 470 | 13 |
| HH 25 MMS | CO, HH | 75,35 | 2.4 | 2.1 | 7 | 470 | 13 |
| NGC 2071 | CO | 37 | 2.44 | 2.5 | 7 | 500 | 8 |
| HH 270 IRS | HH | 1 | 0.67 | 0.7 | 2 | 460 | 1 |
| IRAS 05487+0255 | CO | 1 | 0.8 | 0.7 | 2 | 460 | 1 |
| HH 111 | CO, HH | 1 | 0.56 | 0.5 | 2 | 460 | 1 |
| Mon R2 | CO | 38 | 1.2 | 1.2 | 7 | 800 | 8 |
| Mon R2-N | CO | 76 | 1.0 | 1.0 | 7 | 800 | 8 |
| GGD 12-15 | CO | 39 | 1.52 | 2.0 | 7 | 1000 | 8 |
| RMon | CO, HH | 40, 35 | 7 | 800 | 13 | ||
| NGC 2264 (HH 14-4/5/6) | HH | 41 | 4 | 800 | 13 | ||
| HH 120 | CO, HH | 43,77,42 | 1.8 | 2.5 | 44 | 400 | 45 |
| L1709 | CO | 1 | 2 | 160 | 1 | ||
| L43 | CO | 72 | 2.7 | 2.2 | 4 | 160 | 46 |
| L100 | CO | 47 | 0.5 | 0.3–0.5 | 85 | 225 | 48 |
| L483 | CO | 47 | 4.54 | 14 | 85 | 200 | 49 |
| L588 | CO, HH | 1 | 1.3 | 4.1 | 2 | 310 | 1 |
| R CrA (HH 100-IR) | CO, HH | 72,50,79 | 2.8 | 2.0 | 4 | 130 | 51 |
| R CrA (IRS 7) | CO, HH | 72,50,78 | 1.6 | 1.8 | 4 | 130 | 51 |
| L673 | CO | 52 | 2.1 | 2,85 | 300 | 3 | |
| CB 188 | CO | 1 | 2 | 300 | 1 | ||
| HH 32a | CO, HH | 17,35 | 4 | 300 | 13 | ||
| L778 | CO | 10 | 1.8 | 6.3 | 11 | 250 | 8 |
| B335 | CO, HH | 53,54 | 1.2 | 7.9 | 11 | 250 | 13 |
| L797 | CO | 1 | 2 | 700 | 1 | ||
| IRAS 20050 | CO | 1 | 1.7 | 3.6 | 2 | 700 | 1 |
| V1057 Cyg | CO | 1 | 0.3 | 0.2 | 2 | 700 | 1 |
| L1228 | CO, HH | 55,56 | 2.71 | 5.3 | 85 | 300 | 56 |
| V1331 Cyg | CO, HH | 72,80 | 0.5 | 2.3 | 4 | 700 | 57 |
| L1172 | CO | 10 | 1.8 | 7.9 | 11 | 440 | 8 |
| CB 232 | CO | 1 | 0.58 | 0.9 | 2 | 600 | 1 |
| IC 1396 E | CO | 1 | 0.86 | 1.4 | 2 | 750 | 1 |
| NGC 7129 | CO, HH | 58, 59 | 0.52 | 0.36 | 7 | 1000 | 13 |
| HHL73 (IRAS 21429+4729) | CO | 60 | 1.66 | 3.2 | 85 | 900 | 61 |
| HHL73 (IRAS 21432+4719) | CO,HHL,HH | 60,61,81 | 1.25 | 1.1 | 28 | 900 | 61 |
| HHL73 (IRAS 21441+4722) | CO | 60 | 0.7 | 85 | 900 | 61 | |
| L1165 | CO,HH | 1 | 0.35 | 0.9 | 2 | 750 | 1 |
| S140N (IRAS 22178+6317) | CO | 32 | 0.88 | 1.4 | 28 | 900 | 63 |
| S140N (Star 2) | CO, HH | 82,62 | 1.2 | 1.9 | 28 | 900 | 63 |
| L1221 | CO, HH | 1 | 2.5 | 3.9 | 2 | 200 | 1 |
| L1251 (IRAS 22343+7501) | CO, HH | 64,65 | 0.29 | 1.7 | 85 | 300 | 66 |
| L1251 (IRAS 22376+7455) | CO, HH | 64,67 | 1.71 | 3.1 | 85 | 300 | 66 |
| L1262 | CO | 47 | 1.57 | 85 | 200 | 68 | |
|
Notes. Regions with distance kpc.
a Main brightness temperature at the position of the suspected exciting source. b Lower limit of the beam-averaged column density at the position of the suspected exciting source.\tablebib (1) see Table 1; (2) this paper; (3) Herbig & Jones 1983; (4) Anglada et al. 1989; (5) Eiroa et al. 1994a; (6) Snell et al. 1984; (7) Torrelles et al. 1983; (8) Fukui et al. 1993; (9) Goldsmith et al. 1984; (10) Myers et al. 1988; (11) Benson & Myers 1989; (12) Strom et al. 1986; (13) Reipurth 1994; (14) Elias 1978; (15) Snell et al. 1980; (16) Mundt & Fried 1983; (17) Edwards & Snell 1982; (18) Mundt et al. 1988; (19) Eiroa et al. 1994a; (20) Heyer et al. 1987; (21) Edwards & Snell 1984; (22) Jones et al. 1984; (23) Bachiller et al. 1990; (24) Maddalena & Morris 1987; (25) Reipurth 1989; (26) Bally et al. 1994; (27) Haro 1953; (28) Verdes-Montenegro et al. 1989; (29) Haro 1959; (30) Chernin & Masson 1995; (31) Genzel et al. 1981; (32) Fukui et al. 1986; (33) Chen et al. 1993; (34) Felli et al. 1992; (35) Herbig 1974; (36) Snell & Edwards 1982; (37) Bally 1982; (38) Loren 1981; (39) Rodríguez et al. 1982; (40) Cantó et al. 1981; (41) Adams et al. 1979; (42) Cohen & Schwartz 1987; (43) Olberg et al. 1989; (44) Persi et al. 1994; (45) Petterson 1984; (46) Chini 1981; (47) Parker et al. 1988; (48) Reipurth & Gee 1986; (49) Ladd et al. 1991a; (50) Strom et al. 1974; (51) Marraco & Rydgren 1981; (52) Armstrong & Winnewisser 1989; (53) Frerking & Langer 1982; (54) Vrba et al. 1986; (55) Haikala & Laureijs 1989; (56) Bally et al. 1995; (57) Chavarría-K 1981; (58) Loren 1977; (59) Ray et al. 1990; (60) Dobashi et al. 1993; (61) Gyulbudaghian et al. 1987; (62) Eiroa et al. 1993; (63) Crampton & Fisher 1974; (64) Sato & Fukui 1989; (65) Balázs et al. 1992; (66) Kun & Prusti 1993; (67) Eiroa et al. 1994b; (68) Parker et al. 1991; (69) Reipurth et al. 1998; (70) Bally et al. 1997; (71) Gómez et al. 1997; (72) Levreault 1985; (73) Hogerheijde et al. 1998; (74) Tamura et al. (1996); (75) Gibb & Davis 1998; (76) Tafalla et al. 1997; (77) Nielsen et al. 1998; (78) Anderson et al. 1997; (79) Whittet et al. 1996; (80) Mundt & Eislöffel 1998; (81) Devine, Reipurth & Bally 1997; (82) Davis et al. 1998; (83) Davis et al. 1997; (84) Hoddap & Ladd 1995; (85) Anglada, Sepúlveda & Gómez 1997. |
|||||||
Appendix A Results for individual sources
A.1 M120.1+3.0-North
This region is associated with a bipolar molecular outflow (Yang et al. 1990) and contains several low-luminosity objects. Two of these objects, IRAS 00213+6530 and IRAS 00217+6533, fall inside the outflow lobes. On the basis of the geometrical position of IRAS 00213+6530, close to the emission peak of the blue-shifted gas, and its cold IR colors, Yang et al. (1990) favor this source as the driving source of the outflow. We observed the region around both IRAS sources in ammonia.
The NH3 structure (Fig. 7) consists of two sub-condensations, each one peaking very close to the position of an IRAS source. This suggests that both IRAS sources are embedded in the high density gas. Our results show that the velocity is different for each clump (see Table 3 and Fig. 8). The observed difference in velocity is consistent with a gravitationally bound rotational motion of the two clumps.
The association of IRAS 00213+6530 with an ammonia emission maximum supports its identification as the outflow exciting source. However, we note that IRAS 00217+6530 falls very close to the position of an ammonia emission peak, it lies close to the emission peak of the outflow redshifted gas and its IRAS colors are characteristic of an embedded source (although the source appears confused in the 60 and 100 m IRAS bands). Therefore, based on these results, both IRAS sources are valid candidates for the outflow excitation.
The radio continuum sources detected in the region (Anglada, G., private communication) fall outside the ammonia condensation (see Fig. 7), therefore they appear to be unrelated to the star-forming region.
A.2 M120.1+3.0-South
This region is associated with several IRAS sources and with a CO bipolar outflow (Yang et al. 1990). The outflow is asymmetric, with the red lobe more intense than the blue one. Two sources, IRAS 00259+6510 and IRAS 00256+6511, lie inside the outflow lobes. Yang et al. proposed IRAS 00259+6510 as the driving source of the outflow. We observed the region around both sources in ammonia.
The NH3 condensation (Fig. 9) shows an elongated structure in the NW-SE direction. Both IRAS 00259+6510 and IRAS 00256+6511 are located close to the ammonia emission maximum, suggesting that they are embedded sources. Both sources have similar IRAS colors, but appear confused at 60 and 100 m. Therefore, we cannot favor one of them as the driving source of the outflow.
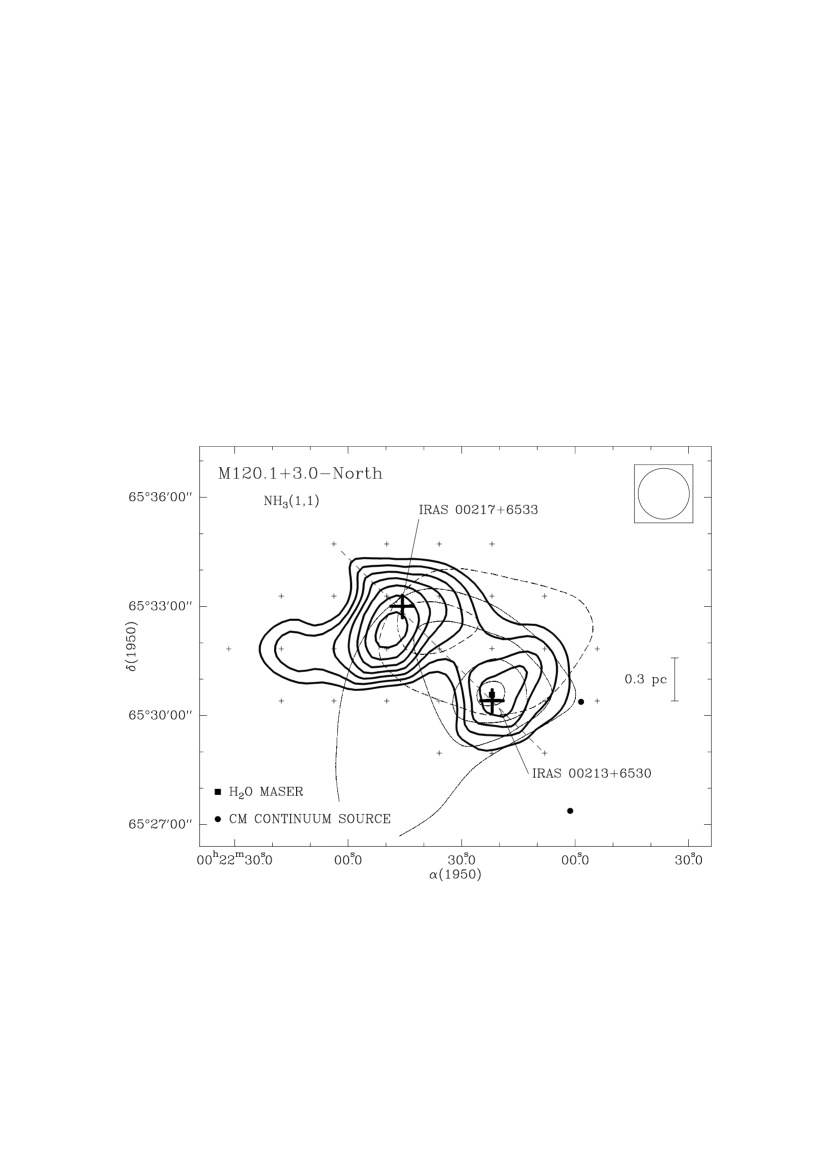

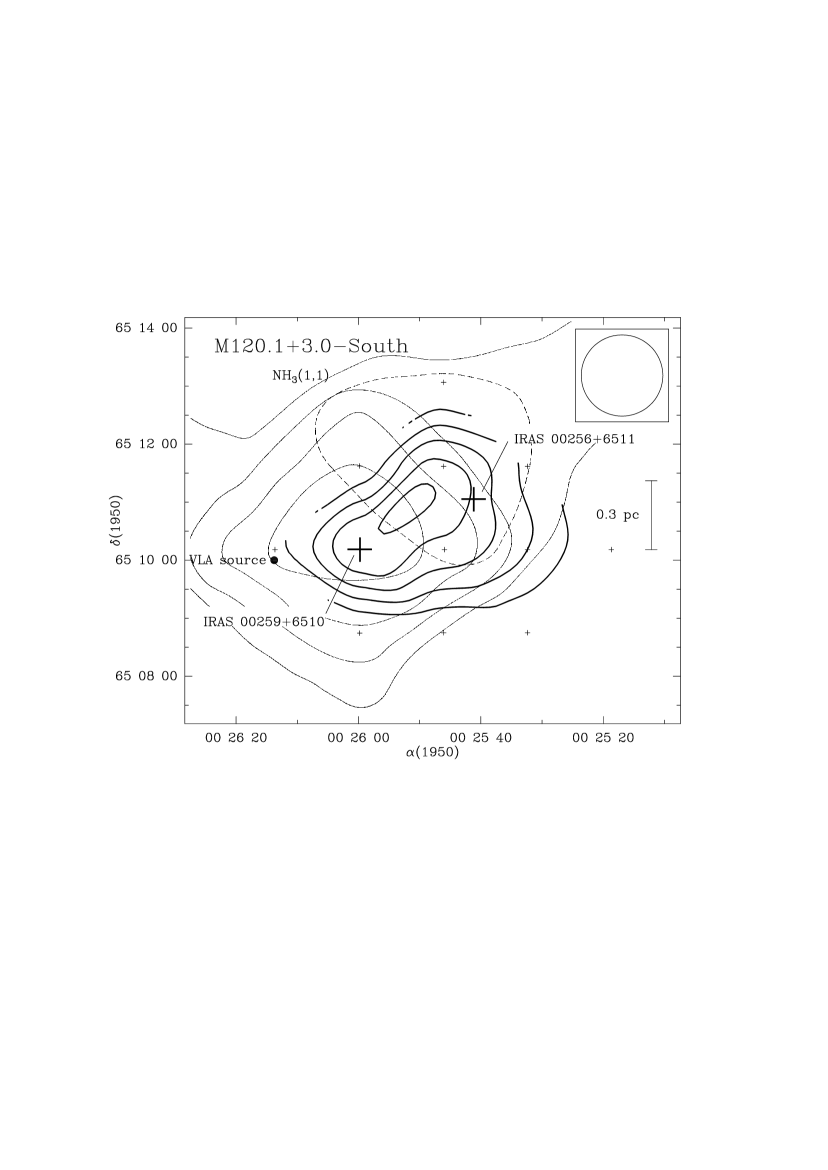
A cm radio continuum source is detected at the edge of the ammonia condensation (Anglada, G., private communication). Unfortunately, the information available for this source is not enough to infer the nature of the emission.
A.3 L1287
The dark cloud L1287 is associated with an energetic bipolar molecular outflow (Snell et al. 1990, Yang et al. 1991). At the center of the outflow lies the source IRAS 00338+6312, that has been proposed as the outflow exciting source (Yang et al. 1990). The brightest visible object in the region, RNO 1 (Cohen 1980), lies NE of the nominal IRAS position. However, because of the low angular resolution of the IRAS data, several young stellar objects (a FUOri binary system RNO 1B/1C and several radio continuum sources) fall inside the IRAS error ellipsoid. Kenyon et al. (1993) proposed the FU Ori star RNO 1C as the outflow exciting source. However, additional studies by Anglada et al. (1994) favored a jet-like radio continuum source, VLA 3, located very close to the IRAS nominal position and to the symmetry center of the polarization pattern (Weintraub & Kastner 1993), as the most likely candidate to be the exciting source. The detection of H2O maser emission associated with VLA 3 (Fiebig 1995), and the interpretation of the H2O velocity pattern as a infalling disk (Fiebig 1997) further supports VLA 3 as the outflow exciting source.
The region was observed in HCN, HCO+ (Yang et al. 1991), CS (Yang et al. 1995; McMuldroch et al. 1995), and in NH3 (Estalella et al. 1993). Estalella et al. (1993) found a gradient in the NW-SE direction, which was interpreted as caused by the rotation of the core.
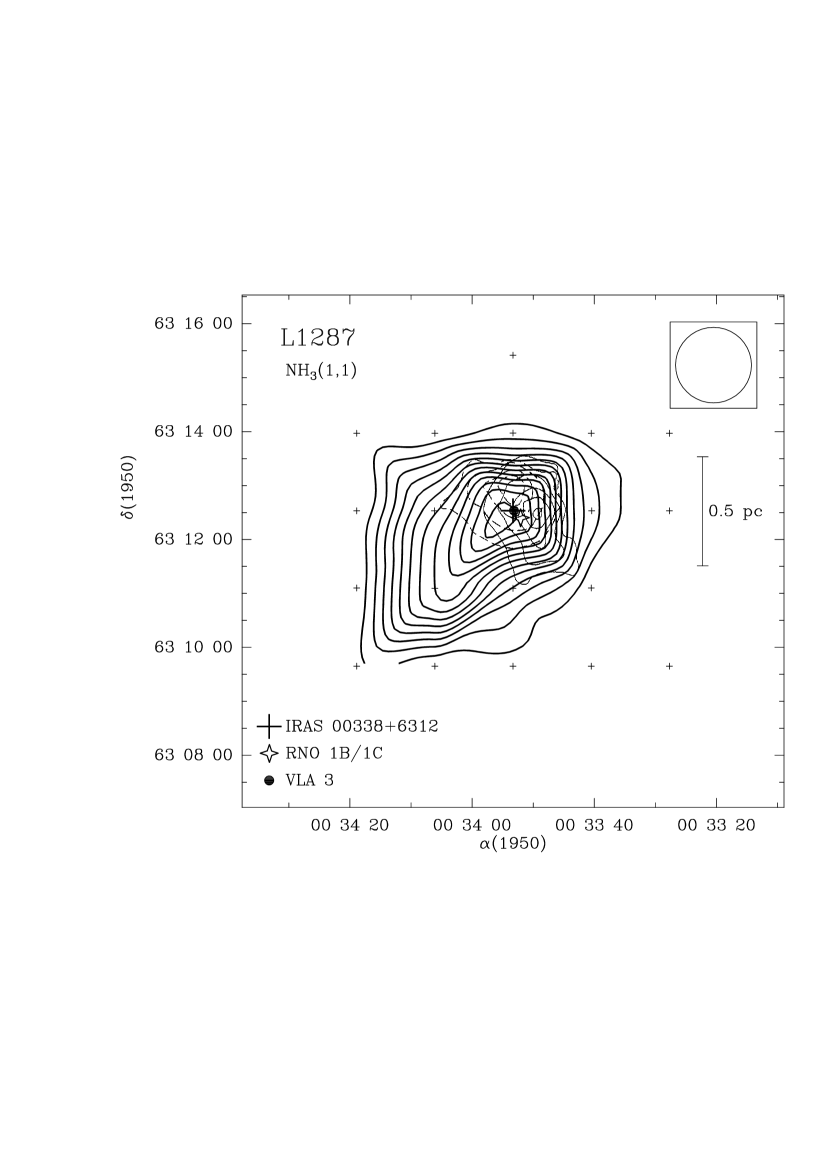
The condensation we mapped (Fig. 10) is clearly elongated in the northwest-southeast direction, perpendicular to the CO outflow axis. We have found a velocity gradient of km s-1 pc-1 in the NW-SE direction. Both results agree well with the results of Estalella et al. (1993). The ammonia emission peaks near the position of IRAS 00338+6312, RNO 1B/1C and VLA 3. However, because of the small projected angular separation between all these objects (″″), we cannot distinguish from our data which of these sources is the best candidate for exciting the outflow in terms of its proximity to the ammonia emission peak. This region was studied in NH3 with high angular VLA resolution (Sepúlveda 2001; Sepúlveda et al. in preparation). These observations revealed that the central region toward the sources has a complex structure and exhibits a complex kinematics.
A.4 L1293
Yang (1990) discovered a bipolar molecular outflow in this region and proposed IRAS 00379+6248 as its driving source.

The NH3 structure presents two emission maxima separated by (Fig. 11). The strongest ammonia peak coincides with the position of IRAS 00379+6248. The HCN, HCO+ and 13CO emission also peak toward the IRAS position (Yang 1990). This IRAS source is not detected at 12 m and its infrared flux increases steeply toward longer wavelengths. These IR results, along with its association with strong NH3 emission and with an H2O maser (Wouterloot et al. 1993), suggest that IRAS 00379+6248 is a young stellar object, deeply embedded in the high density gas, and the most plausible exciting source of the outflow. The weaker emission peak is not associated with any known object.
A.5 NGC 281 A-West
This region is associated with a bipolar molecular outflow proposed to be driven by the luminous source IRAS 00494+5617 (Snell et al. 1990; Henning et al. 1994). A near-IR cluster (Carpenter et al. 1993) and several H2O maser spots are found in association with the IRAS source (Henning et al. 1992). Henning et al. (1994) modeled the observed spectral energy distribution of the source from 1 m to 1 mm, concluding that it is a very good candidate for a deeply embedded and very young protostellar object.
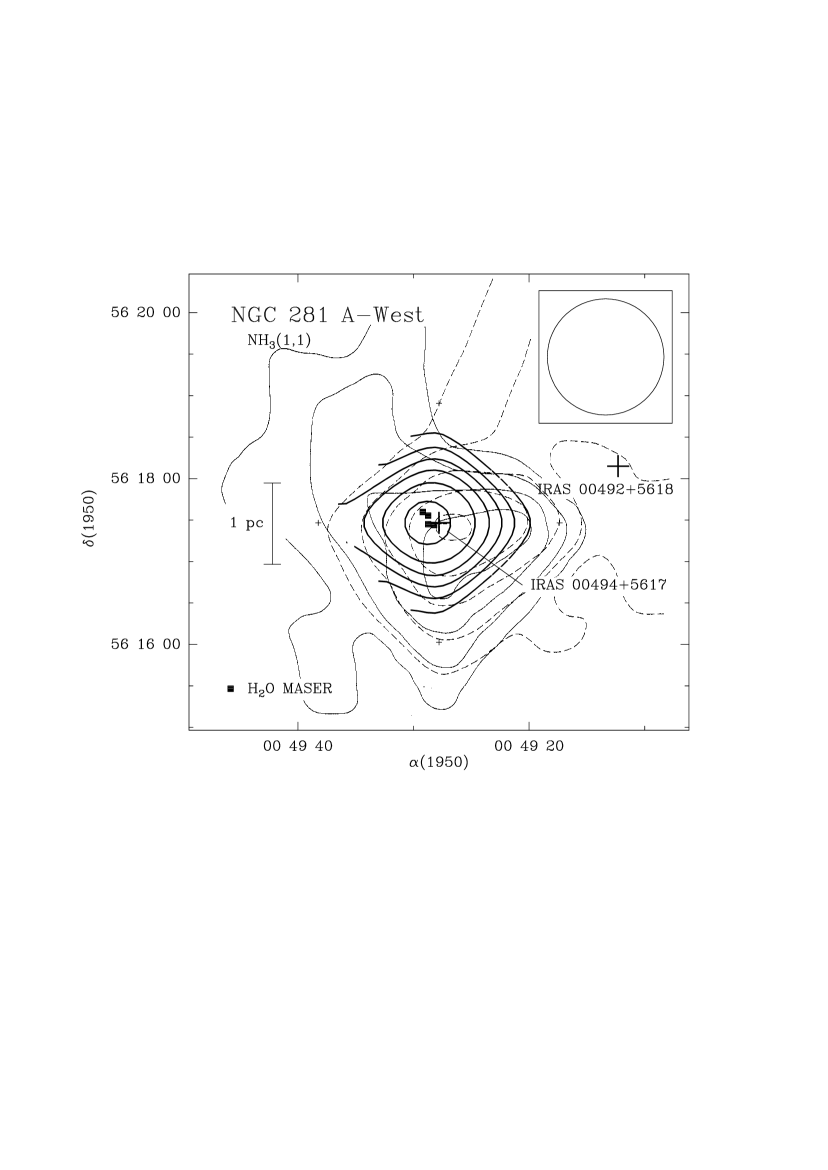
We detected an ammonia clump (Fig. 12), which appears unresolved with our beam. The NH3 emission peaks at the position of IRAS 00494+5617 . Our results agree with the angular resolution NH3 map of Henning et al. (1994), which reveals that the ammonia clump is elongated along the east-west direction with the emission peaking toward the position of the IRAS source. CS emission mapped by Carpenter et al. (1993) with an angular resolution of , also peaks toward the position of the IRAS source. These results, along with the spectral energy distribution of the source, suggest that IRAS 00494+5617 is a very young object deeply embedded in the high density gas and that it is the most likely candidate to excite the outflow.
Our ammonia results suggest that there is no significant amount of dense gas in association with the source IRAS 00492+5618, located to the west of IRAS 00494+5617.
A.6 HH 31
The HH 31 jet is a sinusoidal chain of knots having a linear extent of pc (Herbig 1974; Gómez et al. 1997). Cohen & Schwartz (1983) found four near-IR sources (IRS1, IRS2, IRS3 and IRS4) in the vicinity of the jet, being IRS 2, that coincides with IRAS 04248+2612, the proposed exciting source of the jet. This source has been detected at millimeter and sub-millimeter wavelengths (Moriarty-Schieven et al. 1994) and apparently drives a small molecular outflow (Moriarty-Schieven et al. 1992), although no map has been published. In near-IR images, IRAS 04248+2612 (IRS 2) appears as a bipolar reflection nebula (Padgett et al. 1999). We searched for ammonia emission toward the four near-IR sources.
The ammonia condensation (Fig. 13) is elongated in the NE-SW direction, and it agrees with the NH3 map shown by Benson & Myers (1989). The NH3 emission peak is displaced ( pc) to the SW of the HH 31 IRS2 position. To our knowledge, no source has been reported toward the position of the NH3 emission peak. We suggest that high sensitivity observations could reveal a deeply embedded object at this position. The sources HH 31 IRS2 and IRS1 lie at the edge of the condensation. We have not detected significant emission toward IRS3 and IRS4, which lie far away (more than ) from the condensation.

A.7 HH 265
HH 265, located in the L1551 cloud, is an isolated Herbig-Haro object whose exciting source still remains unknown. Swift et al. (2005, 2006) mapped the region in NH3 and CS. From their results, these authors suggest that the cloud is likely a prestellar core showing signs of undergoing the first phases of gravitational collapse.
We discovered an H2O maser (see Fig. 3) toward the position of the HH object. The maser shows two velocity components, whose line parameters are given in Table 5. The H2O maser emission suggests the presence of a nearby exciting source, which could be also responsible for the excitation of HH 265. However, it is also suggested that HH265 could be the end of a jet emanating from the source LkH 358 (Moriarty-Schieven et al. 2006; Movsessian et al. 2007).
Our ammonia map (see Fig. 14) shows that both the H2O maser and the HH object fall inside the ammonia condensation, but they are displaced by ( pc) to the SE of the position of the ammonia maximum. We suggest that a sensitive search in the submm, mm, or cm range in the vicinity of the NH3 emission peak could reveal an embedded object, responsible for the excitation of HH 265. The mass derived for this region (see Table 6) exceeds the virial mass by a factor of five, a result that may indicate that a significant fraction of the cloud is still undergoing the process of gravitational collapse toward a central, embedded protostar, in good agreement with the results obtained by Swift et al. (2005, 2006).
A 20 cm source, located to the NE of HH 265, was detected by Snell & Bally (1986). However, this source lies outside the ammonia condensation and was not detected at shorter wavelengths (6 cm and 2 mm; Snell & Bally 1986), suggestive of a negative spectral index, characteristic of background extragalactic sources. Unfortunately, sensitive observations reaching the position of the ammonia maximum are not available.

A.8 L1551 NE
L1551 NE is a young stellar object in the L1551 molecular cloud. It is located very close () to the well-studied embedded source L1551 IRS 5. The proximity to the red lobe of the large IRS 5 outflow has made difficult the study of the L1551 NE outflow itself. Moriarty-Schieven, Buttner & Wannier (1995) suggest the presence of a weak molecular outflow from this source and Devine, Reipurth & Bally (1999) concluded that L1551 NE drives an HH flow (HH 454) and that probably drives the objects HH 28 and 29, that were previously attributed to IRS 5.
We detected intense ammonia emission toward the position of L1551 NE (see spectrum in Fig. 1), but the proximity to IRS 5, which is associated with a strong NH3 condensation (Torrelles et al. 1983) makes it difficult to separate both components. Higher angular resolution observations of high density tracers are needed to detect the structure of dense gas around L1551 NE.
A.9 L1634
L1634 contains two H2 bipolar jets (Hoddap & Ladd 1995). One of them, HH 240-241, is constituted by several H2 knots symmetrically located from the source IRAS 051730555, which has been proposed as the driving source (Hoddap & Ladd 1995; Davis et al. 1997). The jet extends from east (knots HH 241A-D) to west (knots HH 240A-D). Knots HH 240A and HH 241A were previously known as RNO 40 and RNO 40E (Jones et al. 1984). CO observations (Davis et al. 1997) reveal the presence of a molecular outflow associated with IRAS 051730555, a cm and a submm source, proposed as a Class 0 (Beltrán et al. 2002). The second bipolar jet only has two knotty bow shocks (knots 9 and 4; Hoddap & Ladd 1995; see Fig. 15). The near-IR source IRS 7 located near the center of the jet, has been proposed as the powering source of this outflow (Hoddap & Ladd 1995; Davis et al. 1997). The CO outflow (Lee et al. 2000) shows a distribution similar to that of the H2 jets.

Our map (Fig. 15) shows that both, IRAS 05173-0555 and IRS 7 are associated with dense gas. The NH3 emission peak is located close ( pc) to the position of the IRAS source. This source has a steeply rising spectral energy distribution through the IRAS bands and it is detected at cm, mm, and submm wavelengths (see references in Table 7). These results together with its association with the ammonia core suggest that IRAS 051730555 is a very young object deeply embedded in the high density gas and that it is a very good candidate for exciting the optical jet HH240-241 and the molecular outflow. The near-IR source IRS 7 is displaced by ( pc) to the SE of the position of the emission maximum. The association of IRS 7 with high density gas suggests that it is a very young stellar object as suggested by Beltrán et al. (2002).
We noted that the central velocity of the ammonia lines increases to the west of the peak position. We found a velocity shift of km s-1 between the ammonia peak position and the position of knot HH 240 A. This knot has a large proper motion away from the IRAS source (Jones et al. 1984). The velocity shift detected could results from the interaction between the jet and the dense gas. Indeed, Whyatt et al. (2009) find that the HH objects are illuminating the molecular gas, enhancing the emission of the HCO+ associated with a dense molecular condensation within the ammonia core.
A.10 IRAS 05358+3543
IRAS 05358+3543 was proposed as the exciting source of a bipolar molecular outflow (Snell et al. 1990). Observations at higher angular resolution resolved the outflow into at least three different outflows, two of them forming a quadrupolar system (Beuther et al. 2002). Tofani et al. (1995) detected four H2O maser spots close to the IRAS position. Millimeter and submillimeter emission around the IRAS source resolved at least four cores in the region within separations between 4”-6”. At least two of these mm cores will be likely the exciting source of the molecular outflows (Beuther et al. 2007, Leurini et al. 2007).
We found an NH3 condensation elongated in the north-south direction (Fig. 16). The NH3 emission peaks at the position of the IRAS source. This positional coincidence, as well as its proximity to H2O maser emission, along with the fact that its infrared emission increases steeply toward longer wavelengths, suggest that IRAS 05358+3543 is a very young stellar object, deeply embedded in the high density gas, favoring this object as the driving source of the molecular outflow. Our angular resolution doesn’t allow us to infer about the subcores into the region.

A.11 L1641-S3
L1641-S3 is a bipolar CO outflow located in the southern part of the L1641 cloud (Fukui et al. 1989, Wilking et al. 1990, Morgan et al. 1991). The outflow is centered on the source IRAS 053750731 (= FIRSSE-101), which has been proposed as its exciting source. The source has been detected in the near-IR, centimeter, millimeter and submillimeter wavelengths ranges with an spectral energy distribution of a Class I source (see references in Table 7). H2O maser emission (Wouterloot & Walmsley 1986) has been detected toward the IRAS source. An H2 giant flow is found probably associated with the IRAS source (Stanke et al. 2000)
In all the positions where emission is detected, the NH3 spectra show two velocity components at 3.8 and 4.9 km s-1, in all the hyperfine lines. Each velocity component peaks at a different position. In Fig. 17 we show the observed spectra at the position of the emission peak for each velocity component.

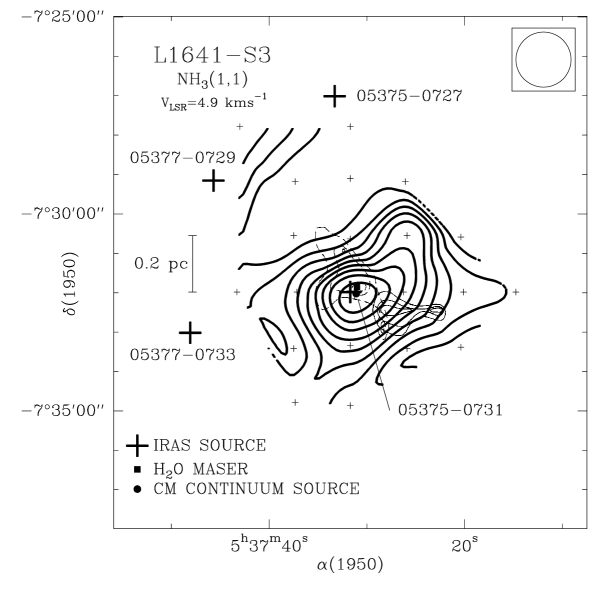
The region has also been mapped in NH3 with an angular resolution of by Harju et al. (1993). These authors present a map of the overall emission, which is consistent with our results, taken into account the difference in the beam sizes and the slight difference in the region covered by the maps. However these authors do not discuss the presence of two velocity components. Since the two velocity components are clearly defined in our spectra, in Figs. 18 and 19 we present separate maps of the two velocity components, and in our analysis we will discuss separately each velocity component.
The map of the component at 4.9 km s-1 (Fig. 18) reveals a well defined NH3 condensation with the position of source IRAS 05375-0731 well centered in the structure and coinciding with the maximum of emission. The main axis of this condensation is elongated roughly in the NW-SE direction, perpendicular to the outflow axis. We also detected NH3 emission toward the NE of the region mapped, near the positions of IRAS 05377-0729 and IRAS 05375-0727, suggesting that these sources may be also associated with high density gas. However, none of the two sources is detected at submillimeter wavelengths (Dent et al. 1998) and only IRAS 05375-0727 has a near-IR counterpart (Strom et al. 1989). Unfortunately, our map is not completed around the positions of these sources, so that we cannot establish their association with high density gas.

The map of the component at 3.8 km s-1 is shown in Fig. 19. The spatial distribution presents an irregular morphology, with several local maxima. The source IRAS 05375-0731 appears projected toward this structure, but it is not as clearly associated with any particular feature.
In summary, we observe that for the 4.9 km s-1 component, the position of the source IRAS 05375-0731 is better centered on the NH3 structure and closer to the emission maximum than for the 3.8 km s-1 component. In addition, the main axis of the 4.9 km s-1 structure is aligned roughly perpendicular to the outflow axis. Finally, the line widths of the 4.9 km s-1 component are broad (see Table 3), suggesting that the dense gas is suffering a perturbation by an embedded object, while the line widths of the 3.8 km s-1 component are narrow, suggestive of a starless core. From these results, we conclude that the source IRAS 05375-0731 is likely associated with the dense gas component at 4.9 km s-1. A study of the local heating through a high angular resolution mapping of the NH3(1,1) and NH3(2,2) could confirm this association.
A.12 CB 34
The small Bok globule CB 34 (Clemens & Barvainis 1988) is associated with the source IRAS 05440+2059, which is the proposed driving source of a bipolar molecular outflow (Yun & Clemens 1994a). IRAS 05440+2059 has near-IR, submillimeter, millimeter and centimeter counterparts (see references in Table 7). Near-IR images revealed a small aggregate of YSOs embedded in the cloud (Alves & Yun 1995). Alves (1995) discovered, from optical and near-IR images, a variable object CB34V, which is identified as an embedded PMS object (Alves et al. 1997).
Moreira & Yun (1995) discovered in this region four Herbig-Haro objects (HH 290S, HH 290 N1, HH 290 N2 and HH 291) and several H2 structures (labeled Q1, Q2, Q3, Q4, hh291X and hh291Y) . These authors suggested that the objects HH 290S/N1/N2 constitute an optical jet driven by an embedded near-IR source HH 290 IRS, that the structure Q1-Q4 is a well collimated H2 jet driven by an embedded object (labeled Q), and that hh291X, hh291Y and HH 291 could be bright knots of an embedded jet, whose driving source remains undetected.
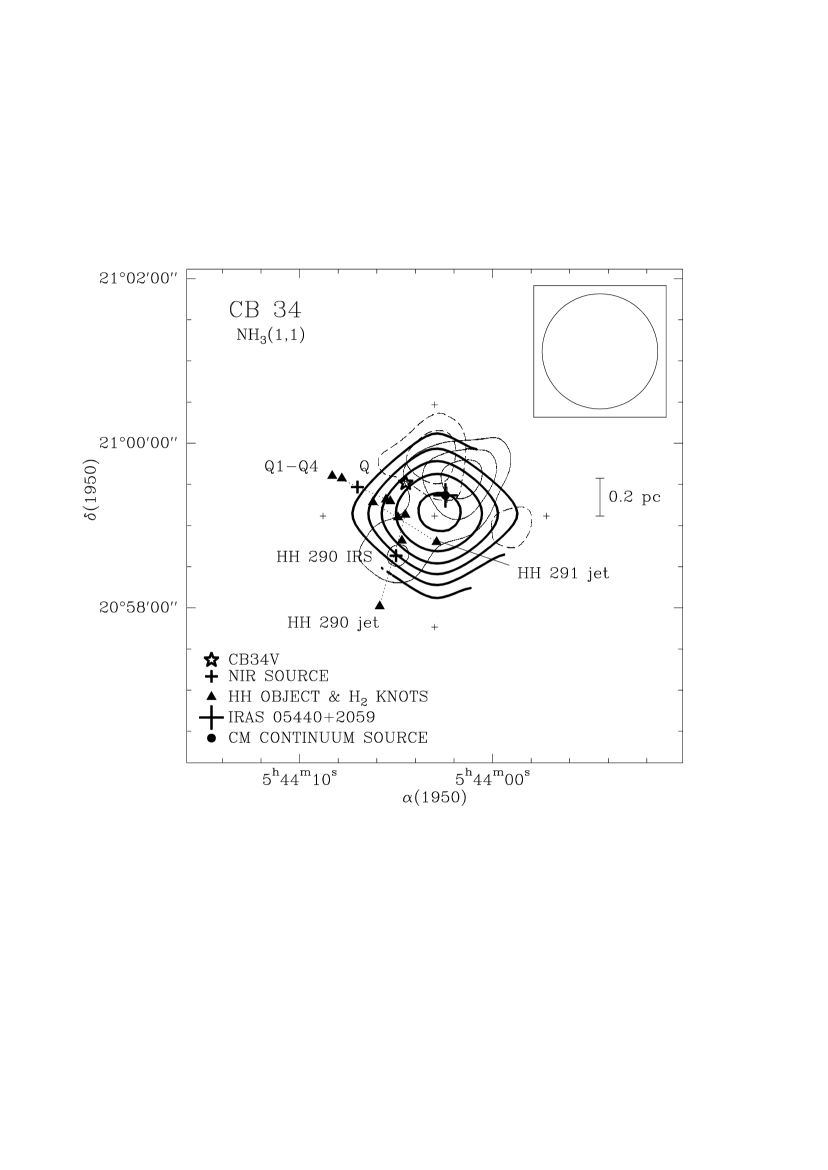
The ammonia structure, unresolved with our beam, peaks close to the position of IRAS 05440+2059 (see Fig. 20), in good agreement with the results obtained from other high-density tracers (CS, Launhardt et al. 1998; HCN, Afonso et al. 1998; NH3, Codella & Scappini 1998). The sources HH 290 IRS and CB34V appear in projection toward the ammonia core, suggesting that they are young stellar objects embedded in the dense molecular gas. These results support the identification of IRAS 05440+2059 as the exciting source of the molecular outflow, and HH290 IRS as the exciting source of an optical jet. The source Q lies at the edge of the condensation. The HH 291 jet, two of whose knots are only detected in the near-IR, also appears projected toward the high density gas, so it can be tracing an embedded jet as proposed by Moreira & Yun (1995). We suggest that the exciting source of this jet could be located in the line connecting the knots and close to the position of the NH3 emission maximum. High-resolution observations could reveal the position of this embedded object.
A.13 L1617
A map of the overall L1617 region where NH3 emission is detected is shown in Fig. 21. The map encloses the ammonia condensations associated with HH 270/110 and with HH 111, as well as their molecular outflows.
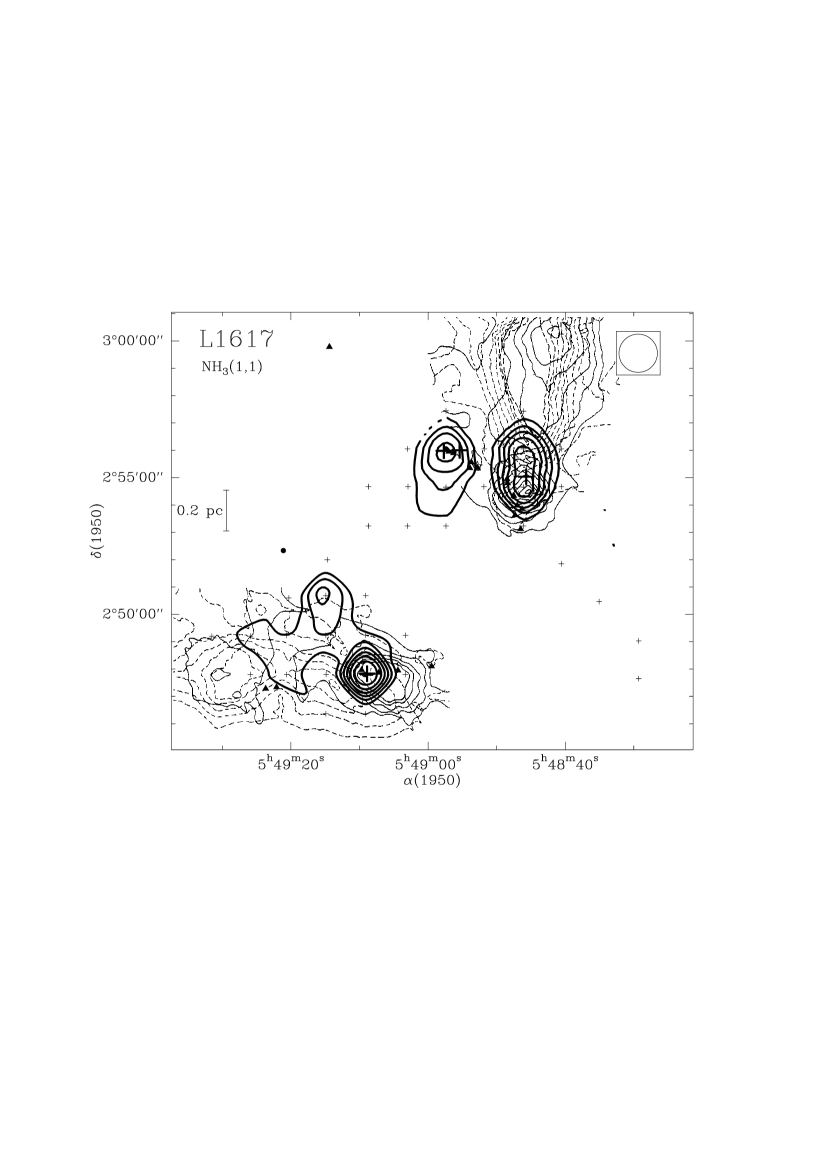
A.13.1 HH 270/110
HH 110 is a well collimated jet located in the L1617 molecular cloud (Reipurth & Olberg 1991). Reipurth et al. (1996) discovered a second jet, HH 270, to the NE of HH 110 and proposed the near-IR source HH 270 IRS as its exciting source. The position of HH 270 IRS lies very close to the error ellipsoid of IRAS 05489+0256 and both sources could be associated. VLA observations of HH 270 IRS at cm wavelengths (Rodríguez et al. 1998) revealed that this source (named VLA1) is elongated along the axis of the HH 270 jet, suggesting that it traces the base of the flow. Reipurth et al. (1996) suggest that the HH 270 jet suffers a grazing collision with a nearby molecular cloud core, thus producing a deflected flow, which is manifested as the HH 110 jet. The kinematical studies (Riera et al. 2003; López et al. 2005) provide some additional evidence of the interaction between the outflow and the surrounding material.
About to the SW of HH 270 IRS, lies IRAS 05487+0255, a source with a spectral energy distribution steeply rising toward longer wavelengths. IRAS 05487+0255 is associated with a near-IR and a VLA source (Davis et al. 1994; Garnavich et al. 1997; Rodríguez et al. 1998), driving a bipolar molecular outflow (Reipurth & Olberg 1991; see Fig. 21) and a H2 jet (Davis et al. 1994; Garnavich et al. 1997) running almost north-south. A second near-IR source, powering another H2 jet extending in the north-south direction, is found a few arcseconds to the south (Davis et al. 1994; Garnavich et al. 1997).
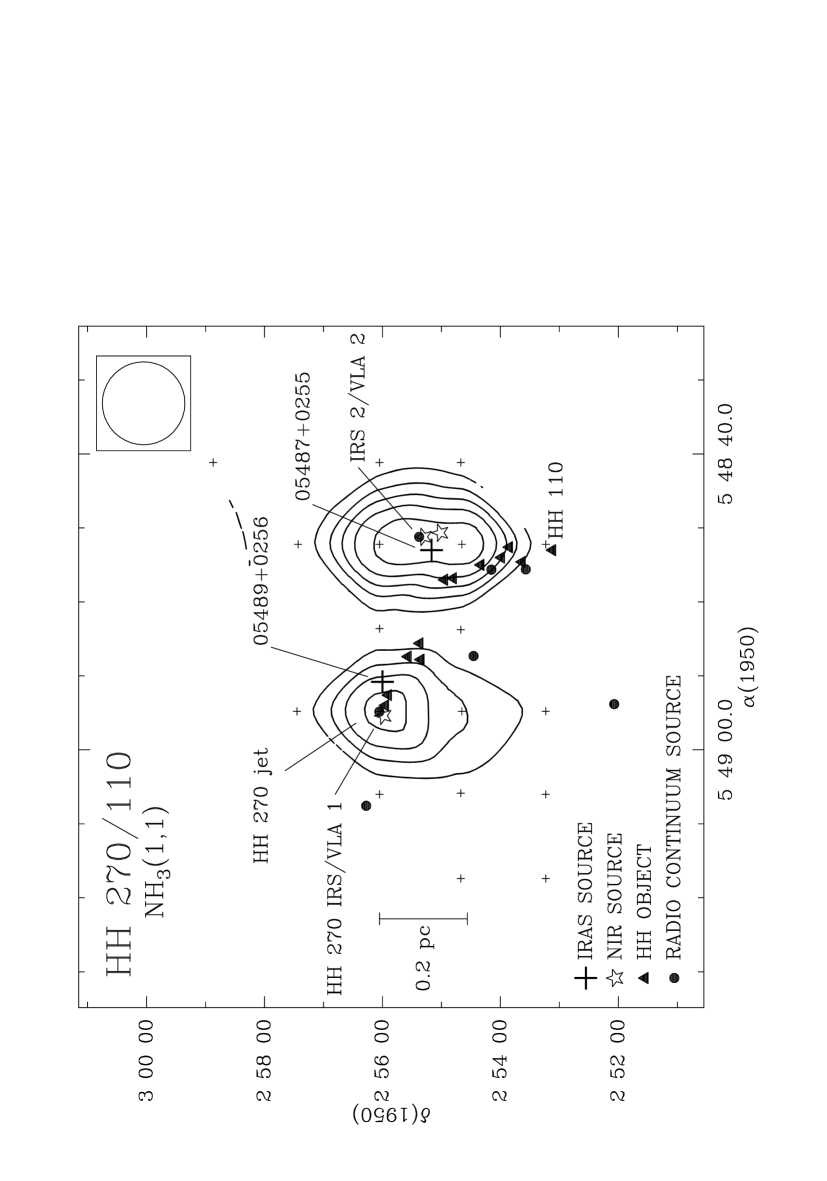
Our ammonia map (Fig. 22) shows two high density clumps, separated by pc, apparently corresponding with two local maxima observed in the 13CO extended structure mapped by Reipurth, Raga & Heathcote (1996). The emission of the eastern NH3 clump peaks at the position of HH 270 IRS/VLA 1, suggesting that this object is embedded in the high density gas, and giving support to its identification as the powering source of the HH 270 jet.
The HH 110 flow is observed toward the SE edge of the western ammonia clump (see Fig. 22). The coincidence of the NH3 clump at the point where the HH 270/110 flow changes abruptly its direction, gives strong support to the scenario proposed by Reipurth et al. (1996), where the HH 110 jet arises as a result of the deflection of the HH 270 jet after a collision with a high-density clump. Our NH3 observations provide evidence for the presence of such a high-density clump.
The western NH3 clump peaks near the positions the proposed exciting sources of the molecular outflow and the H2 jets (see Fig. 22). This result suggest that these sources are embedded objects, giving support to their identification as the driving sources of the molecular outflow and the H2 jets.
The remaining five centimeter continuum sources detected in the region by Rodríguez et al. (1998) (see Fig. 22) have negative spectral index, characteristic of non-thermal emission. One of them (VLA 4) could be associated with the knot HH 110 H and the others are probably background objects unrelated with the star-forming region.
A.13.2 HH 111

HH 111, in the L1617 cloud, is a well collimated jet associated with a highly collimated molecular outflow apparently driven by IRAS 05491+0247 (Reipurth & Oldberg 1991; see Fig. 21), which also has a centimeter counterpart, VLA 1 (Rodríguez & Reipurth 1994, Anglada et al. 1998b). Reipurth, Bally & Devine (1997) proposed that the HH 111 jet (together with HH 113 and HH 311) constitutes a giant flow with a total extent of pc. Gredel & Reipurth (1993) detected an H2 bipolar jet, HH 121, which is almost perpendicular to HH 111 and appears to emanate from the IRAS/VLA 1 source. Cernicharo & Reipurth (1996) resolved the CO outflow into a quadrupolar structure along the axes of the HH111 and HH 121 jets. At smaller scales, the source VLA 1 also shows evidence of a similar quadrupolar structure (Reipurth et al. 1999). These authors detected an additional centimeter source, VLA 2 ( NW of VLA 1), which exhibits some evidence of driving its own outflow.
The NH3 map (Fig. 23) shows a condensation with the emission peaking near the positions of the proposed triple system. The spectral energy distribution of the IRAS source is steeply rising toward longer wavelengths. Altogether this suggests that the sources are deeply embedded in the high density gas.
The remaining radio continuum sources detected in the region (Anglada et al. 1998b) are not associated with dense gas and have negative spectral index, indicating that probably almost all are non-thermal background sources unrelated to the star-forming region.
A.13.3 HH 113
We observed a five-point grid around HH 113 (not shown in Fig.21), which is located to the east of the HH 111 complex. We did not detect significant emission in any of these positions. Reipurth, Bally & Reipurth (1997) suggest that HH 113 is the eastern boundary of the HH 111 complex. The lack of dense gas around this object, and that there are no sources in its vicinity suggests a non local origin for this object, giving support to its identification as part of the HH 111 complex.
A.14 IRAS 05490+2658
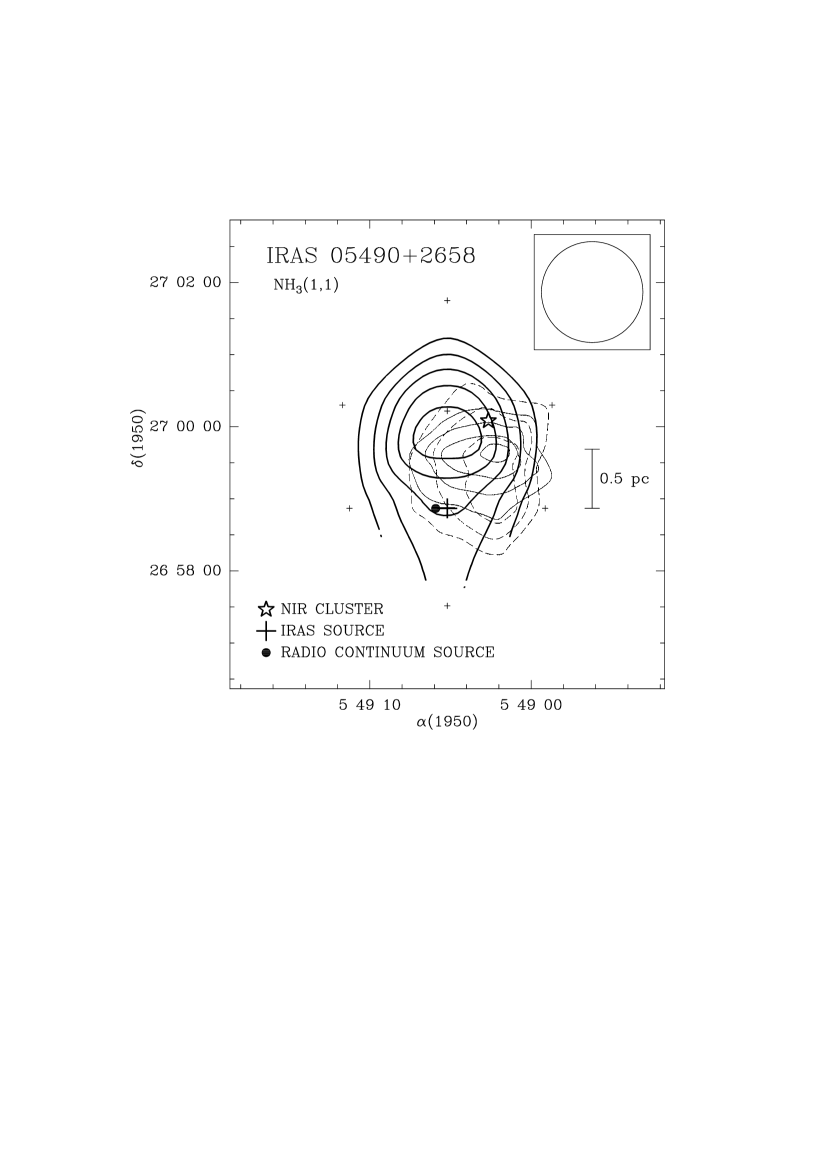
IRAS 05490+2658 lies east of the H II region S242. This IRAS source has been proposed as the exciting source of a poorly collimated molecular outflow (Snell et al. 1990), although it is displaced to the SE of the geometrical center of the outflow. A 6 cm radio continuum source has been detected close to the position of the IRAS source (Carpenter et al. 1990). A near-IR cluster, extending over a region of pc in size, has been detected in the region by Carpenter et al. (1993).
The condensation we mapped in NH3 (Fig. 24) has the emission peak displaced ( pc) to the north of the IRAS source position, but it is very close to the center of the outflow and to the center of the near-IR cluster. This result suggests that some cluster members could be embedded stellar objects, in agreement with the Carpenter et al. (1993) suggestion, and that the outflow exciting source could be located close to the NH3 maximum and to the north of the IRAS position. Sensitive cm continuum observations toward this position could reveal this object.
A.15 CB 54
CB 54 is a Bok globule associated with the source IRAS 07020-1618, which has been proposed as the exciting source of a highly collimated bipolar molecular outflow (Yun & Clemens 1994a). The IRAS source is double in the near-IR (two components CB54YC1-I and CB54YC1-II separated by :Yun & Clemens 1994b) and it is detected also at cm (Yun et al. 1996; Moreira et al. 1997) and mm wavelengths (Launhardt & Henning 1997). Only CB54YC1-II is detected in the mid-infrared images, but three new mid-infrared sources with no near-infrared counterpart were detected spatially coincident with both the IRAS source and the center of the dense core (Ciardi & Gómez Martín 2007).
We found a compact NH3 condensation (Fig. 25) with the emission peaking at the position of the IRAS source, which has a cm radio continuum counterpart. The spectral energy distribution of the IRAS souce is steadily rising at longer wavelengths. Altogether this suggests that the IRAS source is a very young object deeply embedded in the high density gas and favors it as the exciting source.
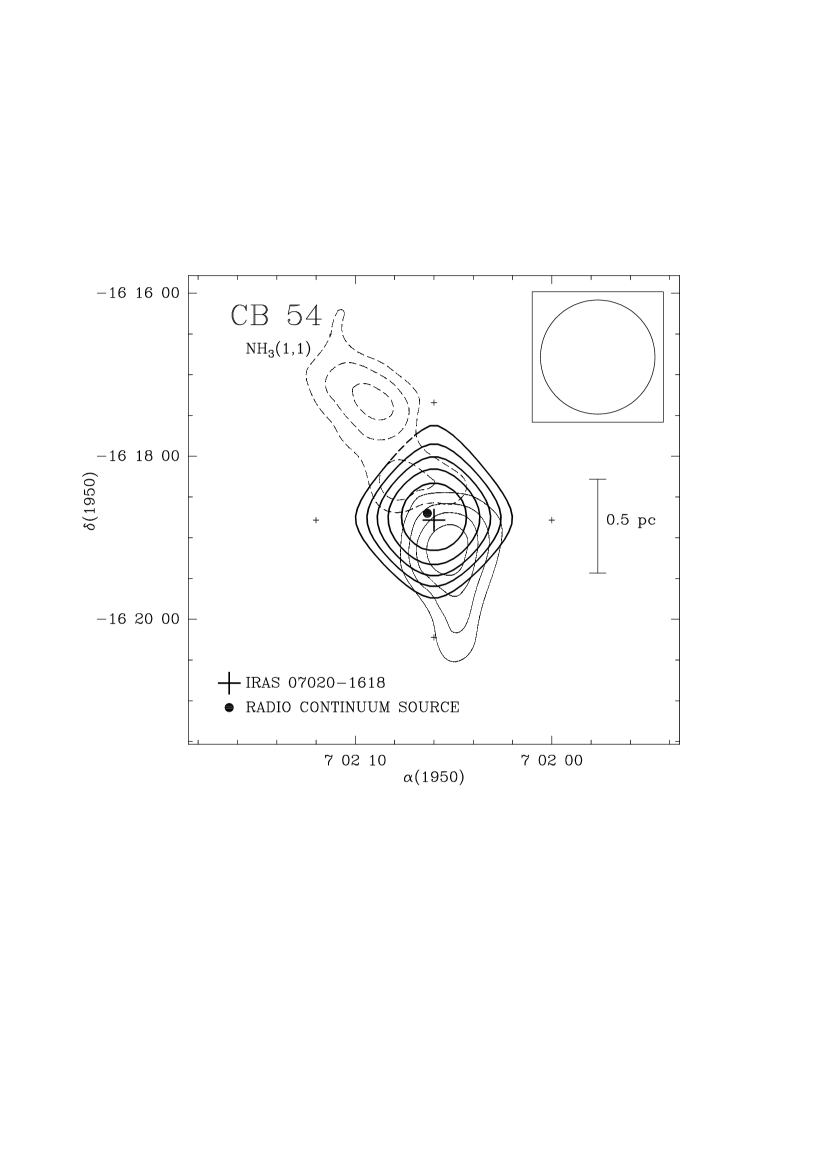
A.16 L379
The dark cloud L379 contains the bright source IRAS 18265-1517, which was proposed as the exciting source of a bipolar molecular outflow (Hilton et al. 1986; Wilking et al. 1990). The red- and blue-wing emission overlap for most of the outflow extension, but the emission maxima are not coincident. This structure has been interpreted as two outflows centered north and south of the IRAS source (Kelly & McDonald 1996). Observations at mm and submm wavelengths have revealed two distinct clumps of dust continuum emission located several arcsecs northwest and southwest, respectively from the IRAS nominal position. This interpretation is supported by the two velocity components found in C18O spectra (McCutcheon et al. 1995; Kelly & Mcdonald 1996). Kelly & McDonald (1996) suggest that the dust clumps probably contain the driving sources of the molecular outflows.
We found an NH3 condensation (Fig. 26) with the emission peaking at the position of IRAS 18265-1517. The spectral energy distribution of this IRAS source rises steeply at longer wavelengths. Altogether this suggests that the IRAS source is a deeply embedded object. Although our ammonia lines are broad, a hint of two velocity components can be appreciated in the satellite lines (see Fig. 1), in agreement with the C18O results (Kelly & McDonald 1996). Both submm sources appear to be associated with NH3 emission, but our angular resolution does not allow us to favor one of them in terms of the proximity to the NH3 maximum.
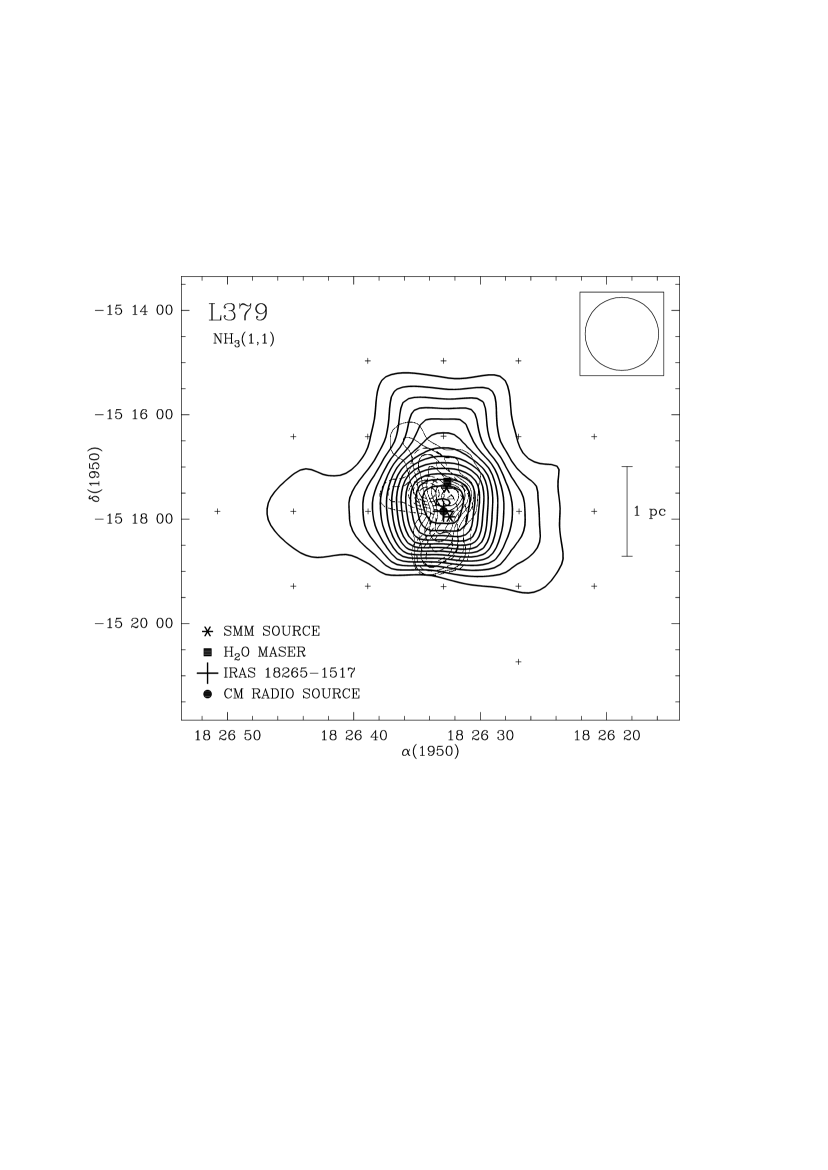
The physical parameters we obtained for this region (Table 6) indicate that L379 is a massive region ( ). The estimated luminosity of the IRAS source is (Kelly & McDonald 1996). The high mass obtained from NH3, together with the high luminosity of the source could indicate that this source is a massive protostellar object, and thus that L379 is a high-mass star-forming region.
A.17 L588
Reipurth & Eiroa (1992) discovered two isolated Herbig-Haro objects, HH 108 and HH 109, in this region and proposed IRAS 18331-0035 as their driving source. Ziener & Eislöffel (1999) found that both HH objects consist of several bright knots, some of them with H2 counterpart. Chini et al. (1997) found two 1.3 mm sources, the stronger is coincident with the IRAS source and the fainter, HH 108 MMS, has no counterpart. At present it is unclear which one of these two sources is the driving source of the HH objects. Parker et al. (1991) detected broad line wings in CO spectra taken toward the IRAS position.

The NH3 map (Fig. 27) shows a condensation elongated in the NE-SW direction, similarly to the molecular cloud mapped in CO by Parker et al. (1991). The ammonia emission maximum is located at the position of IRAS 18331-0035. This result, along with the spectral energy distribution, suggests that the IRAS source is a very young object deeply embedded in the high-density gas. Although the source HH 108 MMS is located inside the NH3 condensation, it is displaced ( pc) to the NE of the emission peak. Owing to its association with the NH3 emission peak, it appears that the source IRAS 18331-0035 is the deepest embedded object and constitutes a very good candidate for the energy source of the HH complex.
From our data we found that the mass of this region exceeds the virial mass by more than a factor of five (see Table 6). This result could indicate that the cloud is in process of gravitational collapse.
A.18 L673
Armstrong & Winnewisser (1989) detected an extended bipolar molecular outflow in this region and proposed the source IRAS 19180+1116, which coincides with the object RNO 109 (Cohen 1980), as its driving source. In a previous work (see Paper I) we have observed in NH3 a region of around the object RNO 109. Those observations revealed an ammonia structure of elongated from northwest to southeast. It consists of three subcondensations peaking at the positions of sources IRAS 19180+1116 (RNO 109), IRAS 19180+1114 and IRAS 19181+1114. The source IRAS 19180+1114 is located close to the strongest emission maximum.
The region was mapped in CS by Morata et al. (1997). The CS emitting region is elongated in the NW-SE direction and is more extended () than the region mapped in ammonia in Paper I. This extended CS emission encompasses the NH3 condensation, and has the emission peak displaced to the south-east of IRAS 19180+1114.
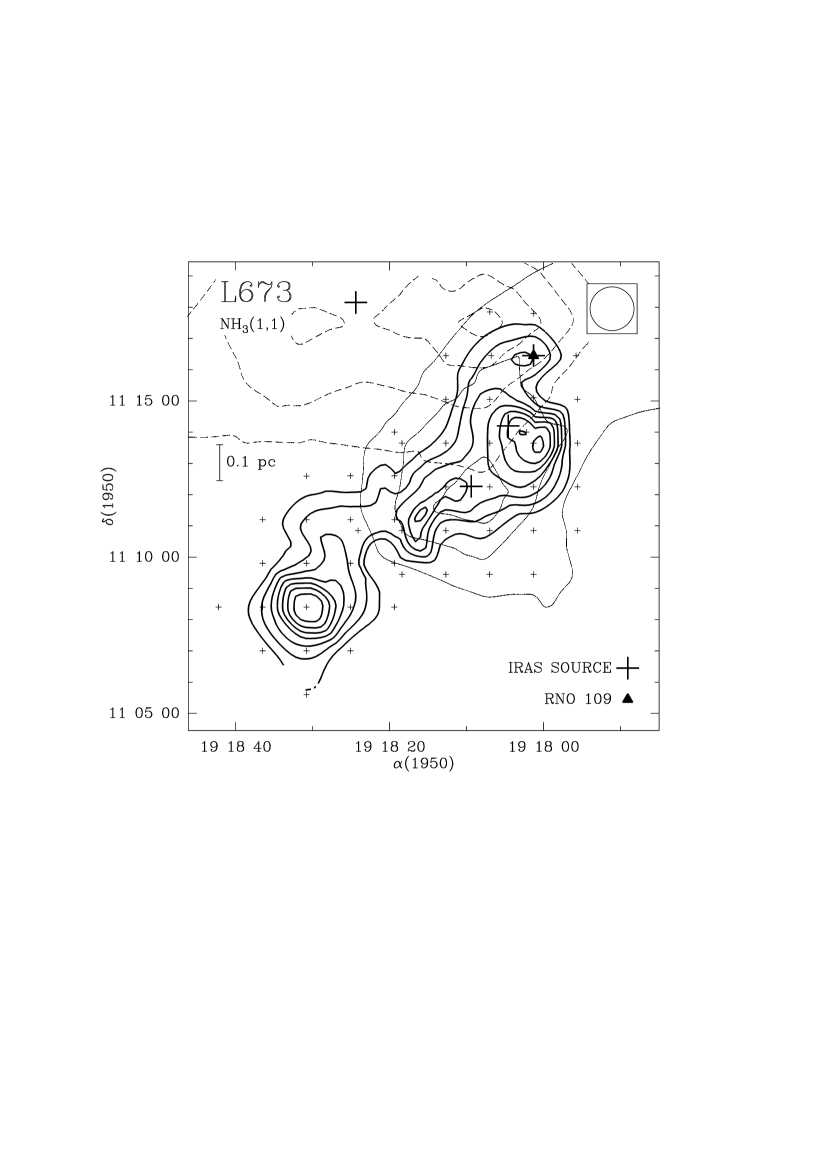
To complete the study in NH3 of this region, we carried out new observations, covering the region around the CS emission maximum. In Fig. 28 we show the complete NH3 map of the region (including the data from Paper I). The new observations reveal that the NH3 emission further extends to the SE, where we found the strongest NH3 maximum of the whole region. Up to now, no source has been found toward this position. Morata, Girart & Estalella (2003, 2005) have found that this core splits in multiple condensations, with no signs of star formation. Most of the condensations are transient, in the sense that they are not gravitationally bound.
A.19 IRAS 20050+2720
Bachiller et al. (1995) mapped a molecular outflow consisting of three pairs of lobes emanating from the vicinity of IRAS 20050+2720, suggesting that two or three independent outflows are driven by young sources embedded in the core. Chen et al. (1997) found a cluster of near-IR sources with three subclusters, two of them are associated with IRAS 20050+2720 and IRAS 20049+2721, respectively. IRAS 20050+2720 was resolved at centimeter wavelengths in two components at subarsec scale (Anglada et al. 1998a) and in four sources at millimeter wavelengths. Two of them, which are separated , are suggested to be protostellar collapse candidates (Choi et al. 1999, Beltrán et al. 2008). An analysis of the velocity fields of H2O masers (Furuya et al. 2005) indicates that one of these millimeter sources (MM1) is driving a powerful jet. IRAS 20049+2721 was barely detected in the IRAS 12 and 25 m bands (2.3 Jy in both bands), but is very bright at longer wavelengths (flux densities are 171.2 and 397.7 Jy in the 60 and 100 m IRAS bands, respectively). A cm continuum source (Anglada et al. 1998a) is detected in association with this source. CS observations show the emission maximum at the position of IRAS 20050+2720, while only weak CS emission was detected toward IRAS 20049+2721 (Bachiller et al. 1995)
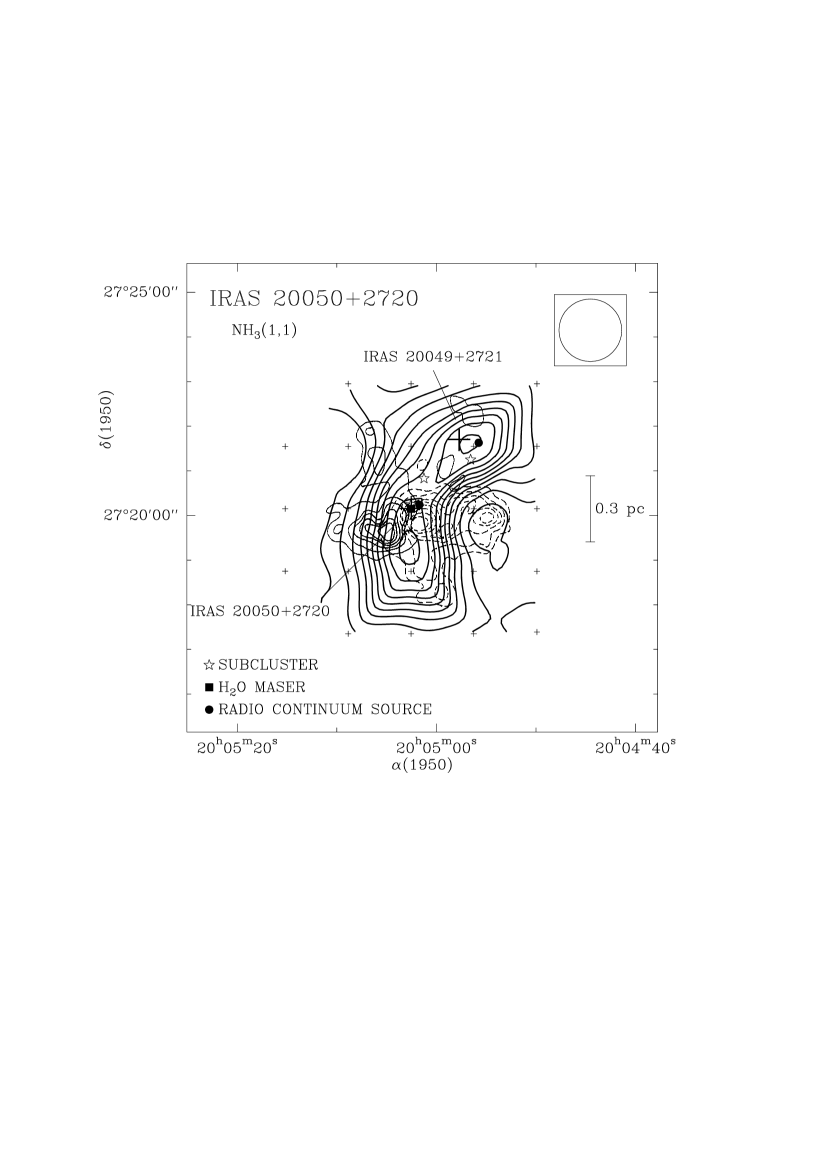
The NH3 condensation (Fig. 29) shows two strong emission peaks, very close to the positions of the IRAS sources of the region, suggesting that both sources are associated with high density gas. The velocities of the two NH3 maxima differ by km s-1 (see Table 3). In Fig. 30 we show a position-velocity diagram along the northwest-southeast direction. The structure of the NH3 emission is consistent with gravitationally bound rotational motion of two clumps.

A.20 V1057 Cyg
V1057 Cyg belongs to the small group of the FU Orionis type stars. Before its flare-up in 1970, it was a T Tauri star. A marginally resolved outflow was reported by Levreault (1989) and Evans et al. (1994). They detected only a blue wing extending to the north, but no contour map is shown.
We detected very weak ammonia emission toward this source (see Fig. 1 and Table 3) and the line analysis was carried out by averaging several positions, so no contour map could be made. This weak emission indicates either a low column density gas or that the NH3 emission is very compact. The lack of a large amount of high-density gas agrees with the fact that the source is optically visible.
A.21 CB 232
This Bok globule is associated with IRAS 21352+4307, which is proposed to be the exciting source of a poorly collimated bipolar molecular outflow (Yun & Clemens 1994a). The IRAS source has near-IR (Yun & Clemens 1995) and millimeter counterparts (Launhardt & Henning 1997), and is associated with two compact submillimeter sources. One of them, SMM1, is proposed as a Class 0 candidate (Huard et al. 1999).
We have detected an ammonia condensation (see Fig. 31) unresolved by our beam, whose emission peak coincides with the position of the IRAS source. Given that the spectral energy distribution of the IRAS source is rising toward longer wavelengths, our results suggest that the IRAS source traces the location of one or several YSOs, deeply embedded in the high density gas, and that the globule is a site of very recent star formation.
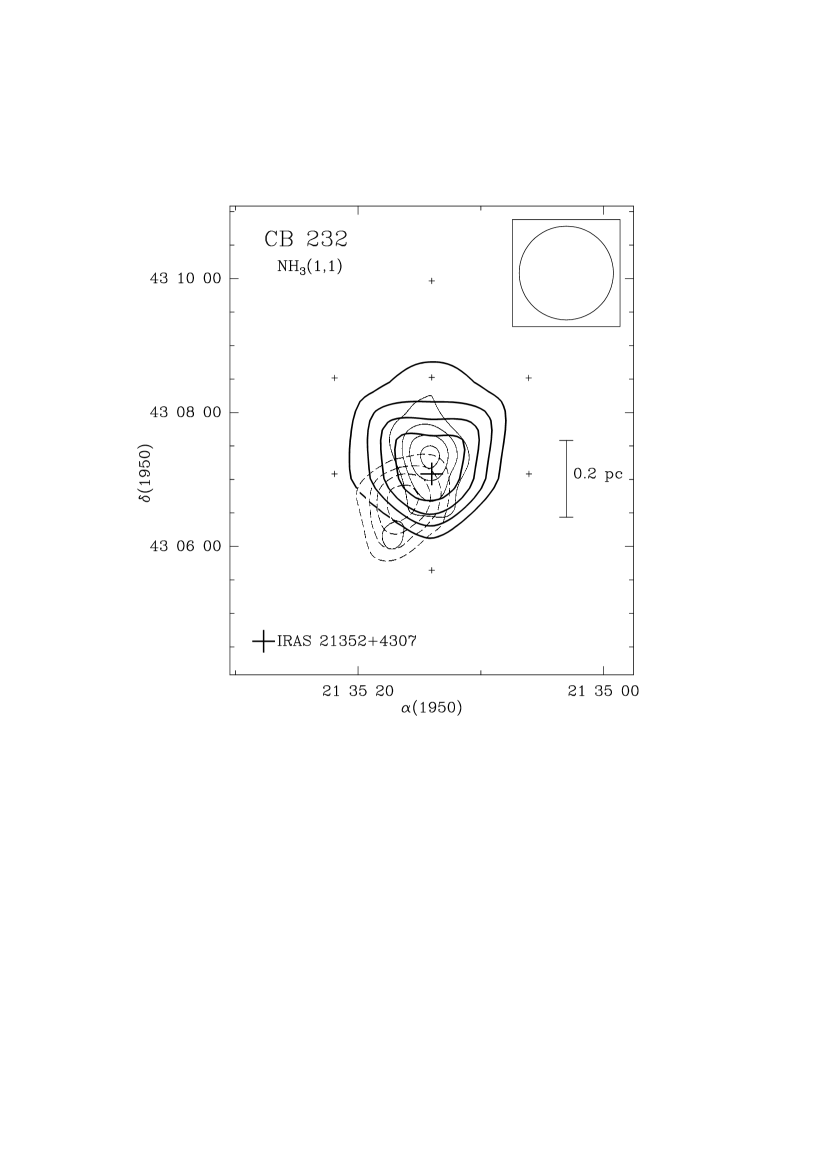
A.22 IC 1396E
IC 1396E is a bright-rimmed cometary globule located in the northern periphery of the H II region IC 1396. Wilking et al. (1990) mapped a bipolar molecular outflow and proposed IRAS 21391+5802, an intermediate-mass YSO which is found roughly at the center of the globule, as the exciting source. This IRAS source is detected at near-IR, submm, mm, and cm wavelengths (Wilking et al. 1993; Beltrán et al. 2002). The molecular outflow axis is oriented at a position angle of , which is similar to the position angle of the H2O maser bipolar outflow observed at scales from 1 to 500 AU (Patel et al. 2000).
The region was mapped in NH3(1,1) and NH3(2,2) (with an angular resolution of ), and several other molecular lines by Serabyn et al. (1993). The NH3 clump mapped by these authors is elongated in the north-south direction and shows a temperature gradient increasing outward from the center and reaching a maximum on the surface most directly facing the stars ionizing IC1396.
Our NH3 map of the condensation (Fig. 32), obtained with a poorer angular resolution, is elongated in the north-south direction, in good agreement with the one obtained by Serabyn et al. (1993). We found for this source a kinetic temperature of K, which is above the average for the sources studied in this paper. Although since we only have observed a single position in the NH3(2,2) line we cannot establish the presence of the temperature gradient reported by Serabyn et al. (1993). The position of the source IRAS 21391+5802 falls very close to the NH3 emission peak. This positional coincidence, as well as the spectral energy distribution of the source, suggest that it is a very young object, deeply embedded in the high density gas and the best candidate to drive the molecular outflow. There are two other IRAS sources in the region, but they lie outside, near the edge of the NH3 condensation (see Fig. 32). At present, little is known about these sources and further studies are required to investigate their nature and relationship with the molecular condensation.
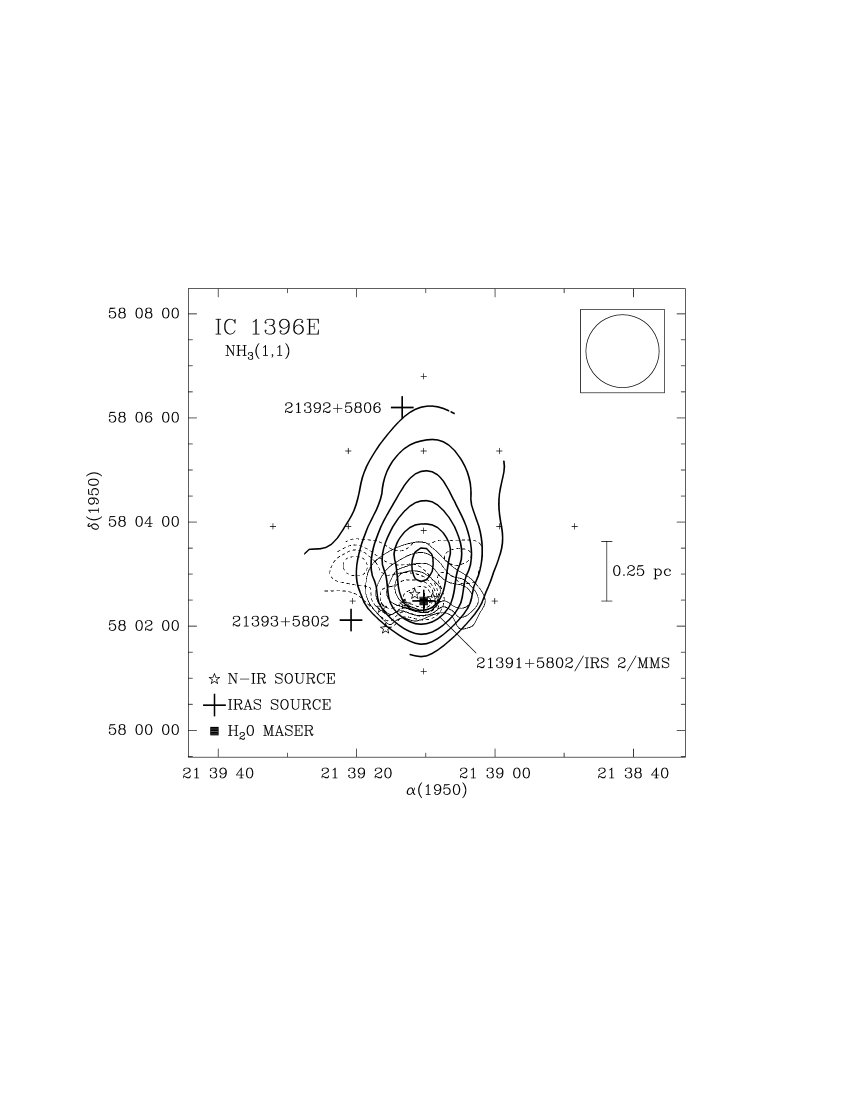
A.23 L1165
L1165 is a small cloud whose distance is not well established. Estimates by different authors range from 200 pc to 750 pc. We will adopt a distance of 750 pc, based on the assumption that the cloud is part of the IC 1396 region (Schwartz et al. 1991). Parker et al. (1991) discovered a bipolar molecular outflow centered on IRAS 22051+5848, which was proposed as the exciting source. This IRAS source, that has a near-IR counterpart (Tapia et al. 1997), is located to the NE of the reflection nebulosity GY 22 (Gyulbudaghian 1982; Reipurth et al. 1997). Reipurth et al. (1997) reported a HH object, HH 354, located NE of the IRAS position and at the end of a cavity in the molecular cloud, possibly excavated by the molecular outflow. These authors proposed that HH 354, the cavity, the molecular outflow and the GY 22 nebulosity are all parts of a single giant outflow excited by the IRAS source. From near-IR spectroscopy, Reipurth & Aspin (1997) concluded that IRAS 22051+5848 (= HH 354 IRS) is a FUor candidate. The source IRAS 22051+5849, which has also a near-IR counterpart (Tapia et al. 1997), lies north of IRAS 22051+5848, well off the axis of the proposed giant outflow.
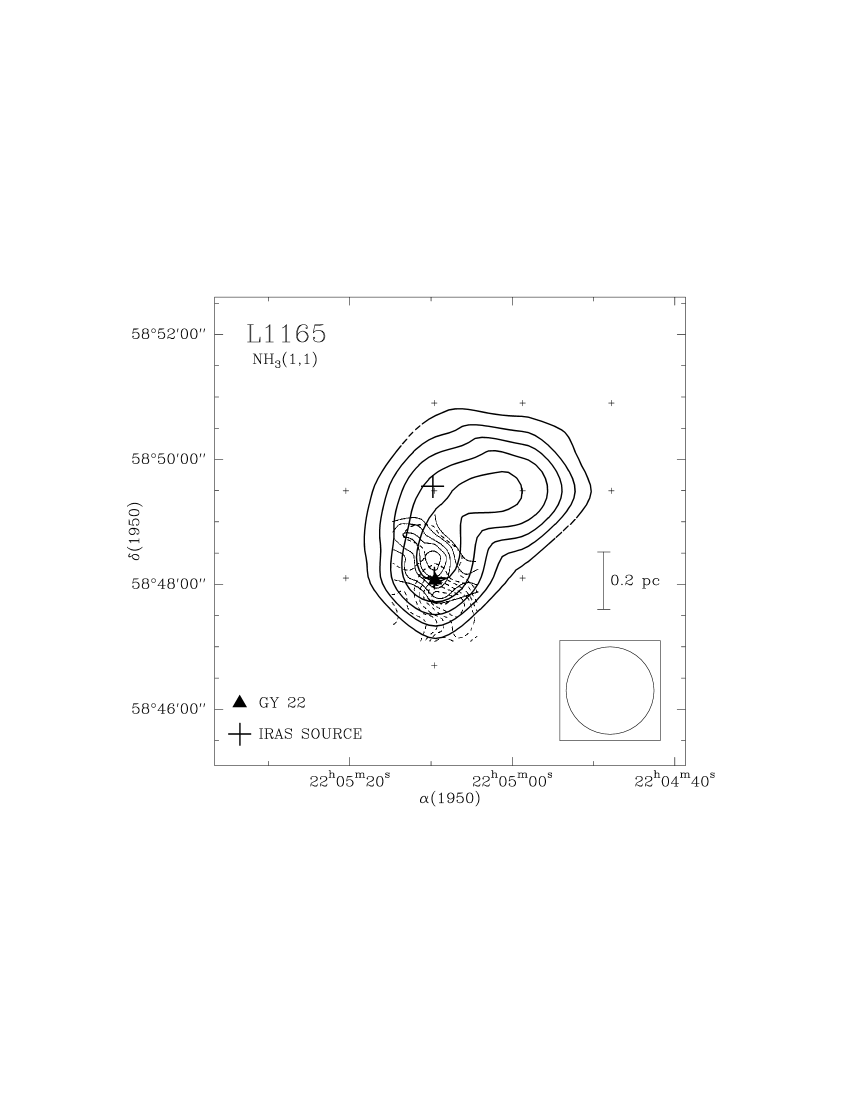
The NH3 map (Fig. 33) shows a condensation with the emission peaking very close to the position of IRAS 22051+5848. The IRAS colors of this source are typical of embedded sources (Parker 1991) and it is surrounded by the reflection nebulosity GY 22. Altogether suggest that IRAS 22051+5848 is a young object embedded in the high density gas. IRAS 22051+5849 is located close to the emission maximum and also appears associated with the dense gas, but its IRAS colors corresponding to a blackbody at K are suggestive of a background source (Tapia et al. 1997). This source needs more accurate observations in order to establish its relationship with the core and the outflow.
A.24 IRAS 22134+5834
The distance of this source is established to be 2.6 kpc (Sridharan et al. 2002), although previously a distance of 900 pc was assumed. Dobashi et al. (1994) discovered a molecular outflow associated with the source IRAS 22134+5834, one of the most luminous sources in the Cepheus region. H2 images (Kumar, Bachiller & Davis, 2002) revealed a dense stellar cluster around the IRAS source, that was interpreted as ring-shaped cluster (Kumar, Ojha & Davis 2003).
The NH3 distribution (Fig. 34) shows a compact condensation with the emission maximum located at the IRAS position, in agreement with the 12CO and 13CO maps obtained by Dobashi et al. (1994). The IRAS source is bright at FIR wavelengths and not at NIR wavelengths. This and its association with high-density gas, suggest that IRAS 22134+5834 is a very young stellar object, a possible massive protostar as suggested by Dobashi et al. (1994) and Kumar et al. (2003).
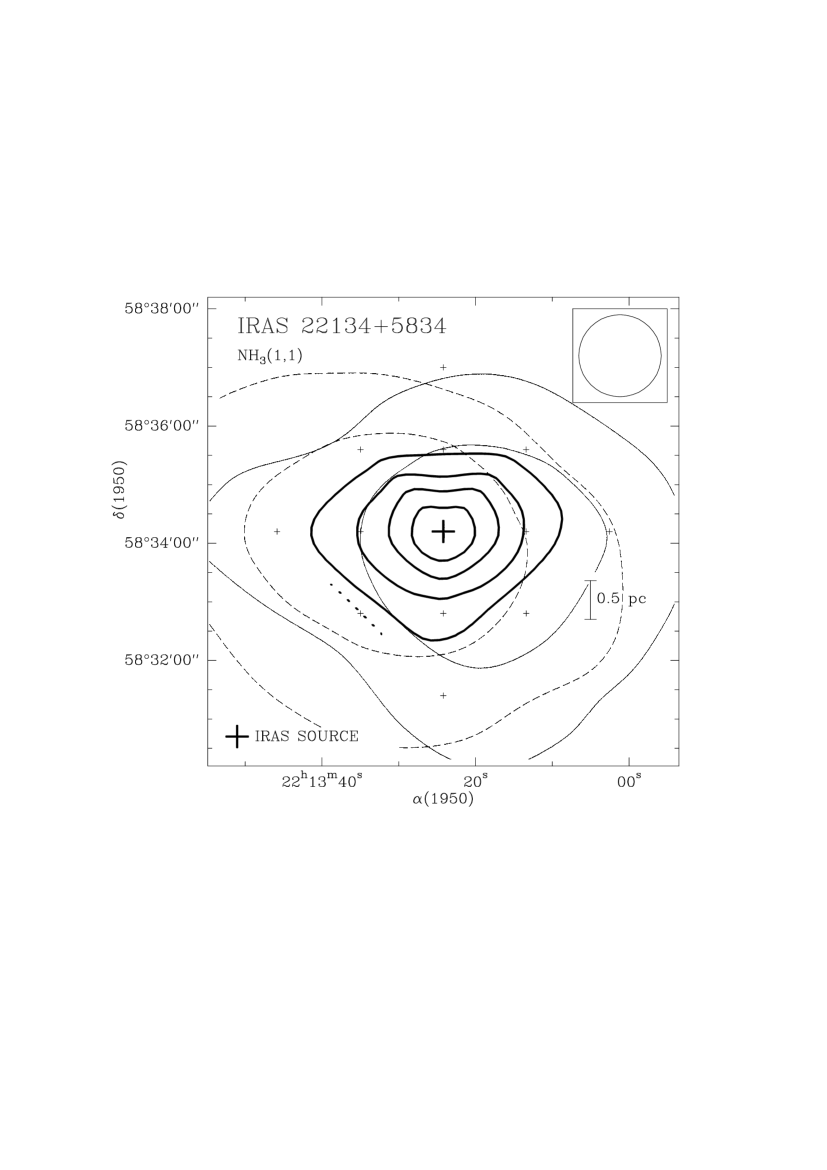
A.25 L1221
L1221 is a small isolated dark cloud associated with IRAS 22266+6845, which has an energy distribution rising to longer wavelengths. Umemoto et al. (1991) discovered a bipolar molecular outflow centered near the position of the IRAS source. The outflow shows a U-shaped structure open to the northwest. However, CO observations with higher angular resolution showed that the outflow may consist of two bipolar outflows, an east-west outflow associated with the IRAS source and a north-south outflow originating about to the east of the IRAS source (Lee et al. 2002).
The region was mapped with different high-density tracer molecules (CS, HCO+, HCN, C18O; Umemoto et al. 1991, Lee & Ho 2005). Alten et al. (1997) discovered an HH object, HH 363, in the vicinity of the IRAS source. Anglada et al. (2005) detected three cm continuum sources in this region, but none seems to be associated with the IRAS source. Two mm continuum sources are detected, one of them (MM1) peaks around the IRAS source and toward one of the three infrared sources detected by the Spitzer Space Telescope (Lee & Ho 2005)
The NH3 emission (Fig. 35) is distributed in a compact condensation centered on the IRAS source, with weak emission extending to the NE. The size of the NH3 condensation (see Table 6) is similar to that obtained in the CS and HCO+ maps (Umemoto et al. 1991), but the emission peaks of the CS, HCO+, and HCN cores are located ( pc) to the south of the NH3 emission peak. A displacement between CS and NH3 emission peaks has been found in several other regions, and has been interpreted by Morata et al. (1997) in terms of chemical evolution.
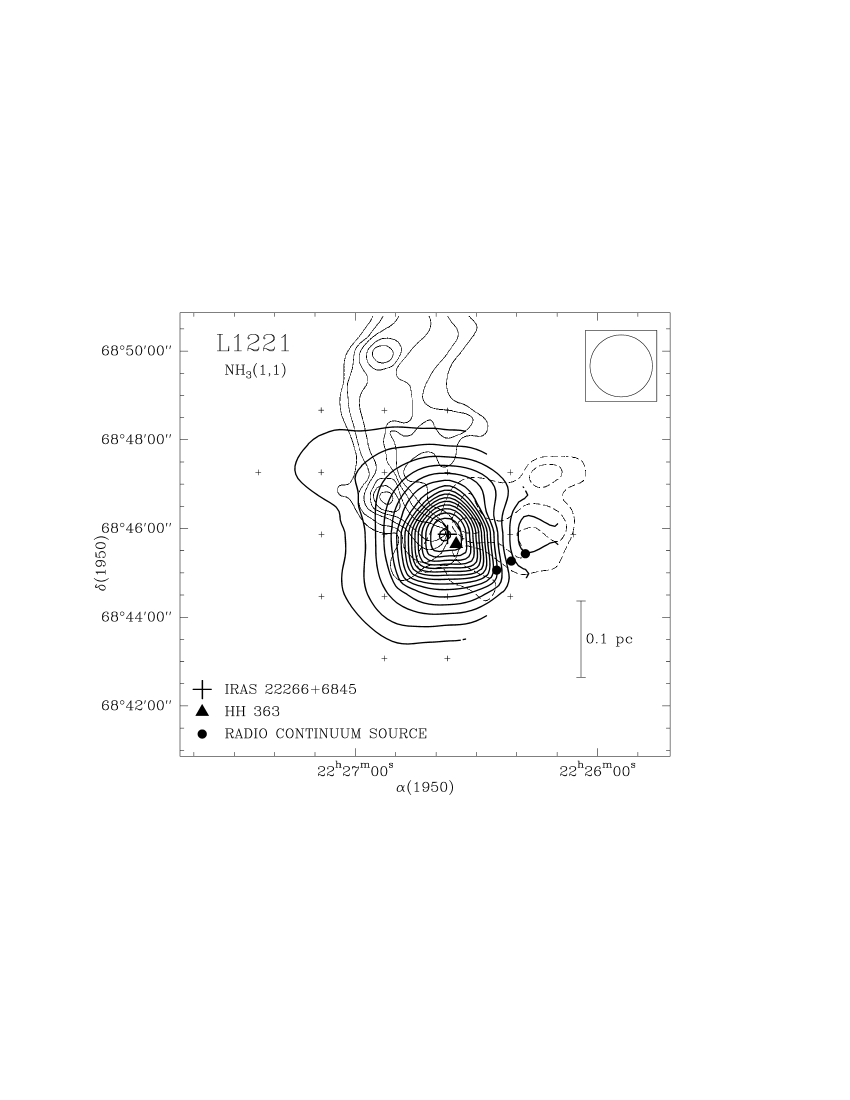
The presence of the IRAS source toward the ammonia peak, which is located at the center of symmetry of the outflow, favors IRAS 22266+6845 as its exciting source. This contrast with the proposal of Umemoto et al. (1991), who postulate the existence of an object located to the south of the position of the CS emission peak as the outflow driving source.
A.26 NGC 7538
The NGC 7538 molecular cloud is an active site of high-mass star formation containing five infrared sources (IRS 1, 2, 3, 9 and 11) within an area of (Werner et al. 1979). Estimates of the distance range from 2.2 to 4.7 kpc. We adopt a distance of 2.7 kpc (Kameya et al. 1986). Campbell & Thompson (1984) found a high-velocity outflow near IRS 1. Kameya et al. (1989) discovered three additional outflows in the region. Two of them are associated with sources IRS 9 and IRS 11, but the third one was not associated with any known source. Davis et al. (1998) detected a collimated H2 jet associated with the IRS 9 outflow, two possible bow shocks related with the IRS 1 and IRS 9 outflows, and a number of H2 compact knots which coincide with the IRS 11 outflow, and that could be related with it. Davis et al. (1989) also detected a cavity to the northwest of IRS 1.
The NH3 map (Fig. 36) shows a condensation elongated in the east-west direction. The ammonia emission peak is located toward the position of IRS 11. A secondary emission peak is located near IRS 9. IRS 1-3 also appear projected toward the ammonia condensation. The association of IRS 11 with the ammonia emission peak suggests that this source is the most embedded object, in agreement with the CS observations (Kameya et al. 1986).
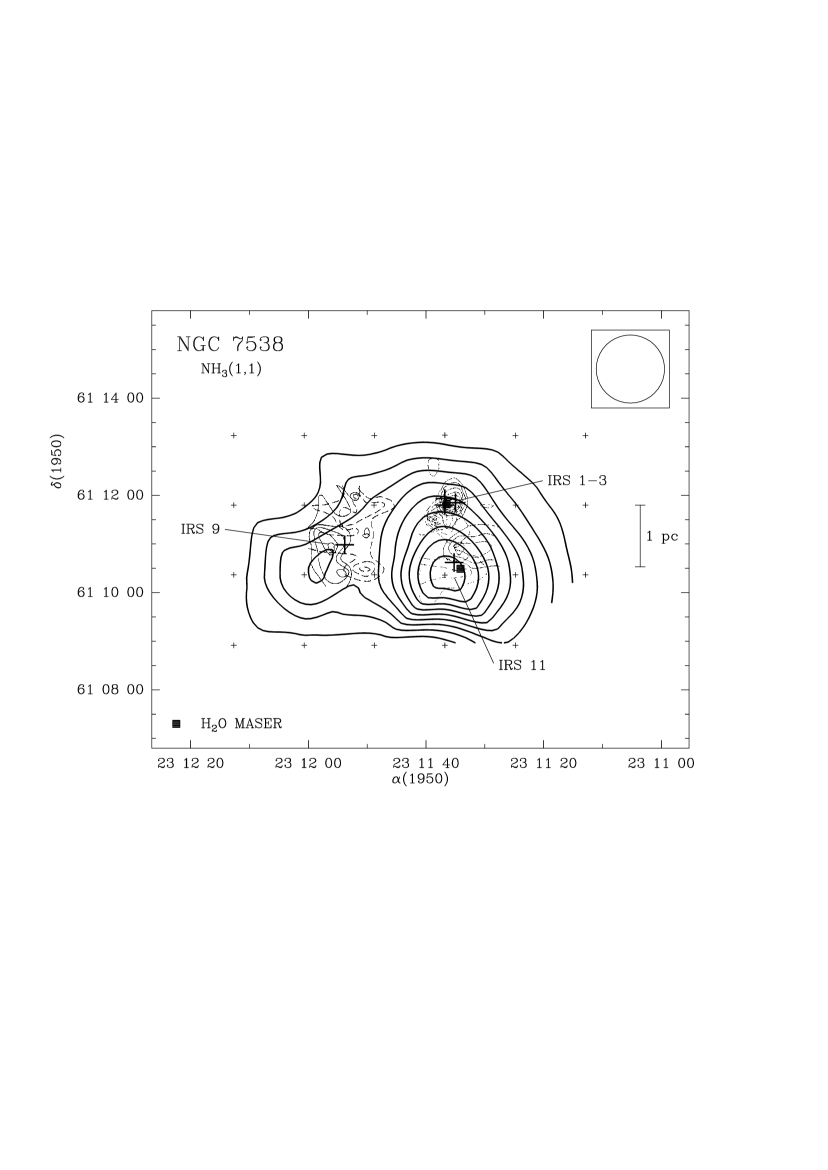
The NH3 line profiles show broad intrinsic line widths, with values ranging from km s-1 to km s-1. The broadest intrinsic line width is found very close to the IRS 11 position. Fig. 37 shows a contour map of the NH3 intrinsic line width. The broadening due to the NH3 hyperfine structure is about 0.5 km s-1 and the thermal broadening for the derived kinetic temperature ( K, see Table 6) is km s-1. Both values are significantly lower than the observed line width, which could indicate turbulent motions of the gas, or that the dense gas is suffering an interaction with the outflows.
