The different nature in Seyfert 2 galaxies with and without hidden broad-line regions
Abstract
We compile a large sample of 120 Seyfert 2 galaxies (Sy2s) which contains 49 hidden broad-line region (HBLR) Sy2s and 71 non-HBLR Sy2s. From the difference in the power sources between two groups, we test if HBLR Sy2s are dominated by active galactic nuclei (AGNs), and if non-HBLR Sy2s are dominated by starbursts. We show that: (1) HBLR Sy2s have larger accretion rates than non-HBLR Sy2s; (2) HBLR Sy2s have larger [Ne v] /[Ne ii] and [O iv] /[Ne ii] line ratios than non-HBLR Sy2s; (3) HBLR Sy2s have smaller flux ratio which shows the relative strength of the host galaxy and nuclear emission than non-HBLR Sy2s. So we suggest that HBLR Sy2s and non-HBLR Sy2s are AGN-dominated and starburst-dominated, respectively. In addition, non-HBLR Sy2s can be classified into the luminous () and less luminous () samples, when considering only their obscuration. We suggest that: (1) the invisibility of polarized broad lines (PBLs) in the luminous non-HBLR Sy2s depends on the obscuration; (2) the invisibility of PBLs in the less luminous non-HBLR Sy2s depends on the very low Eddington ratio rather than the obscuration.
Subject headings:
galaxies: active — galaxies: Seyfert — galaxies: statistics1. INTRODUCTION
According to the unified model of active galactic nuclei (AGNs; Antonucci 1993), type 1 AGNs are seen face-on and have both narrow and broad emission lines; type 2 AGNs are seen edge-on and have only narrow emission lines, which are commonly believed to be intrinsically the same as type 1 AGNs. With the discoveries of both polarized broad lines (PBLs) in NGC 1068 (Antonucci & Miller 1985) and some hidden broad-line regions (HBLRs) in other Seyfert 2 galaxies (Sy2s; Miller & Goodrich 1990; Tran et al. 1992; Young et al. 1996; Heisler et al. 1997; Kay & Moran 1998), Seyfert 2 galaxies are classified into HBLR and non-HBLR Sy2s. About of the total currently known Seyfert 2 galaxies show the presence of HBLRs in their polarized optical spectra, while the remaining half do not (Tran 2001, 2003; Nicastro et al. 2003; Haas et al. 2007).
It seems to have an indication that the activities of the two kinds of objects may be powered by different mechanisms. Based on the results of a spectropolarimetric survey of the CfA and m samples of Sy2s, Tran (2001) proposed the existence of a population of galactic nuclei whose activity is powered by starburst rather than accretion onto a supermassive black hole (SMBH) and in which, therefore, the BLRs simply do not exist (Nicastro et al. 2003). With respect to the radio, far-infrared, and near-infrared emissions of the two groups, Yu & Hwang (2005) found that an HBLR Sy2 is similar to a Sy1, suggesting that this type of object does harbor a central AGN; on the other hand, the non-HBLR Sy2 is more like a starburst galaxy.
Considerable efforts have been devoted in the past decade to understanding the HBLR and non-HBLR Sy2s. The absence of PBLs could be attributed to the edge-on line of sight and hidden of electron scattering region (Heisler et al. 1997; Wang Zhang 2007). Many evidences showed that the presence or absence of HBLRs in Seyfert 2 galaxies depends on the AGN luminosity, with the HBLR sources having, on average, larger luminosities (Lumsden & Alexander 2001; Gu & Huang 2002; Martocchia & Matt 2002; Tran 2001, 2003; Nicastro et al. 2003). Examining the sample extracted from the spectropolarimetric survey of Tran (2001, 2003), Nicastro et al. (2003) found that all HBLR sources have accretion rates larger than the threshold value of (in Eddington units), while non-HBLR sources lie at . Collecting a sample of 90 Sy2s with radio, infrared, optical, and X-ray (2-10 keV) data, Gu & Huang (2002) indicated that the majority of non-HBLR Sy2s have less powerful AGN activity, which is likely caused by a low accretion rate. Based on the observed upper limit of emission line width of 25,000 km s-1, Laor (2003) also proposed a model to describe the existence of BLRs in AGNs.
Seyfert 2 galaxies have large columns of circumnuclear obscuring material that prevents the direct view of the nucleus. X-ray observations are useful for providing an indication of the level of obscuration by the torus. One usually uses the column density of neutral hydrogen () to show the obscuration. In the local universe, about half of Sy2s are found to be Compton-thick sources with cm-2 (Maiolino et al. 1998; Bassani et al. 1999; Risaliti et al. 1999). However, some Sy2s do not show HBLRs in spectropolarimetric observations and have column densities lower than in the X-ray observations (Panessa & Bassini 2002), which indeed challenge the unified model (Bian & Gu 2007).
About the nature of the power sources in HBLR and non-HBLR Sy2s, there are still some controversies. Moreover, the reason that Sy2s with column densities lower than do not show HBLRs is still unclear. In this paper, therefore we firstly devote to distinguish between HBLR and non-HBLR Sy2s in dominant mechanisms (AGNs or starbursts); then we investigate and discuss physical reasons of the absence of PBLs in non-HBLR Sy2s. We assume =75 km Mpc-1, , and throughout the paper.
2. THE SAMPLE and DATA
We collect multi-wavelength data for the large sample of 120 Sy2s which consists of 71 non-HBLR Sy2s and 49 HBLR Sy2s listed in Tables 1 and 2, respectively, including radio, far-infrared, infrared, optical, and X-ray (2-10 keV) bands. The sample selection is mainly from Gu & Huang (2002), Tran (2003), Wang & Zhang (2007), and Shu et al. (2007). According to the Sy2 classification of Tran (2003), we classify the two objects, NGC 5347 and NGC 5929, as the non-HBLR Sy2 sample. Except the 18 objects in Table 5 of Wang & Zhang (2007), all other objects of our sample have their spectropolarimetric observations which are described in Appendix in detail. With regard to the 18 objects, Wang & Zhang (2007) took the two criteria to classify unabsorbed Seyfert 2 galaxies into non-HBLR Sy2s and HBLR Sy2s (see section 2 of Wang & Zhang 2007; 14 non-HBLR Sy2s and 4 HBLR Sy2s).
| Name | [Ne ii] | [Ne v] | [O iv] | EW | Reference | ||||||||||
|---|---|---|---|---|---|---|---|---|---|---|---|---|---|---|---|
| (1) | (2) | (3) | (4) | (5) | (6) | (7) | (8) | (9) | (10) | (11) | (12) | (13) | (14) | (15) | (16) |
| ESO 428-G014 | 0.006 | 7.34 | 1.77 | 4.40 | 6.05 | … | 82.9 | … | 42.23 | 28.542 | 3.80 | 1.04 | 25.00 | 1600 | 3,3,1,3,5,4,3,4 |
| F00198-7926 | 0.073 | … | 1.15 | 3.10 | 2.87 | 6.19 | 12.27 | 33.03 | 42.67 | … | 1.0 | 2.86 | 24.00 | …. | 2,19,4,4,4 |
| F01428-0404 | 0.018 | 7.31 | 0.34 | 0.66 | 1.71 | … | … | … | … | 29.143a | … | … | 21.51 | …. | 7,1,1,7 |
| F03362-1642 | 0.037 | … | 0.50 | 1.06 | 2.01 | … | … | … | 41.62 | 29.370 | … | 0.26 | … | …. | 3,3,5 |
| F04103-2838 | 0.117 | … | 0.54 | 1.82 | 1.71 | … | … | … | … | 30.539 | 0.38 | … | … | …. | 1,5,15 |
| F04210+0401 | 0.045 | 7.34 | 0.25 | 0.60 | 2.54 | … | … | … | 42.42 | 30.295 | … | 1.61 | … | …. | 3,3,3,5 |
| F04229-2528 | 0.044 | … | 0.26 | 0.98 | 1.25 | … | … | … | 41.99 | 29.547 | … | 0.60 | … | …. | 3,3,5 |
| F04259-0440 | 0.016 | … | 1.41 | 4.13 | 3.30 | … | … | … | 41.85 | … | … | 0.43 | … | …. | 1,4 |
| F08277-0242 | 0.041 | … | 0.43 | 1.47 | 1.82 | … | … | … | 41.76 | 30.028 | … | 0.35 | … | …. | 3,3,5 |
| F10340+0609 | 0.012 | … | 0.25 | 0.39 | 1.12 | … | … | … | … | … | 7.8 | … | … | …. | 3,1 |
| F13452-4155 | 0.039 | 6.52 | 0.81 | 1.84 | 1.34 | … | … | … | 42.19 | … | … | 0.95 | … | … | 3,3,3 |
| F19254-7245 | 0.0617 | … | 1.35 | 5.24 | 8.03 | 31.48 | 2.77 | 6.35 | 43.06 | … | 2.3 | 7.03 | 24 | 2000 | 2,18,4,4,4,4 |
| F20210+1121 | 0.056 | … | 1.40 | 3.39 | 2.68 | … | … | … | 43.31 | 30.485 | 3.0 | 12.51 | 25.00 | 1650 | 1,4,5,11,4,4 |
| F23128-5919 | 0.045 | … | 1.59 | 10.8 | 11 | 27.29 | 2.56 | 18.16 | 41.68 | … | 1.3 | 0.29 | 22.681 | …. | 3,18,4,4,4 |
| IC 5298 | 0.027 | … | 1.80 | 9.76 | 11.1 | … | … | … | 42.17 | 29.715 | … | 0.91 | … | …. | 3,3,5 |
| Mrk 334 | 0.022 | 6.52 | 1.05 | 4.35 | 4.32 | 30.0 | 13.0 | 15.0 | 42.34 | 29.434 | 130 | 1.34 | 20.643 | …. | 9,1,17,4,5,4,4 |
| Mrk 573 | 0.017 | 6.04 | 0.85 | 1.24 | 1.43 | … | … | … | 42.39 | 29.133 | 1.2 | 1.50 | 24.00 | 2800 | 3,1,3,5,4,3,4 |
| Mrk 938 | 0.02 | 7.0 | 2.51 | 16.84 | 17.61 | 64.0 | … | … | 42.69 | 29.705 | 2.3 | 3.00 | 24.00 | 321 | 3,3,19,3,5,4,4,4 |
| Mrk 1066 | 0.012 | 7.5 | 2.26 | 11.0 | 12.2 | … | 17.8 | … | 42.27 | 29.467 | 2.3 | 1.14 | 24.0 | 1120 | 3,3,1,3,5,4,3,4 |
| Mrk 1361 | 0.023 | … | 0.84 | 3.28 | 3.73 | … | … | … | 42.33 | 29.297 | … | 1.31 | … | …. | 3,3,5 |
| NGC676 | 0.005 | 8.27 | 0.062 | 0.27 | 0.80 | … | … | … | 39.21 | … | 0.112 | 0.001 | 21.00 | …. | 7,1,7,16,7 |
| NGC1058 | 0.002 | 6.03 | 0.17 | 2.65 | 8.74 | … | … | … | 38.06 | 26.928a | 0.024 | 0.0001 | 21.78 | … | 7,8,7,1,16,7 |
| NGC1143 | 0.029 | … | 0.10 | 1.10 | 1.5 | 15.0 | … | … | 41.97 | … | … | 0.57 | … | …. | 13,1,4 |
| NGC1144 | 0.029 | 5.84 | 0.62 | 5.35 | 11.6 | … | … | … | 41.81 | 30.391 | 120 | 0.40 | 22.00 | …. | 3,3,3,5,4,3 |
| NGC1241 | 0.014 | 7.34 | 0.60 | 4.37 | 10.74 | 9.0 | … | 2.0 | 41.74 | … | … | 0.34 | … | …. | 3,3,17,3, |
| NGC1320 | 0.009 | 6.36 | 1.32 | 2.21 | 2.82 | 9.0 | 8.0 | 32.0 | 41.08 | 27.974 | 82.0 | 0.07 | … | …. | 3,3,17,3,5,4 |
| NGC1358 | 0.013 | 6.29 | 0.12 | 0.38 | 0.93 | … | … | … | 41.36 | 28.820 | 8.6 | 0.14 | 23.60 | …. | 3,3,3,5,4,4 |
| NGC1386 | 0.003 | 6.92 | 1.46 | 6.01 | 9.67 | 28.0 | 45.4 | … | 41.09 | 27.637 | 2.0 | 0.08 | 25.00 | 7600 | 3,3,1,3,5,11,3,2 |
| NGC1667 | 0.015 | 6.68 | 0.67 | 6.29 | 15.83 | 26.0 | … | 12.0 | 42.03 | 29.506 | 0.26 | 0.66 | 24.00 | 3000 | 3,3,17,3,5,11,4,2 |
| NGC1685 | 0.015 | … | 0.22 | 0.98 | 1.53 | … | … | … | 42.67 | 28.753 | 20.0 | 2.86 | … | …. | 3,3,5,4 |
| NGC2685 | 0.003 | 6.97 | 0.11 | 0.37 | 1.66 | … | … | … | 38.92 | 26.743a | 2.70 | 0.0005 | 21.48 | …. | 7,8,7,1,1,7 |
| NGC3031 | 0.001 | 7.83 | 5.42 | 44.73 | 174.02 | … | 0.6 | … | 38.81 | 27.504a | 150 | 0.0004 | 21.00 | 170d | 7,8,1,7,1,11,7,11 |
| NGC3079 | 0.004 | … | 3.65 | 50.95 | 105.2 | 148.0 | 0.7 | 36.0 | 40.48 | 29.359 | 5.3 | 0.02 | 25.00 | 1480 | 3,,3,5,11,4,4 |
| NGC3147 | 0.009 | 8.64 | 1.08 | 8.40 | 29.96 | … | … | … | 40.19 | 29.350a | 13.0 | 0.01 | 20.46 | 485 | 7,8,7,1,11,7,11 |
| NGC3281 | 0.012 | 6.41 | 2.63 | 6.73 | 7.89 | … | … | … | 41.30 | 29.248 | 40.0 | 0.12 | 24.20 | 1180 | 3,14,3,5,11,4,4 |
| NGC3362 | 0.028 | 7.20 | 0.35 | 2.13 | 3.16 | … | … | … | 41.37 | 29.376 | 126.0 | 0.14 | … | …. | 3,3,3,5,4 |
| NGC3393 | 0.013 | … | 0.75 | 2.25 | 3.87 | … | 42.4 | … | 42.10 | 29.643a | 4.0 | 0.77 | 23.9 | 3500 | 3,1,3,1,11,3,11 |
| NGC3486 | 0.002 | 6.17 | 0.32 | 6.24 | 15.87 | … | … | … | 38.25 | 27.827a | 0.85 | 0.0001 | 21.48 | …. | 7,8,7,1,16,7 |
| NGC3660 | 0.012 | 7.33 | 0.64 | 2.03 | 4.47 | 6.51 | 0.98 | 3.61 | 40.76 | 28.513 | 22.0 | 0.035 | 20.26 | …. | 7,2,18,4,5,4,4 |
| NGC3941 | 0.003 | 7.39 | … | … | … | … | … | … | 38.80 | … | 0.419 | 0.0004 | 21.00 | …. | 7,7,16,7 |
| NGC3982 | 0.004 | 6.15 | 0.97 | 7.21 | 16.78 | 16.0 | … | 2.0 | 40.33 | 28.226 | 5.7 | 0.01 | 24.2 | 6310 | 3,3,17,3,5,4,3,4 |
| NGC4117 | 0.003 | 6.03 | … | … | … | … | … | … | … | 27.020 | 232.0 | … | … | …. | 3,5,4 |
| NGC4472 | 0.003 | 8.67 | 0.21 | 0.19 | 0.48 | … | … | … | 37.62 | 28.850a | 2.15 | 0.00003 | 21.48 | …. | 7,8,7,1,16,7 |
| NGC4501 | 0.008 | 7.86 | 3.02 | 19.93 | 63.64 | 7.02 | 1.5 | 4.22 | 39.89 | 29.468 | 1.1 | 0.005 | 21.30 | …. | 9,2,19,4,5,4,4 |
| NGC4565 | 0.004 | 7.56 | 1.7 | 9.83 | 47.23 | … | … | … | 39.36 | 28.818a | 2.07 | 0.0014 | 20.11 | …. | 7,8,7,1,16,7 |
| NGC4579 | 0.005 | 7.74 | 0.72 | 6.70 | 18.92 | 11.0 | 0.6 | … | 39.58 | 28.871a | 44.0 | 0.0023 | 20.39 | 240 | 7,8,19c,7,1,11,7,11 |
| NGC4594 | 0.004 | 8.52 | 0.50 | 4.26 | 22.86 | … | 0.3 | … | 39.26 | … | 19.0 | 0.001 | 21.23 | …. | 7,8,1,7,11,7 |
| NGC4698 | 0.003 | 7.43 | 0.154 | 0.258 | 1.864 | … | … | … | 38.64 | … | 0.48 | 0.0003 | 20.91 | 425 | 7,1,7,16,7,12 |
| NGC4941 | 0.004 | 6.34 | 0.46 | 1.87 | 4.79 | … | 9.0 | 19.0 | 41.18 | 27.629 | 7.0 | 0.09 | 23.65 | 1600 | 3,3,17,3,5,11,3,11 |
| NGC5033 | 0.003 | 7.48 | 1.15 | 13.8 | 43.9 | 13.3 | 0.4 | 5.1 | 39.47 | 28.992a | 55.0 | 0.002 | 20.01 | 290 | 7,10,20,7,1,11,7,11 |
| NGC5128 | 0.002 | 8.30 | 28.2 | 213.0 | 412.0 | 203.0 | 22.0 | 124.0 | 38.82 | … | 850.0 | 0.0004 | 23.0 | 114 | 21,3,19,3,11,3,11 |
| NGC5135 | 0.014 | 5.79 | 2.39 | 16.6 | 31.18 | … | 25.2 | … | 42.21 | 29.824 | 2.0 | 0.99 | 24.0 | 11700 | 3,3,1,3,5,11,3,2 |
| NGC5194 | 0.00154 | … | 17.47 | 108.7 | 292.08 | 17.0 | 0.74 | 7.9 | 40.03 | 28.441 | 11.0 | 0.007 | 24.748 | 986 | 8,19,4,5,11,4,4 |
| NGC5256 | 0.028 | 6.92 | 1.07 | 7.25 | 10.11 | 76.0 | 2.1 | 61.0 | 41.89 | 30.283 | 5.6 | 0.48 | 25.0 | 575 | 9,14,,4,5,4,4,4 |
| NGC5283 | 0.01 | 7.14 | 0.089 | 0.132 | 0.751 | … | … | … | 40.88 | 28.355 | 14.6 | 0.05 | 23.18 | 220 | 3,1,3,5,4,3,4 |
| NGC5347 | 0.008 | 7.3 | 0.96 | 1.42 | 2.64 | 3.0 | … | 4.0 | 41.22 | 27.852 | 2.2 | 0.10 | 24.00 | 1300 | 3,3,17,3,5,4,4,4 |
| NGC5643 | 0.004 | 6.45 | 3.65 | 19.5 | 38.2 | 46.4 | 24.6 | 118.3 | 41.37 | 28.944 | 13.0 | 0.14 | 23.85 | 500 | 3,3,20,3,1,11,3,4 |
| NGC5695 | 0.014 | 7.15 | 0.13 | 0.57 | 1.79 | … | … | … | 40.55 | 28.397 | 1.0 | 0.02 | … | …. | 3,3,3,5,4 |
| NGC5728 | 0.009 | 6.95 | 0.88 | 8.16 | 14.7 | … | … | … | 41.09 | 29.047 | 13.3 | 0.08 | 23.89 | 1100 | 3,3,3,5,4,4,4 |
| NGC5929 | 0.008 | 7.25 | 1.67 | 9.52 | 13.84 | 21.0 | 4.0 | 7.0 | 41.40 | 29.220 | 1.35 | 0.15 | 22.63 | …. | 9,2,17,4,5,4,4 |
| NGC6251 | 0.023 | 8.8 | 0.07 | 0.19 | 0.60 | … | … | … | 41.77 | 31.582a | 13.0 | 0.36 | 21.88 | 392d | 7,1,7,1,11,7,11 |
| NGC6300 | 0.004 | 6.29 | 2.27 | 14.7 | 36.0 | 11.5 | 12.5 | 29.5 | 41.08 | … | 216.0 | 0.07 | 23.34 | 148 | 3,3,20,3,4,3,4 |
| NGC6890 | 0.008 | 6.48 | 0.65 | 3.85 | 8.16 | 11.32 | 5.77 | 10.1 | 41.04 | … | 0.80 | 0.07 | … | …. | 3,3,19,3,1 |
| NGC7130 | 0.016 | … | 2.16 | 16.71 | 25.89 | 71.0 | 11.0 | 43.0 | 42.55 | 29.977 | 1.60 | 2.17 | 24.00 | 1800 | 14,17,4,5,4,4,4 |
| NGC7172 | 0.009 | 7.67 | 0.95 | 5.74 | 12.43 | … | … | 50.0 | 40.84 | 28.731 | 130.0 | 0.04 | 22.94 | 121 | 9,3,17,3,5,11,3,2 |
| NGC7496 | 0.005 | … | 1.93 | 10.14 | 16.57 | 48.08 | 1.8 | 2.4 | 40.22 | 28.429 | 80.0 | 0.01 | 22.699 | …. | 14,19,4,1,4,4 |
| NGC7582 | 0.005 | 5.99 | 7.48 | 52.47 | 83.27 | 148.0 | … | … | 41.63 | 29.317 | 155.0 | 0.26 | 23.95 | 521 | 3,3,1,3,1,11,4,4 |
| NGC7590 | 0.005 | 6.83 | 0.89 | 7.69 | 20.79 | 7.8 | 1.5 | 5.6 | 40.02 | 28.645 | 12.0 | 0.006 | 21.0 | …. | 7,14,19,4,1,11,4 |
| NGC7672 | 0.013 | 6.82 | 0.15 | 0.46 | 2.46 | … | … | … | … | 28.382 | 286.0 | … | 25.00 | …. | 3,3,5,4,7 |
| NGC7679 | 0.017 | 8.56 | 1.12 | 7.40 | 10.71 | … | … | … | 41.78 | 29.708a | 45.8 | 0.37 | 20.34 | 200 | 7,14,7,1,1,7,12 |
| UGC6100 | 0.03 | 8.26 | 0.202 | 0.574 | 1.50 | … | … | … | 42.30 | 29.265 | 114.0 | 1.22 | … | …. | 3,1,3,5,4 |
| Name | [Ne ii] | [Ne v] | [O iv] | EW | Reference | ||||||||||
|---|---|---|---|---|---|---|---|---|---|---|---|---|---|---|---|
| (1) | (2) | (3) | (4) | (5) | (6) | (7) | (8) | (9) | (10) | (11) | (12) | (13) | (14) | (15) | (16) |
| Circinus | 0.001 | … | 68.44 | 248.7 | 315.85 | 900.0 | 239.0 | … | 40.92 | … | 100.0 | 0.05 | 24.633 | 2250 | 1,1,4,11,4,4 |
| ESO273-IG04 | 0.039 | … | 1.72 | 4.76 | 4.92 | … | … | … | 42.48 | … | … | 1.85 | … | …. | 1,4 |
| F00317-2142 | 0.027 | 8.08 | 0.56 | 3.85 | 8.42 | … | … | … | 41.13 | 30.005a | … | 0.08 | 20.28 | 900 | 7,1,7,1,7,12 |
| F00521-7054 | 0.069 | … | 0.80 | 1.02 | 1.44 | 5.8 | 5.78 | 8.63 | 42.62 | … | 318.0 | 2.55 | … | …. | 1,19,4,4 |
| F01475-0740 | 0.018 | 7.55 | 0.84 | 1.10 | 1.05 | 16.0 | … | 7.0 | 41.76 | 30.278 | 7.50 | 0.35 | 21.59 | 130 | 9,2,17,4,5,4,4,4 |
| F02581-1136 | 0.03 | … | 0.46 | 0.54 | 0.85 | … | … | … | 41.16 | 29.175 | … | 0.09 | … | …. | 2,4,5 |
| F04385-0828 | 0.015 | 8.77 | 1.70 | 2.91 | 3.55 | 24.0 | … | 12.0 | 40.64 | 28.882 | 24.0 | 0.027 | … | …. | 9,2,17,4,5,4 |
| F05189-2524 | 0.043 | 7.86 | 3.41 | 13.27 | 11.90 | 21.12 | 17.53 | 23.71 | 42.74 | 29.999 | 43.0 | 3.37 | 22.756 | 30 | 7,2,18,4,5,11,4,4 |
| F11057-1131 | 0.055 | … | 0.32 | 0.77 | 0.79 | … | … | … | 42.45 | 29.592 | 3.90 | 1.73 | 24.00 | 900 | 1,4,5,4,4,4 |
| F15480-0344 | 0.03 | 8.22 | 0.72 | 1.09 | 4.05 | 7.0 | 10.0 | 34.0 | 43.02 | 29.863 | 3.70 | 6.41 | 24.20 | 2400 | 9,2,17,4,5,4,4,4 |
| F17345+1124 | 0.162 | … | 0.20 | 0.48 | 3.31 | … | … | … | 42.956 | 31.782 | … | 5.53 | … | …. | 1,5,5 |
| F18325-5926 | 0.02 | … | 1.39 | 3.23 | 3.91 | … | … | … | 42.19 | … | 84.0 | 0.95 | 22.31 | 242 | 1,4,11,4,4 |
| F20050-1117 | 0.031 | 7.11 | 0.17 | 1.11 | 2.00 | … | … | … | 41.47 | … | … | 0.18 | 21.60 | 272 | 7,1,7,7,12 |
| F20460+1925 | 0.181 | … | 0.53 | 0.88 | 1.45 | … | … | … | 43.02 | 31.064 | 15.0 | 6.41 | 22.398 | 260 | 1,4,5,11,4,4 |
| F22017+0319 | 0.061 | … | 0.59 | 1.31 | 1.65 | 5.95 | 8.33 | 29.04 | 42.58 | 30.060 | 36.0 | 2.33 | 22.69 | 380 | 2,19,4,5,4,4,4 |
| F23060+0505 | 0.173 | … | 0.43 | 1.15 | 0.83 | … | … | … | 43.916 | 30.584 | 15.0 | 50.48 | 22.924 | 170 | 1,5,5,11,5,11 |
| IC 1631 | 0.031 | 7.78 | 0.13 | 1.05 | 2.43 | … | … | … | 41.98 | 29.591a | 100.0 | 0.58 | 21.5 | 70 | 7,1,7,1,11,7,11 |
| IC 3639 | 0.011 | 6.83 | 2.54 | 8.90 | 13.79 | … | … | … | 41.89 | 29.265 | 0.80 | 0.48 | 24.2 | 1500 | 9,14,4,5,4,4,4 |
| IC 5063 | 0.011 | 7.20 | 3.95 | 5.79 | 3.66 | 21.0 | … | … | 41.56 | … | 120.0 | 0.22 | 23.342 | 80 | 7,2,1,4,11,4,2 |
| MCG-3-34-64 | 0.017 | 7.69 | 2.88 | 6.22 | 6.37 | … | … | … | 42.39 | 30.158 | 40.0 | 1.50 | 23.61 | 200 | 9,2,4,5,4,4,2 |
| MCG-3-58-7 | 0.032 | … | 0.98 | 2.60 | 3.62 | 5.0 | … | 12.0 | 41.93 | 29.374 | … | 0.52 | … | …. | 2,17,4,5 |
| MCG-5-23-16 | 0.008 | 6.29 | … | … | … | … | … | … | 41.81 | … | 730.0 | 0.40 | 22.25 | 35.2 | 7,4,11,4,4 |
| Mrk 3 | 0.014 | 8.50 | 2.90 | 3.77 | 3.36 | 86.0 | 109.0 | 210.0 | 43.27 | 30.600 | 65.0 | 11.40 | 24.134 | 610 | 7,1,17,4,5,11,4,4 |
| Mrk 78 | 0.037 | 7.99 | 0.56 | 1.11 | 1.13 | … | … | … | 41.98 | … | … | 0.58 | … | …. | 7,1,7 |
| Mrk 348 | 0.015 | 7.18 | 1.02 | 1.43 | 1.43 | 13.0 | … | 24.0 | 41.96 | 30.132 | 127.0 | 0.56 | 23.204 | 230 | 7,2,17,4,5,11,4,2 |
| Mrk 463E | 0.051 | 7.88 | 1.49 | 2.21 | 1.87 | … | 18.3 | … | 42.89 | 31.272 | 4.0 | 4.75 | 23.20 | 340 | 9,2,1,4,5,11,2,4 |
| Mrk 477 | 0.038 | 7.20 | 0.51 | 1.31 | 1.85 | … | … | … | 43.62 | 30.230 | 12.0 | 25.53 | 24.0 | 490 | 9,10,4,5,11,4,4 |
| Mrk 1210 | 0.014 | … | 2.08 | 1.89 | 1.30 | … | … | … | 42.37 | 29.571 | 13.0 | 1.44 | 23.263 | 108 | 1,4,5,11,4,4 |
| NGC 424 | 0.012 | 7.78 | 1.76 | 2.00 | 1.74 | 8.7 | 16.1 | 25.8 | 41.56 | 28.752 | 16.0 | 0.22 | 24.00 | 790 | 7,2,19,4,5,4,2,4 |
| NGC 513 | 0.02 | 6.29 | 0.48 | 0.41 | 1.32 | 12.76 | 1.91 | 6.54 | 41.14 | 29.621 | … | 0.08 | … | …. | 7,2,19,4,5 |
| NGC 591 | 0.015 | 6.84 | 0.448 | 1.99 | 3.48 | … | … | … | 41.97 | 29.187 | 2.0 | 0.57 | 24.2 | 2200 | 7,1,4,5,4,4,4 |
| NGC 788 | 0.014 | 7.51 | 0.51 | 0.51 | 0.59 | … | … | … | 40.79 | … | 46.20 | 0.038 | 23.324 | …. | 6,1,4,4,4 |
| NGC 1068 | 0.004 | 7.64 | 92.7 | 198.0 | 259.8 | 520.0 | 1110.0 | 2200.0 | 42.33 | 30.130 | 35.0 | 1.31 | 25.00 | 1210 | 9,2,1,4,5,11,2,2 |
| NGC 2110 | 0.008 | 7.96 | 0.84 | 4.13 | 5.68 | … | … | … | 41.35 | 29.770a | 260.0 | 0.14 | 22.17 | 124 | 7,1,7,1,11,7,11 |
| NGC 2273 | 0.006 | 7.30 | 1.36 | 6.41 | 9.55 | … | 16.08 | … | 41.13 | 28.803 | 9.0 | 0.08 | 24.13 | 2200 | 6,14,1,4,5,11,4,4 |
| NGC 2992 | 0.008 | 7.72 | 1.57 | 7.34 | 11.6 | … | … | … | 41.30 | … | 45.0 | 0.12 | 21.84 | 514 | 9,13,4,11,4,4 |
| NGC 3081 | 0.008 | 6.29 | … | … | … | … | … | … | 41.43 | 27.731 | 13.0 | 0.16 | 23.819 | 610 | 7,4,5,11,4,4 |
| NGC 3185 | 0.004 | 6.06 | 0.14 | 1.43 | 3.67 | … | … | … | 39.85 | 27.416a | … | 0.004 | 21.30 | …. | 7,8,7,1,7 |
| NGC 4388 | 0.008 | 7.22 | 3.72 | 10.46 | 18.1 | 54.0 | 56.0 | … | 41.85 | 29.188 | 120.0 | 0.43 | 23.43 | 440 | 9,2,1,4,5,11,4,4 |
| NGC 4507 | 0.012 | 6.42 | 1.39 | 4.31 | 5.40 | … | 18.4 | … | 42.19 | 29.190 | 210.0 | 0.95 | 23.643 | 117 | 7,1,1,4,5,11,4,4 |
| NGC 5252 | 0.023 | 8.04 | … | … | … | … | … | … | 42.05 | 29.212 | 89.0 | 0.69 | 22.461 | 44 | 9,4,5,11,4,4 |
| NGC 5506 | 0.006 | 7.46 | 4.24 | 8.44 | 9.24 | 59.0 | 82.0 | … | 41.45 | 29.360 | 838.0 | 0.17 | 22.46 | 150 | 7,2,1,4,5,11,4,2 |
| NGC 5995 | 0.024 | 7.11 | 1.45 | 4.09 | 7.06 | … | … | … | 42.98 | 29.561 | 220.0 | 5.85 | 21.934 | 240 | 7,2,4,5,4,4,2 |
| NGC 6552 | 0.027 | … | 1.17 | 2.57 | 2.79 | … | … | … | 42.41 | 29.640 | 6.00 | 1.57 | 23.80 | 900 | 2,4,5,11,2,2 |
| NGC 7212 | 0.027 | 7.48 | 0.77 | 2.89 | 4.90 | … | … | … | 42.73 | 30.188 | 6.90 | 3.29 | 24.2 | 900 | 7,1,4,5,4,4,4 |
| NGC 7314 | 0.005 | … | 0.58 | 3.74 | 1.42 | … | 23.0 | 53.0 | 42.41 | … | 356.0 | 1.57 | 22.02 | 147 | 1,19,4,11,4,4 |
| NGC 7674 | 0.029 | 7.56 | 1.79 | 5.64 | 8.46 | 18.0 | 31.0 | 46.0 | 42.57 | 30.572 | 5.00 | 2.28 | 24.00 | 370 | 9,2,17,4,5,11,4,4 |
| NGC 7682 | 0.017 | 7.28 | 0.22 | 0.47 | 0.41 | … | … | … | 41.76 | 29.545 | 130.0 | 0.35 | … | …. | 9,2,4,5,4 |
| Was 49b | 0.063 | … | … | … | … | … | … | … | 42.51 | 30.755 | 6.30 | 1.98 | 22.799 | 620 | 4,5,4,4,4 |
Notes: Col. (1): Source name; Col. (2): Redshift; Col. (3): Log of SMBHs masses in units of ; Col. (4), (5), and (6): Infrared flux (in Janskys) for 25, 60, and 100 ; Col. (7), (8), and (9): Flux (W ) for [Ne ii] ,[Ne v] , and [O iv] ; Col. (10): Log of extinction-corrected [O iii] 5007 luminosity in units of ergs ; Col. (11): Log of luminosity of radio for 1.49 GHz in ergs ; Col. (12): Fluxes of observed X-ray (2-10 keV) in units of for Sy2s; Col. (13): Accretion rates ( ); Col. (14): Log of gaseous absorbing column density () in units of ; Col. (15): EW is the Fe k equivalent width in eV. Col. (16): References (for cols. [3], [4]-[6], [7]-[9], [10], [11], [12], [14], and [15], respectively).
a are the luminosities at 1.4 GHz.
b19 are references for 19, 1, and 19, respectively.
c19 is reference for 19 and 1, respectively.
dEW are the equivalent width of Fe K line at 6.7 keV.
References: (1) NED; (2) Tran 2003; (3) Zhang & Wang 2006; (4) Shu et al. 2007; (5) Gu & Huang 2002; (6) Bian & Gu 2007; (7) Wang & Zhang 2007; (8) Ho et al. 1997; (9) Wang et al. 2007; (10) Imanishi, M 2002; (11) Bassani et al. 1999; (12) Panessa & Bassani 2002; (13) Surace et al. 2004; (14) Sanders et al. 2003; (15) Teng et al. 2005; (16) Akylas & Georgantopolos 2009; (17) Deo et al. 2007; (18) Farrah et al. 2007; (19) Tommasin et al. 2008; (20) Goulding & Alexander 2009; (21) Marconi et al. 2001.
To present the properties and the dominant mechanisms between the two groups, we calculate some parameters, for example, far-infrared, infrared, 1.49 GHz, [O iii] luminosities, and high excitation lines ratios ([Ne v] /[Ne ii] and [O iv] /[Ne ii] ) and introduce some of them as follows.
In order to get more luminosities of different bands, we need to calculate the luminosity distances of some objects. The luminosity distance can be shown as
(Darling & Giovanelli 2002; Ballantyne et al. 2006).
We calculate the luminosities of far-infrared and infrared bands of most of sources in our sample by the fluxes from either the published papers or the NASA/IPAC Extragalactic Database (NED). The fluxes and luminosities of far-infrared and infrared can be shown to be: , , , and , where the constant C is the correction factor required to account principally for the extrapolated flux longer than the Infrared Astronomical Satellite () 100 filter (Sanders & Mirable 1996), and here C=1.6; the fluxes for 25, 60, and 100 m are listed in Tables 1 and 2, while the 12 m fluxes (not appearing in Tables 1 and 2 for simplicity) are also selected from the same literatures or NED as the 25, 60, 100 m fluxes.
Besides the luminosities of radio band (1.49 GHz) of some sources from literatures, we also obtain the luminosities of other sources using , where and are the luminosity and flux of the radio band (1.49 GHz) from NED. The 2-10 keV fluxes come directly from some published literatures.
The [O iii] luminosity could be taken as an indicator of the nuclear activity only after correction for extinction (Maiolino et al. 1998; Bassani et al. 1999; Gu & Huang 2002). The luminosity of the extinction-corrected [O iii] emission is given as , where is the extinction-corrected flux of [O iii] emission derived from the relation (Bassani et al. 1999)
where an intrinsic Balmer decrement is adopted.
In addition to above mentioned quantities, we need a good diagnostic that is sensible for the observational differences between the two types of objects. We have chosen the lines of [Ne v] and [O iv] because they are not affected by photoionization of stars and because they are generally among the brightest highly-ionized lines (Sturm et al. 2002). For examining starburst and AGN activities, the [Ne v] and [O iv] lines are the most useful single line diagnostics. Both lines are strong in spectra of AGNs (Farrah et al. 2007), while they are weak in spectra of star-forming regions (Lutz et al. 1998). We consider diagnostics based on the fine-structure line ratios. In Tables 1 and 2, we list various parameters both types of objects.
| Parameters | non-HBLR Sy2s | HBLR Sy2s | |||
| Mean | N | (%) | Mean | N | |
| (1) | (2) | (3) | (4) | (5) | (6) |
| log( | 22.96 0.25 | 52 | 53.66 | 23.180.19 | 40 |
| EW(Fe)a | 1325 | 32 | 1.83 | 54499 | 38 |
| 24.34 17.49 | 56 | 28.15 | 6.021.55 | 40 | |
| log | 7.10 0.11 | 52 | 3.59 | 7.410.11 | 34 |
| log z | -1.980.05 | 71 | 2.23 | -1.710.06 | 49 |
| log | 29.010.13 | 56 | 0.068 | 29.740.14 | 38 |
| 6.211.60 | 64 | 47.70 | 9.223.05 | 44 | |
| 1.530.41 | 57 | 17.19 | 3.011.07 | 43 | |
| 5.810.45 | 60 | 2.990.30 | 45 | ||
| 0.760.22 | 66 | 0.01 | 3.111.14 | 49 | |
| 0.400.12 | 21 | 0.17 | 1.210.17 | 12 | |
| 1.030.27 | 23 | 0.72 | 2.330.44 | 13 | |
| log | 41.050.17 | 66 | 0.01 | 42.050.11 | 49 |
| log( | -0.980.25 | 49 | 5.75 | -0.120.15 | 34 |
Note: Col.(1): Parameters; Cols.(2)-(3) and (5)-(6): For each sample of non-HBLR Sy2 and HBLR Sy2 galaxies, “Mean” is the mean value of the various parameters and N is the number of data points. Col. (4): the probability (in percent) for the null hypothesis that the two distributions are drawn at random from the same parent population. When there are censored data, we use Gehan’s generalized Wilcoxon test (hypergeometric variance) in ASURV.
a EW(Fe) is the Fe K equivalent width in eV.
b We have removed 3 sources (NGC 1241, NGC 3362, and NGC 7682) because they have no detections in their 12 band.
c Detections only.
d An ASURV test does not give the value of .
e Here the Eddington ratios, are given by and , respectively.
3. RESULTS AND DISCUSSION
In sections 3.1 and 3.2, we will show the properties that differ between the two groups and test if HBLR Sy2s are dominated by AGNs, and if non-HBLR Sy2s are dominated by starbursts. In section 3.3, we employ the separation of Shu et al. (2007) who noted that non-HBLR Sy2s are divided into the luminous () and less luminous () classes. We will investigate their differences in the obscuration between the two groups. We also discuss their properties and compare their obscuration with that of HBLR Sy2s.
3.1. Distributions of Main properties for Non-HBLR and HBLR Sy2s
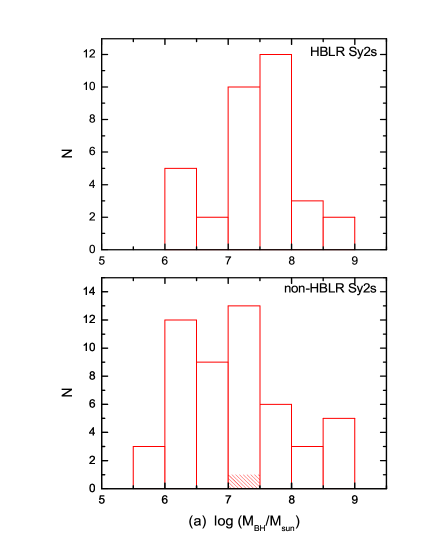
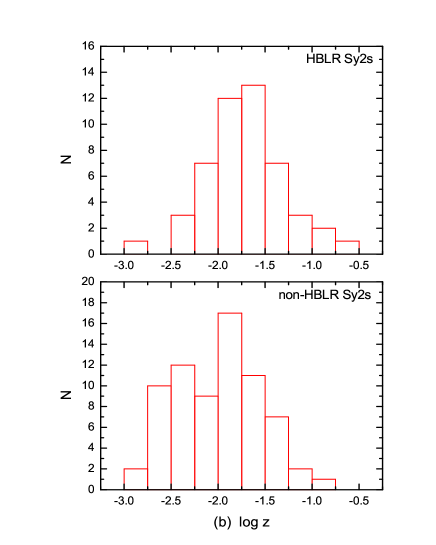
In this section, we report the distributions of several parameters for HBLR and non-HBLR Sy2s, for example, the SMBH mass, redshift, , ratio, K iron-line equivalent width (EW), and mid-infrared line ratios, both and .
In Figure 1.a, we show the distribution of SMBH masses for HBLR and non-HBLR Sy2s. Since there are censored data points (upper limits; densely shaded areas) among non-HBLR Sy2s, we use the astronomical survival analysis package (ASURV; Feigelson Nelson 1985) for statistical analysis. The distributions of the SMBH masses are different between HBLR and non-HBLR Sy2s. For the whole sample, the mean SMBH mass of HBLR Sy2s is larger than that of non-HBLR Sy2s by the amount of 0.31, with a confidence level of (see Table 3).
Figure 1.b shows the distribution of redshifts for HBLR and non-HBLR Sy2s. The distributions of redshifts are different between HBLR and non-HBLR Sy2s. The mean value of log z of HBLR Sy2s is larger than that of non-HBLR Sy2s by the amount of . A Kolmogorov-Smirnov (K-S) test shows that the probability for the two samples to be extracted from the same parent population is .
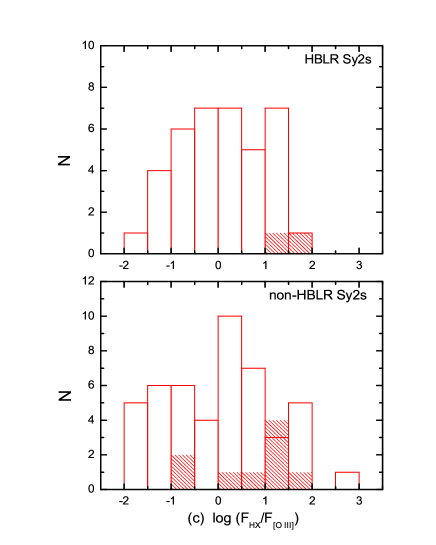
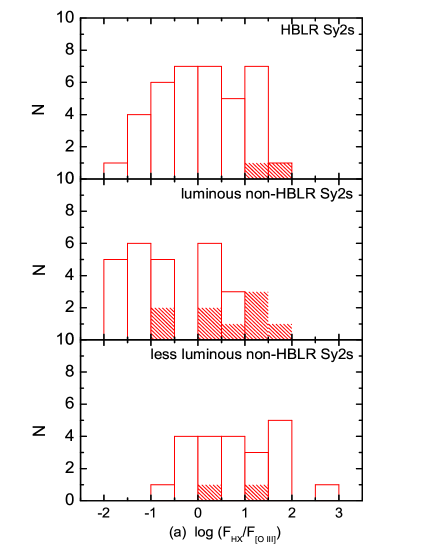
In Figure 1.c, , which is the ratio “”, is a good indicator of obscuration (Bassani et al. 1999; Tran 2003; here, [O iii] fluxes have been corrected for extinction, and X-ray fluxes have not been corrected for absorption). Table 3 shows little difference in between the two groups. An ASURV test shows that the probability for the two samples to be extracted from the same parent population is about . The mean value of is for non-HBLR Sy2s and for HBLR Sy2s.
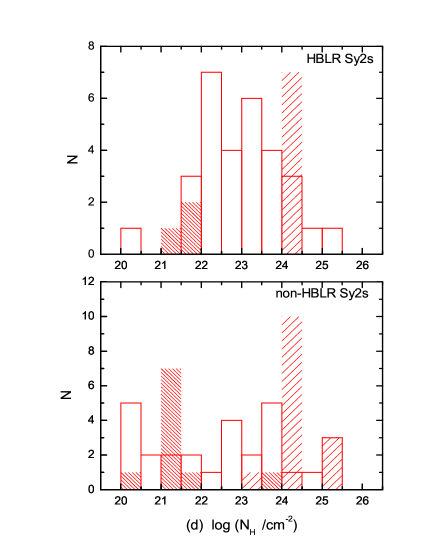
In Figure 1.d, the distributions between HBLR and non-HBLR Sy2s are not significantly different (with a confidence level of ; see Table 3; since an ASURV test could not deal with a case that contained both upper and lower limits, we adopt the upper limits as the measured values). Our distribution is consistent with the results of Gu & Huang (2002), Tran (2003) and Shu et al. (2007). This may be explained by the following reason: since the mean value of is for the less luminous non-HBLR Sy2s (see Table 4), they weaken greatly the difference in between non-HBLR Sy2s and HBLR S2ys (Shu et al. 2007). In section 3.3, we will find that has the significant differences among the luminous, less luminous non-HBLR Sy2s, and HBLR Sy2s (see Table 4 and Figure 4).
In Table 3, non-HBLR Sy2s are obviously larger in terms of the mean value of EW(Fe) than HBLR Sy2s. An ASURV test shows that the difference between the two samples is present (at a level of ). Our result is not consistent with that of Tran (2003) or Shu et al. (2007). This may be explained by the following reason: for the small sample size (only 11 objects) of the less luminous non-HBLR Sy2s with EW(Fe) measurements, adding them to the non-HBLR Sy2 sample cannot weaken the difference () in EW(Fe) found in the luminous Sy2 sample (see Table 4; Shu et al. 2007).
The two mid-infrared line ratios, and , can better distinguish HBLR from non-HBLR Sy2s (see Table 3). Table 3 shows the significant differences in the two ratios between the two groups. A K-S test displays that the probabilities for the two sample to be extracted from the same parent population are and , respectively.
In Table 3, we also provide other statistical results related to the two types of sources. We find that most of the results of various parameters show the significant differences between the two groups. These indicate that HBLR and non-HBLR Sy2s are clearly different subsamples.
3.2. Starburst or AGN Domination in HBLR and Non-HBLR Sy2s
In this section, we test if HBLR Sy2s are dominated by AGNs, and if non-HBLR Sy2s are dominated by starbursts. Next we use two methods to demonstrate different dominant mechanisms between non-HBLR and HBLR Sy2s.
As mentioned in section 1, the AGN activity is the key to understanding the differences between the two kinds of Sy2s. AGN luminosity comes from the disk accretion onto central SMBHs. [O iii] 5007 luminosity represents only an indirect (i.e., reprocessed) measurement of the nuclear activity, but extinction-corrected is a good indicator of the AGN activity for Type II AGNs (Kauffmann et al. 2003).
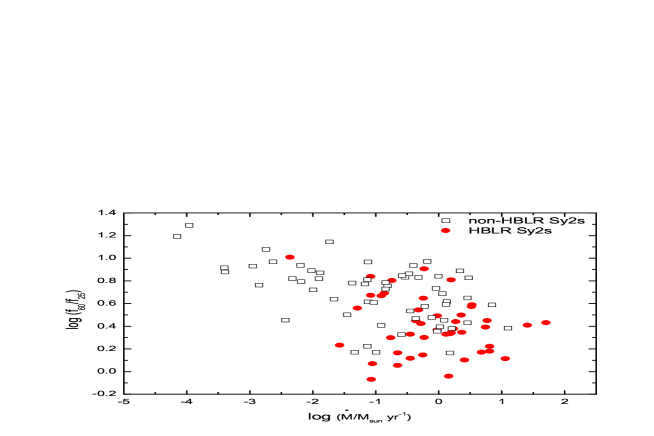
The flux ratio is not a good indicator of the inclination, but of the relative strength of the host galaxy and nuclear emission (Alexander 2001; Shu et al. 2007). It has been shown that HBLR Sy2s have smaller values of ratio, compared to non-HBLR Sy2s (Heisler et al. 1997). In Table 3, the mean value of the ratio is for non-HBLR Sy2s and for HBLR Sy2s. The difference (at the level) in color between them may be due to the relative strength of the host galaxies and nuclear emissions (Alexander 2001), and this is consistent with Baum et al. (2010) who noted that the HBLR Sy2s have a higher ratio of AGN-to-starburst contribution to the spectral energy distribution (SED) than non-HBLR Sy2s, based on their distributions of several starburst and AGN tracers. So, we can show that the ratio denotes the relative strength of starburst and AGN emissions.
In Figure 2, we show the correlation of the ratio versus the accretion rate (defined as ), with Pearson’s correlation coefficient of and a probability of (hereafter, we exclude NGC 676, NGC 1143, NGC 1358, NGC 2685, NGC 4472, and NGC 4698, because they either do not be detected or they are the upper limit of fluxes and below 1 Jy at or .). These results show that they have a significant anticorrelation. As the ratio drops, the value increases. HBLR Sy2s show the smaller ratios and larger values, which may indicate a higher ratio of AGN-to-starburst activity in the SED; non-HBLR Sy2s show the larger ratios and smaller values, which may indicate a lower ratio of AGN-to-starburst activity in the SED. Therefore, we suggest that the non-HBLR Sy2s are dominated by starbursts, while the HBLR Sy2s are dominated by AGNs.
| Parameters | non-HBLR Sy2sA(S1)a | HBLR Sy2s(S2) | non-HBLR Sy2sB(S3)a | ||||||
| Mean | N | Mean | N | Mean | N | S1-S2 | S2-S3 | S1-S3 | |
| (1) | (2) | (3) | (4) | (5) | (6) | (7) | (8) | (9) | (10) |
| log | 23.82 0.26 | 29 | 23.180.19 | 40 | 21.85 0.33 | 23 | 3.02 | 0.01 | 0.01 |
| EW(Fe)b | 1539 | 21 | 54499 | 38 | 955 | 11 | 0.05 | 97.97 | 2.91 |
| 0.96 0.31 | 32 | 6.021.55 | 40 | 55.2839.94 | 24 | 0.04 | 4.92 | 0.01 | |
| log | 41.900.09 | 42 | 42.050.11 | 49 | 39.540.19 | 24 | 20.55 | ||
| log( | 0.270.16 | 28 | -0.120.15 | 34 | -2.570.27 | 21 | 9.82 | 0.01 | 0.01 |
Note: Col.(1): Parameters. Cols.(2)-(3), (4)-(5), and (6)-(7): For each sample of the non-HBLR Sy2sA, HBLR Sy2s, and non-HBLR Sy2sB, “Mean” is the mean value of various parameters and “N” is the number of data points. Col.(8): From the K-S or ASURV test of luminous non-HBLR Sy2s (S1) vs HBLR Sy2s (S2), the probability for the null hypothesis that the two distributions are drawn at random from the same parent population. Col.(9): As in col (8), but for HBLR Sy2s (S2) vs less luminous non-HBLR Sy2s (S3). Col.(10): As in col.(8), but for luminous non-HBLR Sy2s (S1) vs less luminous non-HBLR Sy2s (S3). When there are censored data, we use Gehan’s generalized Wilcoxon test (hypergeometric variance) in ASURV.
a Non-HBLR Sy2sA and Sy2sB indicate the luminous () and less luminous () non-HBLR Sy2s, respectively.
b EW is the Fe K equivalent width in eV.
c An ASURV test does not give the value of .
d Here the Eddington ratio is the same as Table 3.
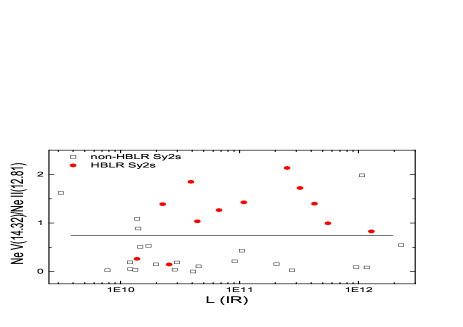
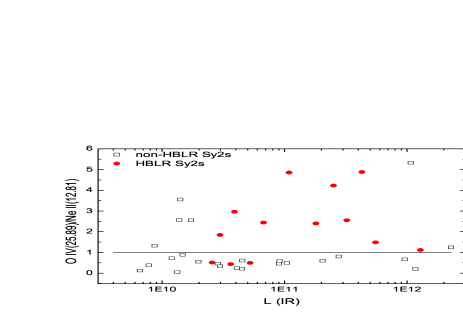
We also use another diagnostic for examining starburst and AGN activities. Due to the intense star formation in the nuclear region of many active galaxies, some fraction of the measured fluxes of low lying fine structure lines (excitation potential eV) will be produced by photoionization from stars rather than AGNs, while the high excitation lines ([O iv] , [Ne v] ) show little or no contamination from possible starburst components (Sturm et al. 2002). Genzel et al. (1998) found that [O iv] /[Ne ii] and [Ne v] /[Ne ii] are much higher in AGNs than in starbursts, which can now be confirmed on a broader statistical basis. [O iv] originates purely from the narrow line region (NLR) in AGNs. In a unified scheme, the NLR line luminosity should be independently orientated and be a good tracer of AGN power, in particular when using an extinction insensitive and modest excitation line like [O iv] (Sturm et al. 2002). Since the ionization potential of [Ne v] is eV, [Ne v] is unlikely to be strong in galaxies without an AGN (Voit 1992; Farrah et al. 2007). While [Ne ii] is a fairly good tracer of hot star emission in starburst activity. In AGNs, the [Ne ii] from the NLR is more easily contaminated by starburst emission than the higher excitation [O iv] line (Sturm et al. 2002).
In Figure 3, the relations of infrared luminosity versus flux ratios of [Ne v] /[Ne ii] and [O iv] /[Ne ii] are shown. We can see in the two regions of each plot that the upper region is primarily HBLR Sy2s and the lower one is primarily non-HBLR Sy2s. The [Ne v] and [O iv] lines are the most useful single line diagnostics (Farrah et al. 2007). As a result, we suggest that the non-HBLR Sy2s are starburst-dominated, while the HBLR Sy2s are AGN-dominated.
In Figures 2 and 3, we find that HBLR and non-HBLR Sy2s clearly show the differences in the power sources. In Table 3, the differences in the accretion rate (), ratio, and two mid-infrared line ratio, and , are significant. So we hold that non-HBLR Sy2s are starburst-dominated, while HBLR Sy2s are AGN-dominated.
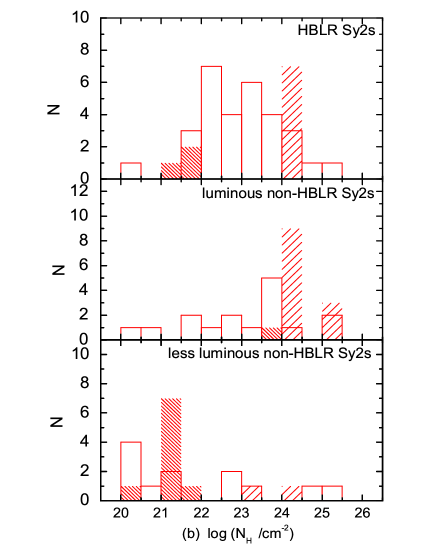
3.3. Physical Nature of the Various Obscuration
In this section, we will investigate differences in the obscuration and reasons of the absence of PBLs in luminous and less luminous non-HBLR Sy2s, and compare them with those of HBLR Sy2s.
With regard to the obscuration between HBLR and non-HBLR Sy2s, our result (see Table 3) and previous results (Tran 2003; Gu Huang 2002; Shu et al. 2007) all show little difference. This reason is that adding the less luminous Sy2s to the Sy2 sample weakens the difference in obscuration found in the luminous Sy2 sample (Shu et al. 2007). Next we discuss the possible physical explanations of the absence of PBLs in the luminous and less luminous non-HBLR Sy2s, respectively.
Table 4 shows that all differences in , EW(Fe), and between the luminous non-HBLR Sy2s and HBLR Sy2s are significant. An ASURV test shows that the probabilities for the two samples to be extracted from the same parent population are , , and , respectively. These results suggest that luminous non-HBLR Sy2s show larger obscuration than HBLR Sy2s. In addition, we do not find a significant difference (with a confidence of level of ) in between luminous non-HBLR Sy2s and HBLR Sy2s, and the mean values of log( are and , respectively. So we suggest that the obscuration is the key cause that makes PBLs weaker or nondetectable for the luminous non-HBLR Sy2s. Our explanation supports Shu et al. (2007)’s suggestion that the absence of PBLs in the luminous Sy2s arises from the obscuration. However, PBLs are not detected in most (24/28) of the less luminous Sy2s in our sample. The reason is still unclear.
To explore the natural reason of the absence of PBLs for less luminous non-HBLR Sy2s, we analyse their obscuration: and (see Table 4), suggesting that the less luminous non-HBLR Sy2s have the smaller obscuration than the luminous non-HBLR Sy2s or HBLR Sy2s111Because the sample size of less luminous non-HBLR Sy2s with EW(Fe) measurements is only 11 and NGC 3982 has an EW(Fe) of 6310 eV, Table 4 shows almost no difference in EW(Fe) between less luminous non-HBLR and HBLR Sy2s. However, the differences in and are significant. So we can accept the result.. Their obscuration seems to be close to that of face-on Sy1s. If the scaleheight of the scattering zone varies with the central source luminosity (Lumsden Alexander 2001), the absence of their PBLs may be due to either the small scaleheight in the scattering region or the inexistence of BLRs. Since the less luminous non-HBLR Sy2s have very small , their scattering screens may have smaller scales than those of the luminous non-HBLR Sy2s or HBLR Sy2s. However, the obscuration of this type of objects is very small and seems to be the same as that of the host galaxy. So we suggest that the invisibility of PBLs for less luminous non-HBLR Sy2s does not arise from the obscuration.
The Eddington ratios of the less luminous non-HBLR Sy2s are generally very small and their mean value is (see Table 4). This is consistent with what Nicastro et al. (2003) argued, that at very low accretion rates, the clouds of BLRs would cease to exist. Since the obscuration of this type of objects is very small, a key factor in the absence of PBLs is the very low Eddington ratio rather than the obscuration. When the accretion rate drops to extremely sub-Eddington values, their central engines undergo fundamental changes and the BLR disappears (Ho 2008). Recently, Tran et al. (2010) suggested that the low-luminosity AGNs are probably powered by radiatively inefficient, or advection dominated accretion flow (ADAF), that intrinsically lack BLRs, as suggested observationally by e.g., Tran (2001, 2003); Bianchi et al. (2008); Panessa et al. (2009); Shi et al. (2010), and inspired theoretically by Nicastro (2000); Laor (2003); Elitzur Shlosman (2006); Elitzur Ho (2009); Cao (2010).
In Table 4, we find that non-HBLR Sy2s can be classified into the luminous () and less luminous samples, when considering only their obscuration. In light of the above discussion, we hold that the invisibility of polarized broad lines (PBLs) in the luminous non-HBLR Sy2s depends on the obscuration; the invisibility of PBLs in the less luminous non-HBLR Sy2s depends on the very low Eddington ratio rather than the obscuration.
4. Conclusion
We conclude that HBLR Sy2s are dominated by AGNs, and non-HBLR Sy2s are dominated by starbursts. This idea is supported by the evidences listed below: (1) compared with non-HBLR Sy2s, HBLR Sy2s have larger accretion rates and smaller ratio which may denotes the relative strength of starbursts and AGN emissions; (2) HBLR Sy2s are intrinsically more powerful than non-HBLR Sy2s from the analysis of [Ne v] , [O iv] , and [Ne ii] , which are the useful single line diagnostics for distinguishing AGN from starburst activity.
In addition, we find that the obscuration of less luminous non-HBLR Sy2s is much smaller than that of luminous non-HBLR Sy2s or HBLR Sy2s. We conclude that in luminous non-HBLR Sy2s, the invisibility of PBLs is due to the obscuration (Shu et al. 2007); in less luminous non-HBLR Sy2s, the invisibility of PBLs may not be due to the scattering screen obscured by the obscuring material, but is very likely due to the very low Eddington ratio and the BLRs are not exist.
Although these results are from our large sample, we should further consider sample completeness and have as large a sample size as possible. In the future, both more complete and unbiased sample of HBLR and non-HBLR Sy2s and fine measurements in various bands will present the physical nature of non-HBLR and HBLR Sy2s.
ACKNOWLEDGMENTS
referees for the careful reading of the manuscript and very helpful comments. We thank Chen Hu, and Xin-Lin Zhou for helpful suggestions and discussions. We also thank James Wicker, Ali Tanni, Ping-Yan Zhou, and Wei Du for polishing the English. This work was supported by the Natural Science Foundation of China (NSFC) Foundation under grants 10933001 and 10778726, the National Basic Research Program of China (973 Program) No.2007CB815404, and the Young Researcher Grant of National Astronomical Observatories, Chinese Academy of Sciences.
References
- Akylas & Georgantopoulos (2009) Akylas, A., & Georgantopoulos, I. 2009, A&A, 500, 999
- Alexander et al. (1999) Alexander, D. M., et al. 1999, MNRAS, 303, L17
- Alexander et al. (2000) Alexander, D. M., et al. 2000, MNRAS, 313, 815
- Alexander (2001) Alexander, D. M. 2001, MNRAS, 320, L15
- Antonucci (1993) Antonucci, R. 1993, ARA&A, 31, 473
- Antonucci & Miller (1985) Antonucci, R., & Miller, J. S. 1985, ApJ, 297, 621
- Ballantyne et al. (2006) Ballantyne, D. R., Everett, J. E., & Murray, N. 2006, ApJ, 639, 740
- Bassani et al. (1999) Bassani, L., et al. 1999, ApJS, 121, 473
- Baum et al. (2010) Baum, S. A., et al. 2010, ApJ, 710, 289
- Bian & Gu (2007) Bian, W., & Gu, Q. 2007, ApJ, 657, 159
- Bianchi et al. (2008) Bianchi, S., et al. 2008, ApJ, 385, 195
- Cao (2010) Cao, X. 2010, ApJ, 724, 855
- Darling & Giovanelli (2002) Darling, J., & Giovanelli, R. 2002, ApJ, 572, 810
- Deo et al. (2007) Deo, R. P., et al. 2007, ApJ, 671, 124
- Elitzur & Shlosman (2006) Elitzur, M., & Shlosman, I. 2006, ApJ, 648, L101
- Elitzur & Ho (2009) Elitzur, M., & Ho, L. C. 2009, ApJ, 701, L91
- Farrah et al. (2007) Farrah, D., et al. 2007, ApJ, 667, 149
- Feigelson & Nelson (1985) Feigelson, E. D., & Nelson, P. I. 1985, ApJ, 293, 192
- Genzel et al. (1998) Genzel, R., et al. 1998, ApJ, 498, 579
- Goulding & Alexander (2009) Goulding, A. D., & Alexander, D. M. 2009, MNRAS, 398, 1365
- Gu & Huang (2002) Gu, Q., & Huang, J. 2002, ApJ, 579, 205
- Gu et al. (2001) Gu, Q., Maiolino, R., & Dultzin-Hacyan, D. 2001, A&A, 366, 765
- Haas et al. (2007) Haas, M., et al. 2007, A&A, 473, 369
- Heisler et al. (1997) Heisler, C. A., Lumsden, S. L., & Bailey, J. A. 1997, Nature, 385, 700
- Ho et al. (1997) Ho, L. C., et al. 1997, ApJS, 112, 315
- Ho (2008) Ho, L. C. 2008, ARA&A, 46, 475
- Imanishi (2002) Imanishi, M. 2002, ApJ, 569, 44
- Inglis et al. (1993) Inglis, M. D., et al. 1993, MNRAS, 263, 895
- Kauffmann et al. (2003) Kauffmann, G., et al. 2003, MNRAS, 346, 1055
- Kay & Moran (1998) Kay, L. E., & Moran, E. C. 1998, PASP, 110, 1003
- Laor (2003) Laor, A. 2003, ApJ, 590, 86
- Lumsden et al. (2001) Lumsden, S. L., Heisler, C. A., Bailey, J. A., Hough, J. H., & Young, S. 2001, MNRAS, 327, 459
- Lumsden & Alexander (2001) Lumsden, S. L., & Alexander, D. M. 2001, MNRAS, 328, L32
- Lumsden et al. (2004) Lumsden, S. L., Alexander, D. M., & Hough, J. H. 2004, MNRAS, 348, 1451
- Lutz et al. (1998) Lutz, D., et al. 1998, A&A, 333, L75
- Maiolino et al. (19980) Maiolino, R., et al. 1998, A&A, 338, 781
- Marconi et al. (2001) Marconi, A., et al. 2001, ApJ, 549, 915
- Martocchia & Matt (2002) Martocchia, A., & Matt, G. 2002, preprint (astro-ph/0210332)
- Miller & Goodrich (1990) Miller, J. S., & Goodrich, R. W. 1990, ApJ, 355, 456
- Moran et al. (2000) Moran, E. C., et al. 2000, ApJ, 540, L73
- Moran et al. (2001) Moran, E. C., et al. 2001, ApJ, 556, L75
- Nagao et al. (2000) Nagao, T., Taniguchi, Y., & Murayama, T. 2000, ApJ, 119, 2605
- Nicastro (2000) Nicastro, F. 2000, ApJ, 530, L65
- Nicastro et al. (2003) Nicastro, F., Martocchia, A, & Matt, G. 2003, ApJ, 589, L13
- Oliva et al. (1998) Oliva, E., et al. 1998, A&A, 329, L21
- Panessa & Bassani (2002) Panessa, F., & Bassani, L. 2002, A&A, 394, 435
- Panessa et al. (2009) Panessa, F., et al. 2009, MNRAS, 398, 1951
- Pernechele et al. (2003) Pernechele, C., et al. 2003, MNRAS, 338, L13
- Risaliti et al. (1999) Risaliti, G., Maiolino, R., & Salvati, M. 1999, ApJ, 522, 157
- Ruiz et al. (1994) Ruiz, M., Rieke, G. H., & Schmidt, G. D. 1994, ApJ, 423, 608
- Sanders et al. (2003) Sanders, D. B., et al. 2003, AJ, 126, 1607
- Sanders & Mirable (1996) Sanders, D. B., & Mirable, I. F. 1996, ARA&A, 34, 749
- Shi et al. (2010) Shi. Y., et al. 2010, ApJ, 714, 115
- Shu et al. (2007) Shu, X.-W., et al. 2007, ApJ, 657, 167
- Sturm et al. (2002) Sturm, D., et al. 2002, A&A, 393, 821
- Surace et al. (2004) Surace, J. E., et al. 2004, AJ, 127, 3235
- Teng et al. (2005) Teng, S. H., et al. 2005, ApJ, 633, 664
- Tommasin et al. (2008) Tommasin, S., et al. 2008, ApJ, 676, 836
- Tran et al. (1992) Tran, H. D., Miller, J. S., & Kay, L. E. 1992, ApJ, 397, 452
- Tran (1995) Tran, H. D. 1995, ApJ, 440, 565
- Tran (2001) Tran, H. D. 2001, ApJ, 554, L19
- Tran (2003) Tran, H. D. 2003, ApJ, 583, 632
- Tran et al. (2010) Tran, H. D.,, Lyke, J. E., & Mader, J. A. 2010, ApJ, 726, L21
- Tran (2010) Tran, H. D. 2010, ApJ, 711, 1174
- Voit (1992) Voit, G. M. 1992, ApJ, 399, 495
- Wang & Zhang (2007) Wang, J.-M., & Zhang, E.-P. 2007, ApJ, 660, 1072
- Wang et al. (2007) Wang, J.-M., et al. 2007, ApJ, 661, L143
- Young et al. (1996) Young, S., et al. 1996, MNRAS, 281, 1206
- Yu & Hwang (2005) Yu, P.-C., & Hwang, C.-Y. 2005, ApJ, 631, 720
- Zhang & Wang (2006) Zhang, E.-P., & Wang, J.-M. 2006, ApJ, 653, 137
APPENDIX
| Name | Referencea | Name | Referencea | Name | Referencea | Name | Referencea | Name | Referencea |
| (1) | (2) | (3) | (4) | (5) | (6) | (7) | (8) | (9) | (10) |
| ESO 428-G014 | 3 | Mrk 334 | 24 | NGC1685 | 3 | NGC4501 | 5L | NGC5695 | 3,5L |
| F00198-7926 | 12 | Mrk 573 | 5L | NGC2685 | 10 | NGC4565 | 10 | NGC5728 | 3,4A |
| F01428-0404 | 10 | Mrk 938 | 5P | NGC3031 | 10 | NGC4579 | 10 | NGC5929 | 5P,6K,12 |
| F03362-1642 | 5L | Mrk 1066 | 2L | NGC3079 | 5L | NGC4594 | 10 | NGC6251 | 10 |
| F04103-2838 | 4A | Mrk 1361 | 12 | NGC3147 | 16KT,26K | NGC4698 | 16KT,26K | NGC6300 | 13A |
| F04210+0401 | 4A | NGC676 | 10 | NGC3281 | 3 | NGC4941 | 3 | NGC6890 | 3 |
| F04229-2528 | 4A | NGC1058 | 10 | NGC3362 | 5L | NGC5033 | 10 | NGC7130 | 12 |
| F04259-0440 | 12 | NGC1143 | 12 | NGC3393 | 17,11 | NGC5128 | 18A | NGC7172 | 19A,12 |
| F08277-0242 | 4A | NGC1144 | 5P | NGC3486 | 10 | NGC5135 | 12,19A | NGC7496 | 4A |
| F10340+0609 | 3,8 | NGC1241 | 5P | NGC3660 | 5L | NGC5194 | 12 | NGC7582 | 19A,12 |
| F13452-4155 | 4A | NGC1320 | 5L | NGC3941 | 10 | NGC5256 | 12 | NGC7590 | 19A |
| F19254-7245 | 14E | NGC1358 | 3 | NGC3982 | 5L | NGC5283 | 5L | NGC7672 | 2L |
| F20210+1121 | 4A | NGC1386 | 3 | NGC4117 | 3 | NGC5347 | 5L | NGC7679 | 10 |
| F23128-5919 | 4A | NGC1667 | 3,5L | NGC4472 | 10 | NGC5643 | 3 | UGC6100 | 5L |
| IC 5298 | 12 | … | … | … | … | … | … | … | … |
| The HBLR Sy2 sample | |||||||||
| Name | Referencea | Name | Referencea | Name | Referencea | Name | Referencea | Name | Referencea |
| (1) | (2) | (3) | (4) | (5) | (6) | (7) | (8) | (9) | (10) |
| ESO273-IG04 | 4A | F18325-5926 | 13L | MCG-3-58-7 | 5P | NGC 591 | 2L,3K | NGC 5252 | 4A,15K |
| F00317-2142 | 10 | F20050-1117 | 10 | MCG-5-23-16 | 13A | NGC 788 | 25L | NGC 5506 | 5,13A |
| F00521-7054 | 4A | F20460+1925 | 4A | Mrk 3 | 2L | NGC 1068 | 20L | NGC 5995 | 12 |
| F01475-0740 | 5P | F22017+0319 | 4A,5P | Mrk 78 | 2L | NGC 2110 | 15K | NGC 6552 | 5P |
| F02581-1136 | 5L | F23060+0505 | 7 | Mrk 348 | 2L | NGC 2273 | 3K | NGC 7212 | 1L |
| F04385-0828 | 5LP | IC 1631 | 10 | Mrk 463E | 2L,4A | NGC 2992 | 13A | NGC 7314 | 13A |
| F05189-2524 | 4A | IC 3639 | 12 | Mrk 477 | 1L | NGC 3081 | 3K | NGC 7674 | 2L,4A |
| F11057-1131 | 4A | IC 5063 | 13A,23A | Mrk 1210 | 1L | NGC 3185 | 10 | NGC 7682 | 5P |
| F15480-0344 | 4A | Circinus | 9E,21A | NGC 424 | 3C | NGC 4388 | 4A | Was 49b | 1L |
| F17345+1124 | 7 | MCG-3-34-64 | 4A | NGC 513 | 22L | NGC 4507 | 3K | … | … |
Notes: Column 1, 3, 5, 7, and 9: source name; Column 2, 4, 6, 8, and 10: the corresponding reference of the spectropolarimetric observations..
a Letters denote references that used the following telescope: C=CTIO (4 m), P=Palomar (5 m), K=Keck (10 m), L=Lick (3 m), S=Subaru (8.2 m), E=ESO (3.6), KT=Kitt (2.3 m), and A=AAT (3.9 m).
References: (1) Tran 92; (2) Miller & Goodrich 1990 ; (3) Moran et al. 2000; (4) Young et al. 1996; (5) Tran 2001; (6) Moran et al. 2001; (7) Gu & Huang 2002; (8) Shu et al. 2007; (9) Oliva et al. 1998; (10) Wang & Zhang 2007; (11) Gu et al. 2001; (12) Lumsden et al. 2001; (13) Lumsden et al. 2004; (14) Pernechele et al. 2003; (15) Tran 2010; (16) Shi et al. 2010; (17) Nagao et al. 2000; (18) Alexander et al. 1999; (19) Heisler et al. 1997; (20) Antonucci & Miller 1985; (21) Alexander et al. 2000; (22) Tran 1995; (23) Inglis et al. 1993; (24) Ruiz et al. 1994; (25) Kay & Moran 1998 (26) Tran et al. 2010.