Rotation of the NGC 1333 IRAS 4A2 Protostellar Jet
Abstract
The bipolar jet of the NGC 1333 IRAS 4A2 protostar shows a velocity gradient in the direction perpendicular to the jet axis. This lateral velocity gradient can be seen throughout the jet imaged in a silicon monoxide line, 2500–8700 AU from the driving source, and is consistent with the rotation of the accretion disk. If this gradient is caused by the rotation of the jet around its axis, the average specific angular momentum is about 1.5 1021 cm2 s-1. Comparison of the kinematics between the jet and the disk suggests that the jet-launching region on the disk has a radius of about 2 AU, which supports the disk-wind models. The angular momentum transported away by the jet seems to be large enough for the protostar to accrete matter from the disk, confirming the crucial role of jets in the early phase of star formation process.
1 INTRODUCTION
In star formation processes, from a dense core of interstellar cloud to a main-sequence star, the specific angular momentum has to decrease million-fold (Bodenheimer 1995), and the loss of angular momentum is essential. The spin-down mechanism is not well understood, but the transportation of angular momentum by a protostellar jet is thought to be one of the important processes (Ray et al. 2007). The jets are thought to be driven by rotating disks through magneto-centrifugal processes (Blandford & Payne 1982; Ray et al. 2007; Pudritz et al. 2007). However, quantitative understanding of the jet-driving mechanism has been difficult because examples showing rotation in both disk and jet are rare. To understand this process quantitatively, it is important to study the kinematics of a system showing the rotation in both disk and jet.
NGC 1333 IRAS 4A2 is a Class 0 protostar that belongs to a binary system in the Perseus star-forming region at a distance of 235 pc from the Sun (Sandell et al. 1991; Lay et al. 1995; Looney et al. 2000; Hirota et al. 2008; Enoch et al. 2009). IRAS 4A2 drives a prominent jet seen clearly in many molecular lines (Blake et al. 1995; Lefloch et al. 1998). The IRAS 4A2 bipolar jet imaged in an SiO line is extremely well collimated and suitable for a detailed study (Choi 2005). Comparison of the proper motion from molecular hydrogen images with the line-of-sight velocity from the SiO spectra suggests that the jet axis is close to the plane of the sky with an inclination angle of 107 (Choi 2005; Choi et al. 2006).
It was previously noticed that the SiO jet displays a lateral velocity gradient, which was puzzling (Choi 2005). While rotation is an obvious explanation, detailed interpretations were deferred until the rotation direction of the circumstellar disk can be determined observationally. The disk of IRAS 4A2 is bright in the NH3 lines and elongated in the direction perpendicular to the jet axis (Choi et al. 2007). Recent observations showed that the disk displays a Kerplerian-like rotation (Choi et al. 2010). The derived mass of the central protostar is 0.08 , and the collapse age is 50,000 yr. The sense of disk rotation is consistent with the velocity gradient of the SiO jet, which strongly suggests that the jet is rotating around the flow axis.
In this Letter, we present the results of our data analysis of the NGC 1333 IRAS 4A2 SiO jet. We describe the data and results in Section 2. In Section 3, we discuss the rotation of the IRAS 4A2 jet and its implications.
2 DATA AND RESULTS
Details of the observations and the results were presented by Choi (2005). The NGC 1333 IRAS 4 region was observed using the Very Large Array (VLA) in the SiO line. The resulting image has a restoring beam of FWHM = 196 with a natural weighting. When a higher resolution is needed for the analysis, an image made with a robust weighting was used, which has a beam size of 150. The natural weighting gives a higher signal-to-noise ratio, while the robust weighting gives a smaller beam size.
There are several SiO emission peaks distributed along the bipolar jet of IRAS 4A2 (see Figure 2(a) of Choi 2005). The downstream half of the northeastern jet (SiO outflow peaks 1–3) is strongly disturbed by the interaction with an ambient cloud core (Choi 2005; Baek et al. 2009). In this Letter, we concentrate our attention to the undisturbed part of the jet (Figure 1; SiO outflow peaks 4–12).
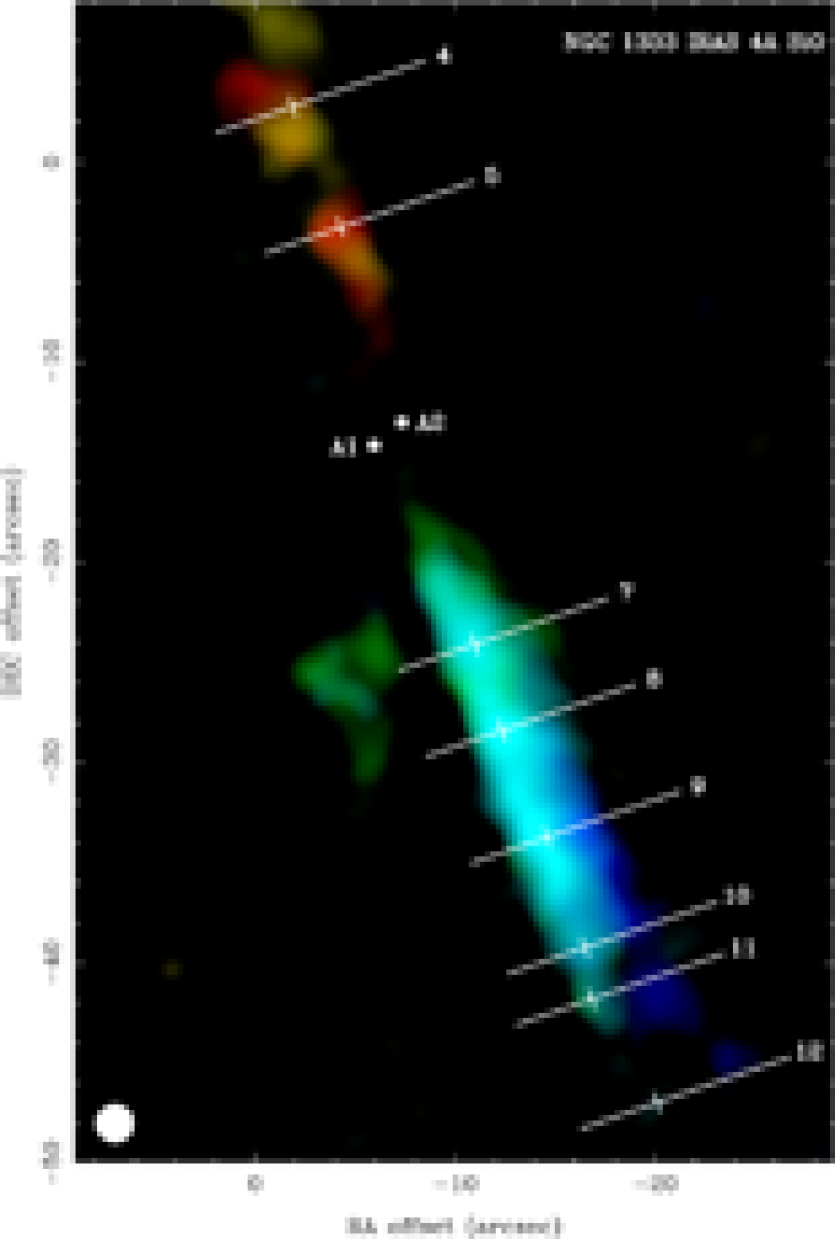
[See http://minho.kasi.re.kr/Publications.html for the original high-quality figure.]
To investigate the kinematics along the lateral direction (i.e., perpendicular to the jet axis) position-velocity (PV) diagrams were made along several cuts passing through the emission peaks (Figure 2). The reference position of each cut shown in Figure 1 is the peak position of the map integrated over the whole velocity interval. The exact location of the reference position, however, is not important because all the calculations in the discussion require position differences, not the absolute position. All the PV diagrams show that the SiO emission is distributed along diagonal lines. The sense of velocity gradient is consistent throughout the jet: the northwestern side is blueshifted relative to the southeastern side.
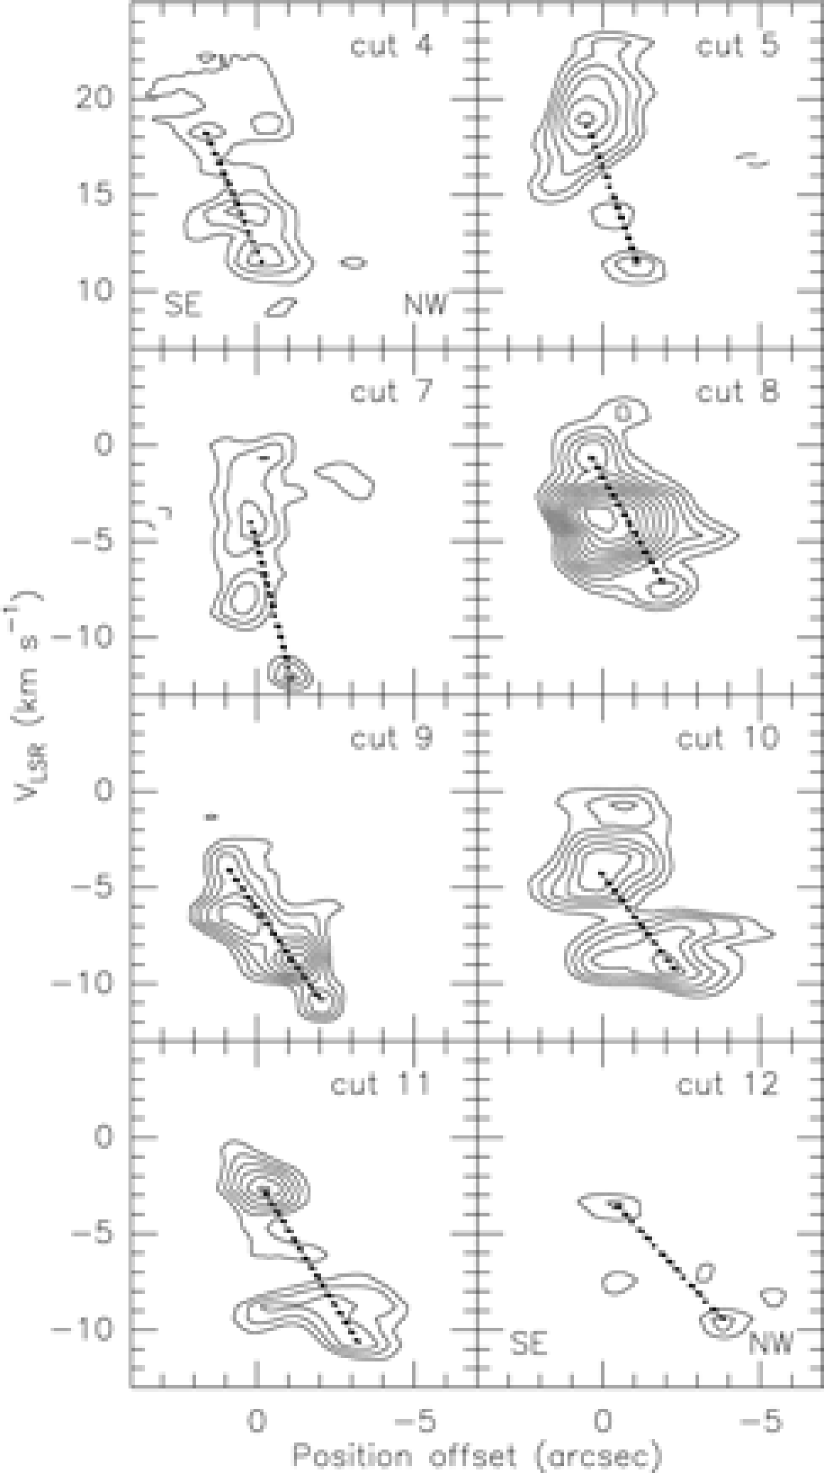
[See http://minho.kasi.re.kr/Publications.html for the original high-quality figure.]
3 DISCUSSION
3.1 Jet Rotation
Since the sense of lateral velocity gradient is consistent throughout the whole system (the southwestern jet, the disk, and the northeastern jet), the most natural and obvious explanation is that the velocity gradient is caused by the rotation around the jet/disk axis. Alternative explanations for the lateral velocity gradients of outflow were proposed previously (e.g., Soker 2005; Cerqueira et al. 2006), but they do not seem to apply to the case of IRAS 4A2 (see the discussion in Section 4.3 of Chrysostomou et al. 2008). The linear pattern of emission in the PV diagrams (Figure 2) suggests that either the SiO emission comes from a cylindrical layer around the flow axis or the SiO jet is rotating like a rigid body. At several positions (e.g., cuts 10 and 11) the SiO emission is stronger at both ends of the diagonal than at the middle part, probably owing to the limb-brightening effect. It should be noted that some emission peaks are off the diagonal lines (e.g., the –8.1 km s-1 peak of cut 7), suggesting that the jet structure is more complicated than our simple description. There is also some ambiguity in selecting the end points of the diagonal lines at a few cuts (e.g., the red ends of cut 7 and cut 10). The uncertainty introduced by this ambiguity does not significantly affect the conclusions in Sections 3.2 and 3.3.
To understand the jet rotation quantitatively, several physical parameters are plotted as a function of distance from the driving source (Figure 3). The jet radius, , is the half-distance between the end points of the diagonal lines shown in Figure 2. The rotation speed, , is half of the velocity difference between the end points of the diagonal lines, corrected for the inclination angle. The angular speed is , and the specific angular momentum is . These parameters were calculated assuming that the SiO emission at each lateral cut (cross section perpendicular to the jet axis) comes from a hollow ring. Otherwise, a correction factor may be applied to each parameter. For example, if the SiO emission comes from a uniform-density disk with a rigid-body rotation, the average rotation speed would be shown in Figure 3(b) multiplied by a factor of 2/3, and the average specific angular momentum would need a correction factor of 1/2. A more complete description of these parameters would require information on the jet structure such as rotation curve, density profile, and molecular abundance profile as functions of radius from the jet axis, but these details are unavailable and beyond the scope of this Letter. Multi-species multi-transition observations in the future can be helpful.

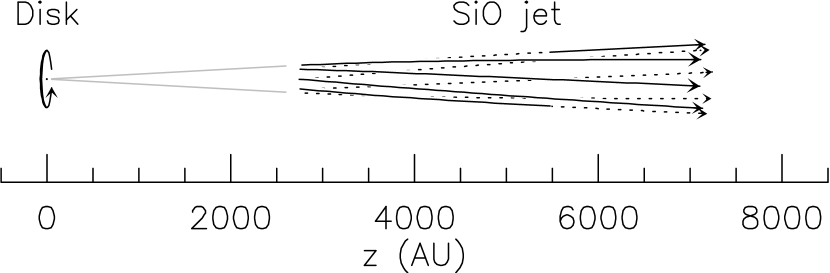
Figure 3(a) shows that increases almost linearly, and extrapolating the best-fit line to the driving source (position offset of zero) gives a small radius (100 70 AU), which suggests that the shape of the SiO jet is similar to a cone with a finite opening angle. Figure 4 shows a schematic description of the jet structure. The rotation speed seems to decrease with the distance, but the scatter is large in the downstream part of the SiO jet (Figure 3(b)). The angular speed also decreases with the distance: the slope is relatively steep at small distances and then becomes shallow at large distances (Figure 3(c)). These behaviors of and are expected from the conservation of angular momentum when the jet has a finite opening angle. However, increases with the distance (Figure 3(d)), which implies that either the angular momentum injected into the jet may vary with time or the correction factor varies as the jet propagates (see the discussion in Section 3.2). In any case, the fact that is not decreasing suggests that the loss of angular momentum through the interaction with the ambient medium is not an efficient process.
It is interesting to note that of the paired data points at the same distance from the driving source (cuts 5/7 and cuts 4/8) agree within the uncertainties. This physical connection between the opposite lobes of the bipolar jet may be natural because the jet materials at each pair were ejected at almost the same time from the jet engine (disk). Therefore, the physical parameters of a specific part of the jet can be used to understand the properties of the jet engine at the time of ejection.
3.2 Jet Engine
One of the interesting quantities in many models of jet driving mechanism is the location of the jet-launching region on the disk. Simply extrapolating to a small distance would not give the answer because the intrinsic shape of the jet stream line is unknown. Instead, the conservation laws of magneto-hydrodynamic winds can be used (Pudritz et al. 2007). The energy and angular momentum extracted from the disk are in an electromagnetic form at the base (or foot) of the jet and almost completely converted to a kinetic form in the observed part of the jet (Anderson et al. 2003). Therefore, and measured from the SiO jet can be used to derive the angular speed at the base of the jet, , which can be converted to the radius of outflow foot-ring, .
The IRAS 4A2 jet was seen in a molecular hydrogen line, and its proper motion was measured (Choi et al. 2006), which gives the velocity of the jet in the plane of the sky to be about 71 km s-1. If this value can be applied to the SiO jet, the total specific energy and angular momentum can be calculated at each position. These quantities are conserved along the field line as protostellar outflows are considered cold magneto-hydrodynamic winds (Mestel 1968; Pudritz et al. 2007). Then can be obtained by solving equation (4) of Anderson et al. (2003), which can be converted to the foot-ring radius of the jet,
| (1) |
where is the mass of the central protostar. Figure 5(a) shows at the time of ejection for each lateral cut on the jet, which is distributed in the range of 1.5–2.8 AU. The average foot-ring radius is 2.0 AU. Figure 5(a) also shows that is slowly increasing with the distance or jet propagation time. If this trend is real, it could mean that the outflow launching region on the disk is shrinking in size.

The jet, however, is not necessarily launched from a thin ring, and the distribution of emission needs to be considered. For example, the emission of cut 10 is mostly concentrated at the two ends of the diagonal line in the PV diagram (Figure 2), and the given in Figure 5(a) is a good representative value. By contrast, for cut 9, strong emission comes from the middle part of the diagonal (Figure 2). If we take the two strongest peaks of cut 9 and repeat the same calculations, can be as small as 0.6 AU. Another implicit assumption is the Keplerian disk. As mentioned by Choi et al. (2010), the assumption of Keplerian rotation of accretion disk needs to be tested with future observations. Therefore, the uncertainties of and related quantities may be larger than the statistical uncertainties shown in Figure 5.
The measured foot-ring radius of 2 AU seems to favor the disk-wind models (Pudritz et al. 2007) that predict jets launched from an extensive area on the disk with a radius of a few AU. However, jets coming from the inner edge of the disk at a few stellar radii (Shu et al. 2000), cannot be ruled out, because it is possible that there is yet another component of jet that is not traced by the SiO line. Future observations of the jet rotation with atomic tracer lines would provide a more complete answer.
3.3 Angular Momentum Transport
If enough mass can be loaded, the jet can carry away the angular momentum in the disk so that the mass accretion can continue. The required ratio of mass ejection to mass accretion can be approximately obtained by comparing the specific angular momenta in the jet and disk (Pelletier & Pudritz 1992; Anderson et al. 2003; Pudritz et al. 2007). The mass ejection efficiency can be calculated by
| (2) |
where is the mass outflow rate, is the mass accretion rate, and is the Alfvén radius. For the SiO jet of IRAS 4A2, is only a few percent (Figure 5(b)), which is slightly smaller than the typical value (5–10%) of young stellar objects (Ray et al. 2007). Therefore, the jet seems to be playing an essential role in the growth of the protostar IRAS 4A2.
While rotating jets of some T Tauri stars were observed previously (Bacciotti et al. 2002; Ray et al. 2007; Launhardt et al. 2009), they are young stellar objects well past the main accretion phase, and the transport of angular momentum is less critical. Rotation of the HH 26 flow driven by a Class I source was reported by Chrysostomou et al. (2008), and the derived foot-ring radius is 2–4 AU. (Also see Zapata et al. (2010) for a possible rotating jet of a young object in an ambiguous evolutionary stage.) It has been elusive to detect a rotating jet of a protostar in the very early (Class 0) phase of evolution when the removal of angular momentum is crucial. For example, detections of lateral velocity gradients were reported for the HH 211 jet (Lee et al. 2007), but it was later found that the sense of gradient can be reversed at other parts of the jet (Lee et al. 2009), which suggests that the lateral velocity gradients in this jet are not caused by rotation. By contrast, the IRAS 4A2 Class 0 system presented in this Letter shows the velocity gradient very consistently throughout the bipolar jet, which provides reliable measures of the rotation kinematics and allows a test of models of jet driving mechanism.
References
- (1) Anderson, J. M., Li, Z.-Y., Krasnopolsky, R., & Blandford, R. D. 2003, ApJ, 590, L107
- (2) Bacciotti, F., Ray, T. P., Mundt, R., Eislöffel, J., & Solf, J. 2002, ApJ, 576, 222
- (3) Baek, C. H., Kim, J., & Choi, M. 2009, ApJ, 690, 944
- (4) Blake, G. A., Sandell, G., van Dishoeck, E. F., Groesbeck, T. D., Mundy, L. G., & Aspin, C. 1995, ApJ, 441, 689
- (5) Blandford, R. D., & Payne, D. G. 1982, MNRAS, 199, 883
- (6) Bodenheimer, P. 1995, ARA&A, 33, 199
- (7) Cerqueira, A. H., Velázquez, P. F., Raga, A. C., Vasconcelos, M. J., & de Colle, F. 2006, A&A, 448, 231
- (8) Choi, M. 2005, ApJ, 630, 976
- (9) Choi, M., Hodapp, K. W., Hayashi, M., Motohara, K., Pak, S., & Pyo, T.-S. 2006, ApJ, 646, 1050
- (10) Choi, M., Tatematsu, K., & Kang, M. 2010, ApJ, 723, L34
- (11) Choi, M., Tatematsu, K., Park, G., & Kang, M. 2007, ApJ, 667, L183
- (12) Chrysostomou, A., Bacciotti, F., Nisini, B., Ray, T. P., Eislöffel, J., Davis, C. J., & Takami, M. 2008, A&A, 482, 575
- (13) Enoch, M. L., Evans, N. J., II, Sargent, A. I., & Glenn, J. 2009, ApJ, 692, 973
- (14) Hirota, T., et al. 2008, PASJ, 60, 37
- (15) Launhardt, R., et al. 2009, A&A, 494, 147
- (16) Lay, O. P., Carlstrom, J. E., & Hills, R. E. 1995, ApJ, 452, L73
- (17) Lee, C.-F., Hirano, N., Palau, A., Ho, P. T. P., Bourke, T. L., Zhang, Q., & Shang, H. 2009, ApJ, 699, 1584
- (18) Lee, C.-F., Ho, P. T. P., Palau, A., Hirano, N., Bourke, T. L., Shang, H., & Zhang, Q. 2007, ApJ, 670, 1188
- (19) Lefloch, B., Castets, A., Cernicharo, J., & Loinard, L. 1998, ApJ, 504, L109
- (20) Looney, L. W., Mundy, L. G., & Welch, W. J. 2000, ApJ, 529, 477
- (21) Mestel, L. 1968, MNRAS, 138, 359
- (22) Pelletier, G., & Pudritz, R. E. 1992, ApJ, 394, 117
- (23) Pudritz, R. E., Ouyed, R., Fendt, C., Brandenburg, A. 2007, in Protostars and Planets V, ed. B. Reipurth, D. Jewitt, & K. Keil (Tucson, AZ: Univ. Arizona Press), 277
- (24) Ray, T., Dougados, C., Bacciotti, F., Eislöffel, J., & Chrysostomou, A. 2007, in Protostars and Planets V, ed. B. Reipurth, D. Jewitt, & K. Keil (Tucson, AZ: Univ. Arizona Press), 231
- (25) Reipurth, B., Rodríguez, L. F., Anglada, G., & Bally, J. 2002, AJ, 124, 1045
- (26) Sandell, G., Aspin, C., Duncan, W. D., Russell, A. P. G., & Robson, E. I. 1991, ApJ, 376, L17
- (27) Shu, F. H., Najita, J. R., Shang, H., & Li, Z.-Y. 2000, in Protostars & Planets IV, ed. V. Mannings, A. P. Boss, S. Russell (Tucson, AZ; Univ. Arizona Press), 789
- (28) Soker, N. 2005, A&A, 435, 125
- (29) Zapata, L. A., Schmid-Burgk, J., Muders, D., Schilke, P., Menten, K., & Guesten, R. 2010, A&A, 510, A2
arXiv version