TeV blazars and their distance
Abstract:
Recently, a new method to constrain the distance of blazars with unknown redshift using combined observations in the GeV and TeV regimes has been developed, with the underlying assumption that the Very High Energy (VHE) spectrum corrected for the absorption of TeV photons by the Extragalactic Background Light (EBL) via photon-photon interaction should still be softer than the gamma-ray spectrum observed by Fermi/LAT. The constraints found are related to the real redshifts by a simple linear relation, that has been used to infer the unknown distance of blazars. The sample will be revised with the up-to-date spectra in both TeV and GeV bands, the method tested with the more recent EBL models and finally applied to the unknown distance blazars detected at VHE.
1 Introduction
The extragalactic TeV sky catalogue ( GeV), counts nowadays 45 objects111For an updated list see: http://www.mppmu.mpg.de/rwagner/sources/. Many of these sources have been recently detected also at GeV energies by the Fermi satellite [1, 2], allowing for the first time a quasi-continuous coverage of the spectral shape of extragalactic VHE emitters over more than 4 decades of energy. The large majority of extragalactic TeV emitting objects are blazars, radio-loud active galactic nuclei with a relativistic jet closely oriented towards the Earth, as described in [12]. The photon flux emitted by a blazar in both GeV and TeV regimes can be usually well approximated with power laws, of the form , where is the power law index. An important effect involving VHE photons emitted by cosmological sources is the production of electron-positron pairs (), caused by the interaction with the so-called Extragalactic Background Light (EBL) [11]. Quantitatively, the effect of the interaction of VHE photons with EBL is an exponential attenuation of the flux by a factor , where is the optical depth, function of both photon energy and source redshift. Thus, the observed differential energy spectrum from a blazar is related to the emitted one according to . EBL is composed of stellar light emitted and partially reprocessed by dust throughout the entire history of cosmic evolution. Due to the lack of direct EBL knowledge, many models have been elaborated in the last years [5, 6, 7, 10], but the uncertainties remains quite large. Moreover, for some blazars, the derivation of the intrinsic spectrum is difficult due to the uncertainty or lack of a measurement of the redshift.
In a recent paper, we have proposed a method to derive an estimate on the distance of a blazar [8]. The method is based on the comparison between the spectral index at GeV energies as measured by LAT after 5.5 months of data taking, basically unaffected by the cosmological absorption, and the TeV spectrum corrected for the absorption. In that work, it is shown that according to present observations, the spectral slope measured by LAT, , in the energy range 0.2–300 GeV, can be considered as a limiting slope for the emitted spectrum at TeV energies (i.e. corrected for EBL absorption). This maximum hardness hypothesis was successfully tested on a sample of 14 well–known distance sources. Consequently, the redshift, , at which the deabsorbed TeV slope equals , can be used as an upper limit for the source distance. An empirical relation between the upper limit, , and the true redshift of a blazar was then found. A simple linear relation fits well the – distribution, for three different EBL models. The relation is associated to the linear expression, found in [9], for the steepening of the observed TeV slopes due to EBL absorption. Hence, and are related by a linear function of the form . This relation can be used to give an estimate on the source distance.
2 Analysis and results
| Source Name | |||||
|---|---|---|---|---|---|
| (5.5 m) | (1 y) | ||||
| Mkn 421 | 0.030 | 1.78 0.03 | 1.81 0.02 | 0.07 0.02 | 0.07 0.02 |
| Mkn 501 | 0.034 | 1.73 0.06 | 1.85 0.04 | 0.08 0.02 | 0.07 0.02 |
| 1ES 2344514 | 0.044 | 1.76 0.27 | 1.57 0.17 | 0.19 0.03 | 0.18 0.03 |
| Mkn 180 | 0.045 | 1.91 0.18 | 1.86 0.11 | 0.21 0.11 | 0.20 0.11 |
| 1ES 1959650 | 0.047 | 1.99 0.09 | 2.09 0.05 | 0.07 0.03 | 0.07 0.03 |
| BL Lacertae | 0.069 | 2.43 0.10 | 2.37 0.04 | 0.27 0.14 | 0.26 0.15 |
| PKS 2005489 | 0.071 | 1.91 0.09 | 1.90 0.06 | 0.18 0.03 | 0.18 0.03 |
| W Comae | 0.102 | 2.02 0.06 | 2.06 0.04 | 0.24 0.05 | 0.23 0.05 |
| PKS 2155304 | 0.116 | 1.87 0.03 | 1.91 0.02 | 0.22 0.01 | 0.21 0.01 |
| RGB J0710591 | 0.125 | 1.21 0.25 | 1.28 0.21 | 0.21 0.06 | 0.20 0.06 |
| 1ES 0806524 | 0.138 | 2.04 0.14 | 2.09 0.10 | 0.23 0.15 | 0.22 0.15 |
| H 2356309 | 0.165 | - | 2.10 0.17 | 0.16 0.07 | 0.16 0.07 |
| 1ES 1218304 | 0.182 | 1.63 0.12 | 1.70 0.08 | 0.21 0.08 | 0.20 0.08 |
| 1ES 1101232 | 0.186 | - | 1.36 0.58 | 0.23 0.11 | 0.22 0.10 |
| 1ES 1011496 | 0.212 | 1.82 0.05 | 1.93 0.04 | 0.60 0.18 | 0.60 0.18 |
| S5 0716714 | 0.310a | 2.16 0.04 | 2.15 0.03 | 0.23 0.10 | 0.22 0.10 |
| PG 1553+113 | 0.400 | 1.69 0.04 | 1.66 0.03 | 0.75 0.07 | 0.75 0.07 |
| 3C 66A | 0.444a | 1.93 0.04 | 1.92 0.02 | 0.39 0.05 | 0.38 0.05 |
| 3C 279 | 0.536 | 2.34 0.03 | 2.32 0.02 | - | - |
The updated sample, presented in this study, is composed by all the extragalactic TeV emitters located at redshift larger than and detected by LAT after the first year of data taking [1]. In total, there are 16 sources with well known redshift and two additional sources with uncertain redshift, namely 3C 66A and S5 0716+714. Despite many TeV emitters have been discovered since late 2009 by Cherenkov Telescopes, none of the new sources could be included in our sample, since the corresponding TeV spectra are not published, yet. In the first column of Table 1, we list the sources used in the study. The second and third columns represent the slopes measured by LAT after 5.5 months (between 0.2–300 GeV) and one year (between 0.1–100 GeV). Three new sources are included in the sample: RGB J0710591, H 2356309 and 1ES 1101232, located at redshifts 0.125, 0.165 and 0.186, respectively. The last two sources were not detected by LAT in the first 5.5 months, while the spectrum of RGB J0710591 has only recently been published by the VERITAS collaboration [4]. With respect to the 5.5 months catalogue, the new LAT determination of the spectral slopes is characterized by smaller errors, due to the increased statistics.
With this enlarged data set, we estimate the quantity , redshift at which the deabsorbed TeV spectrum exhibits the same slope measured by LAT at lower energies. We adopt the mean energy density EBL model [6], hereafter Franceschini model222The absorption values used here are taken directly from the WEB site http://www.astro.unipd.it/background, and differ slightly from those used in [8], where an extrapolation method was used., and the new model [5], hereafter Dominguez model. The values obtained are listed in the last two columns of Table 1. In case of 3C 279, the slopes of deabsorbed spectrum do not converge to the LAT value for any redshift.
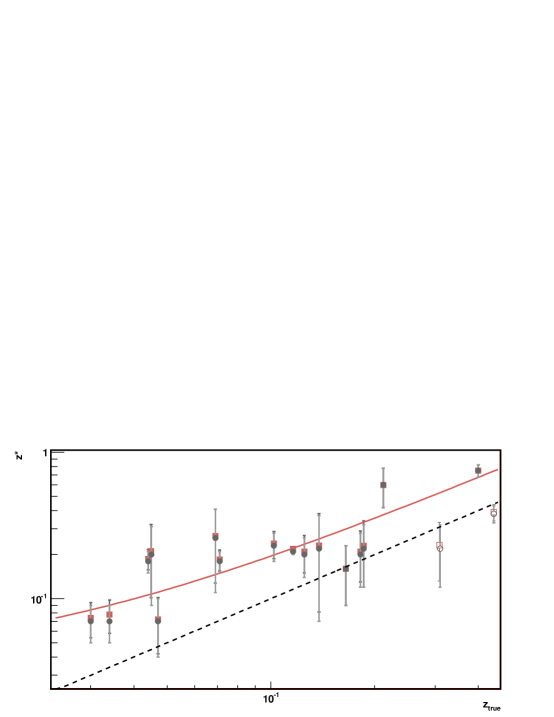
Figure 1 represents the distribution , obtained with the two EBL models. All the values distribute above or on the bisector. This confirms that can be considered an upper limit on the source redshift, hence the maximum hardness hypothesis is confirmed also in this study. The linear curve drawn represents the fit of the data derived with the Franceschini model. The linear trend of the distribution is less evident here than in the previous study. The probability of the fit is, in fact, 6%, well below the previous value (58%). The reason for this behaviour can be related to the new sources introduced, but also to the new LAT determination of the slopes. In order to investigate such alternatives, we have fitted the distribution excluding the three new sources. The new fit returns a probability of 9%, close to the value obtained with the full sample. This result suggests that the low probability found is mainly due to the smaller error bars characterizing the determination of the new slopes in the GeV band with respect to previous estimates. The parameters found with the Dominguez model, Table 2, are similar to those obtained with the Franceschini model.
| EBL Model | ||
|---|---|---|
| Franceschini | 0.036 0.014 | 1.60 0.14 |
| Dominguez | 0.030 0.014 | 1.58 0.14 |
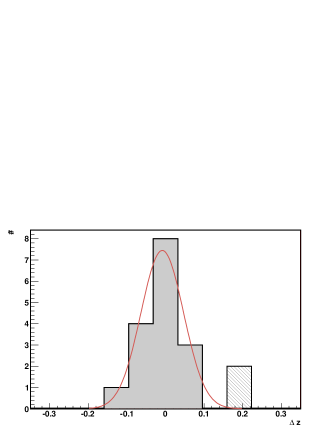
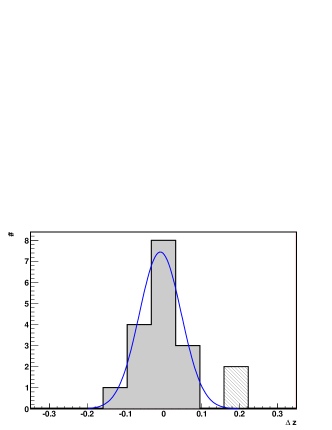
Following the first study, we investigate the distribution , difference between the values , listed in Table 3, obtained by inverting the linear formula = (, and the true redshifts, . The histograms obtained with the two EBL models, Figure 2, are well fitted by a Gaussian of , which can be assumed as the error on the reconstructed redshift, , estimated with this method. In both histograms, the two sources with uncertain redshift, not used for the Gaussian fits, lie outside the expected interval. This result confirms that the behaviour of S5 0716+714 and 3C 66A is different from that found for other sources, suggesting that or these sources are peculiar, or their redshift is wrong.
In conclusion, we can say that with an enlarged data set the results previously found are confirmed. However, the linearity of the – relation has a smaller probability, due to the reduced errors of the new determinations.
| Source Name | |||
|---|---|---|---|
| Mkn 421 | 0.030 | 0.02 | 0.02 |
| Mkn 501 | 0.034 | 0.03 | 0.02 |
| 1ES 2344514 | 0.044 | 0.09 | 0.09 |
| Mkn 180 | 0.045 | 0.11 | 0.11 |
| 1ES 1959650 | 0.047 | 0.02 | 0.02 |
| BL Lacertae | 0.069 | 0.14 | 0.14 |
| PKS 2005489 | 0.071 | 0.09 | 0.09 |
| W Comae | 0.102 | 0.13 | 0.13 |
| PKS 2155304 | 0.116 | 0.11 | 0.11 |
| RGB J0710591 | 0.125 | 0.11 | 0.11 |
| 1ES 0806524 | 0.138 | 0.12 | 0.12 |
| H 2356309 | 0.165 | 0.08 | 0.08 |
| 1ES 1218304 | 0.182 | 0.11 | 0.11 |
| 1ES 1101232 | 0.186 | 0.12 | 0.12 |
| 1ES 1011496 | 0.212 | 0.35 | 0.36 |
| S5 0716714 | 0.310 | 0.12 | 0.12 |
| PG 1553+113 | 0.400 | 0.45 | 0.45 |
| 3C 66A | 0.444 | 0.22 | 0.22 |
3 The redshift of PKS 1424+240
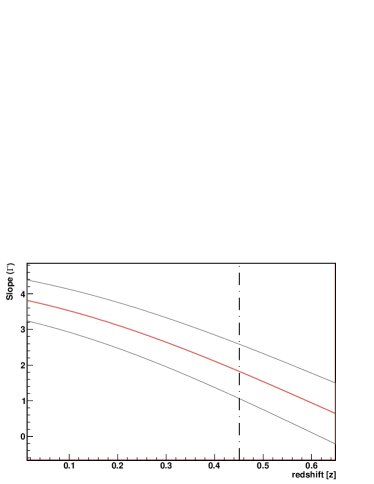
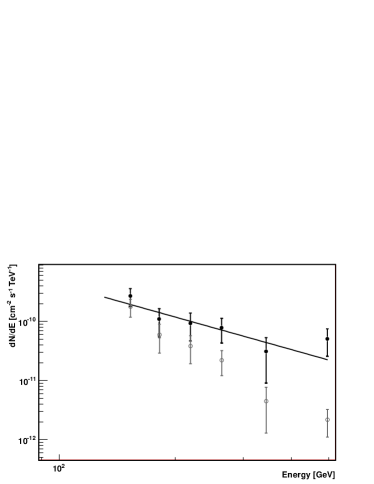
As a final application, we apply our method to PKS 1424+240, a blazar of unknown redshift recently observed in the VHE regime by VERITAS [3]. The slope measured by Fermi/LAT in the energy range 0.1–100 GeV is . The corresponding at which the slope of the deabsorbed TeV spectrum becomes equal to it, is , using the Franceschini EBL model, see Fig. 3. This result is in agreement with the value of , reported in [3], calculated by applying the same procedure but using only simultaneous LAT data. Our estimate on the most probable distance for PKS 1424+240 is 0.26 0.05, where the error is the of the Gaussian fitting the z distribution.
References
- [1] Abdo, A. A. et al., ApJ, 715, 2010, 429
- [2] Abdo A. A. et al., ApJ, 707, 2009, 1310
- [3] Acciari V. A. et al., ApJ, 708, 2010, L100
- [4] Acciari V. A. et al., ApJL, 715, 2010, L49
- [5] Dominguez A. et al., 2011, MNRAS, 410, 2556
- [6] Franceschini A., Rodighiero G. & Vaccari M., AA, 487, 2008, 837
- [7] Kneiske. T. M. Dole H., AA, accepted (astro-ph/1001.2132)
- [8] Prandini E., Bonnoli G., Maraschi L., Mariotti M. & Tavecchio F., MNRAS, 405, 2010, L76
- [9] Stecker F. W. & Scully S. T., ApJ, 709, 2010, L124
- [10] Stecker F. W., Malkan M. A., Scully S. T., ApJ, 648, 2006, 774
- [11] Stecker F. W., de Jager O. C. & Salamon M.H., ApJ, 390, 1992, L49
- [12] Urry C. M. & Padovani P., PASP, 107, 1995, 803