Identification of a Complete 160 Flux-Limited Sample of Infrared Galaxies in the ISO Lockman Hole 1-deg2 Deep Fields: Source Properties and Evidence for Strong Evolution in the FIR Luminosity Function for ULIRGs
Abstract
We have identified a complete, flux-limited, ( mJy), sample of 160m-selected sources from observations of the 1-deg2 ISO Deep Field region in the Lockman Hole. Ground-based UV, optical and near-infrared (NIR) photometry and optical spectroscopy have been used to determine colors, redshifts and masses for the complete sample of 40 galaxies. Spitzer-IRAC+MIPS photometry, supplemented by ISOPHOT data at 90m and 170m, has been used to calculate accurate total infrared luminosities, , and to determine the IR luminosity function (LF) of luminous infrared galaxies (LIRGs). The maximum observed redshift is and the maximum total infrared luminosity is log (. Over the luminosity range log (, the LF for LIRGs in the Lockman Hole Deep Field is similar to that found previously for local sources at similar infrared luminosities. The mean host galaxy mass, log , and dominance of HII-region spectral types, is also similar to what has been found for local LIRGs, suggesting that intense starbursts likely power the bulk of the infrared luminosity for sources in this range of . However for the most luminous sources, log , we find evidence for strong evolution in the LF , assuming pure number density evolution. These ultraluminous infrared galaxies (ULIRGs) have a larger mean host mass, log , and exhibit disturbed morphologies consistent with strong-interactions/mergers, and they are also more likely to be characterized by starburst-AGN composite or AGN spectral types.
1 Introduction
Deep surveys at rest-frame far-infrared (FIR) wavelengths are important for identifying statistically complete samples of luminous infrared galaxies (LIRGs: ) – objects that appear to produce the bulk of the bolometric infrared luminosity density in the universe, and which are often “hidden” and misidentified in deep UV-optical surveys. Until recently, progress has been relatively slow in identifying complete samples of FIR sources selected at wavelengths m, which corresponds to the wavelength range where the majority of LIRGs at emit their peak emission. The Infrared Astronomical Satellite (IRAS) all-sky survey provided the first complete census of 60m-selected galaxies in the local universe (e.g. Soifer et al., 1989; Sanders et al., 2003), but lacked the sensitivity and long wavelength coverage to detect LIRGs at . The Infrared Space Observatory (ISO) provided increased sensitivity and longer wavelength coverage, but background instabilities often limited the determination of exact source positions. The Spitzer Space Telescope eventually provided the combination of long wavelength sensitivity and background stability needed to detect sources at the mJy level with relatively accurate positions, and extensive follow-up observations are now underway to identify source properties and redshifts.
In this paper, we report observations first begun as part of the U.S-Japan ISO-ISOPHOT Deep Survey of a 1-deg2 region in the Lockman Hole (Kawara et al., 1998; Oyabu et al., 2005), and later expanded to include more recent infrared observations of the same region obtained as part of the Spitzer Wide-area InfraRed Extragalatic (SWIRE) survey (Lonsdale et al., 2003). Our final sample consists of MIPS-160m sources with fluxes greater than 120mJy. Multi-wavelength follow-up observations include Keck spectra of the majority of the sources, along with UV-optical photometry from the Sloan Digital Sky Survey (SDSS: York et al., 2000) for all of our sources, NIR photometry from the 2-Micron All Sky Survey (2MASS: Skrutskie et al., 2006) for most of our sources, and VLA 1.4GHz continuum images of the ISO-ISOPHOT deep fields (Yun et al., 2003). While other surveys (e.g. COSMOS: Scoville et al., 2007) may offer superior (particularly ancillary) data, the Lockman Hole survey discussed here subtends a total of 1.2 deg2 and is thus comparable in total area to similar existing datasets. This survey therefore substantially increases the total area to date at these wavelengths and helps guard against cosmic variance.
Sections 2 and 3 describe our field selection and identification of SWIRE
MIPS-160 sources, respectively. Methods used for identifying optical counterparts
are presented in § 3, along with UV-NIR photometry and optical spectroscopy for individual sources.
The spectral energy distributions (SEDs) and calculated infrared luminosities ()
for each source are presented in § 5, and these data are then used to
determine the Infrared galaxy Luminosity Function (LF). Section 6 presents evidence
for evolution in the LF at the highest infrared luminosities, as well as a discussion of the
properties of the host galaxies, including morphology, colors, masses and spectral types.
Our conclusions are presented in § 7.
2 Field Selection and FIR Observations
The Lockman Hole (LH) is a region of the sky with the smallest HI column density (Lockman et al., 1986) and thus has been a favorite target for deep extragalactic surveys, particularly in the FIR where confusion noise from infrared cirrus is expected to be at a minimum.
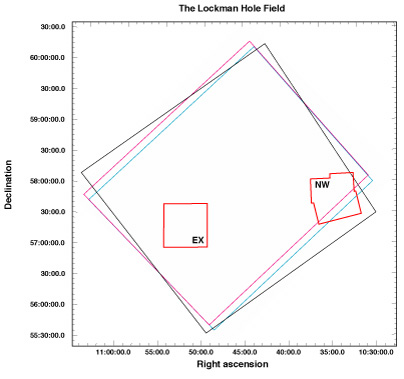
The LH was originally targeted for deep FIR observations with the Infrared Space Observatory (ISO) as part of the Japan/University of Hawaii (UH) ISO cosmology program that carried out observations of 2 small regions (LHEX and LHNW) using the ISOPHOT detector at 90m and 170m. Both LHEX and LHNW are in size (see Figure 1) - the former is centered at , and corresponds approximately to the field center of the ROSAT X-Ray Deep Survey Field (Hasinger et al., 1998), while the latter is centered at , and was chosen by the Japan/UH team to be centered on the true minimum HI column density position within the larger LH field. Note that a small sky area in the LHNW field was also mapped at 7m using ISOCAM on ISO (Taniguchi et al., 1997)
There is a fairly extensive published analysis of the ISOPHOT 90m and 170m data for both LHEX and LHNW, including initial source counts (Kawara et al., 1998), and final source lists (Kawara et al., 2004), along with attempts to identify radio and near-infrared counterparts for individual sources (Yun et al., 2001; Sanders et al., 2001; Yun et al., 2003), and to obtain follow-up spectroscopy (Sanders et al., 2001; Oyabu et al., 2005). However, several factors prohibited using the ISOPHOT data for producing a well identified complete sample of FIR sources, first of which being the relatively large fluctuations in the ISOPHOT background, and the corresponding uncertainty in extracted source positions at both 90m and 170m. Further complications came with the realization that several radio and NIR sources were often found within the relatively large FIR beam.
A major improvement in our ability to determine more reliable FIR fluxes and
more accurate source positions was made possible once data from Spitzer were made public.
In particular, SWIRE, a Spitzer Key Project (Lonsdale et al., 2003) included the LH as one of its
deep survey areas111The SWIRE data release paper is available at:
http://swire.ipac.caltech.edu/swire/astronomers/publications/SWIRE2_doc_083105.pdf. SWIRE obtained maps in all 7 Spitzer IRAC+MIPS bands
(3.6, 4.6, 5.8, 8.0, 24, 70, 160m), and covered both LHEX and LHNW, except for
a small portion of the LHNW region missed by IRAC as shown in Figure 1.
In this paper we use the SWIRE IRAC+MIPS data to produce a new flux-limited sample
of FIR sources in the LHEX + LHNW fields. We also make use of all of our previous
multi-wavelength imaging and spectroscopy along with new data from SDSS and 2MASS
in order to first identify reliable optical counterparts, and then to determine redshifts and
total infrared luminosities for each source. We also use these data to characterize host
galaxy properties (e.g. masses, morphologies, spectral types) in order to better
understand the nature of the infrared galaxy population.
3 The Lockman Hole 160 Sample
The MIPS-160m detector samples emission at wavelengths closest to the rest-frame peak of the FIR/submillimeter SED of infrared luminous galaxies. Most galaxies detected at 160m are also detected at MIPS-70m and MIPS-24m as well as all four IRAC bands. For these reasons, as was the case with previous ISO observations of the LHEX and LHNW fields, we continue to focus on selecting a complete sample of extragalactic sources at the longest observed FIR wavelength.
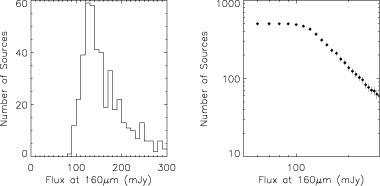
Figure 2 (left panel) shows the distribution of flux density of all 500 sources in the SWIRE LH 160m catalog. It is from this distribution that we take 120mJy as the flux limit for the sample. There are 39 SWIRE 160m sources within the LHEX and LHNW fields down to a flux limit of 120mJy. The integral number counts from the catalog (Figure 2, right panel) follow a constant slope at fluxes above the 120 mJy selection limit, and we therefore take the sample to be complete above this limit (e.g. Beichman et al., 1988; Soifer et al., 1989).
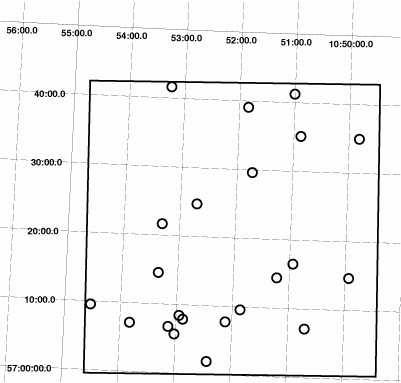
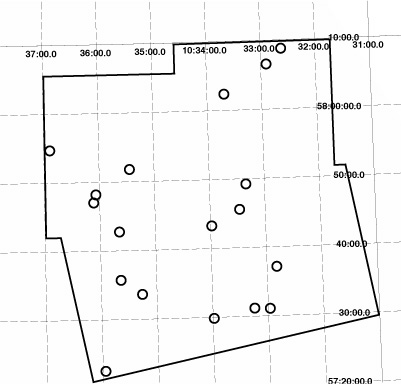
We also compared the MIPS-160m catalog with our previous ISOPHOT 170m catalog, and secondarily with the ISOPHOT 90m catalog, and confirmed our previous suspicions that a significant fraction of the ISOPHOT 170m sources were either spurious 3 noise peaks or weaker sources with boosted flux due to non-Gaussian noise fluctuations. However, we also discovered a few sources where our previous ISOPHOT data along with MIPS-70m data suggested that there should have been a MIPS-160m source above 120mJy, yet there was no source listed in the MIPS-160m catalog. For these cases we went directly to the MIPS images and found that in each case there was a source in the 160m image, so we extracted our own flux at 160m by performing point-spread function (PSF) fitting on the image. This was done in consultation with the SWIRE team so that our flux extraction method would be in agreement with that used to construct the SWIRE catalog. In all but one case our extracted MIPS-160m flux fell below the 120mJy completeness limit. However, for J105252.76570753.7, the extracted MIPS-160m flux of 149mJy was above the completeness limit, thus this source was added to the final list, bringing the total number of sources to 40. The distribution of these 40 sources across the LHNW and LHEX fields is shown in Figure 3.
In addition, there are six sources listed in Table 1 that were included
in the SWIRE MIPS-160m catalog but not the MIPS-70m catalog. This was somewhat
surprising given the sensitivity of the MIPS-70m catalog, and the expected 70m flux
assuming even a fairly extreme 160/70 flux ratio. All six sources were in fact visible in the
70m image, and hence, we again performed PSF fitting in consultation with the SWIRE team to
extract a 70m flux. Thus all 40 of our MIPS-160m sources now have measured
MIPS-70m fluxes.
4 Multiwavelength Data
4.1 UV/Optical and NIR Images
UV/optical and NIR imaging data are critical for identifying the sources responsible for the observed FIR emission, measuring redshifts and computing luminosities. The SWIRE data release actually includes optical () images obtained at Kitt Peak National Observatory (KPNO) covering a large fraction of the LH field, with extracted photometry for those sources matched to the identified IRAC counterparts of MIPS-24m sources (see below). However, SWIRE optical coverage is uneven across our fields, a central portion of the LHEX (ROSAT) field was not targeted for followup and the southwest portion of the LHNW field falls beyond the edge of the IRAC survey (see Figure 1) and consequently was also not observed in optical. As a result, almost half (19/40) of our MIPS-160m sources lack KPNO photometry in the SWIRE catalog. Fortunately, the SDSS provides full coverage of the LH field, and we therefore make use of the catalog photometry from Data Release 7 as well as display color-composite images for all of the MIPS-160m sources. Additionally we use 2MASS catalogs to obtain photometry for the majority (27/40) of our MIPS-160m sources.
4.2 Identification of Counterparts
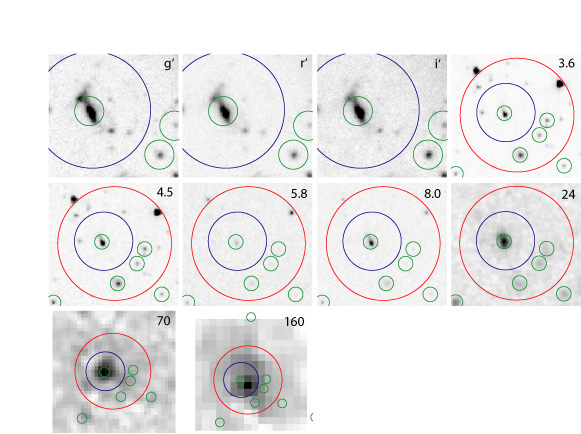
As an initial step the 160m sources were matched with their counterparts in the SWIRE 70m, and IRAC+24m+Optical catalogs. A series of image cutouts from each of the Spitzer IRAC+MIPS bands plus optical images from KPNO were then assembled for each source in order to identify the correct optical counterpart (see Figure 4 for an example222Images of the complete sample are available at: http://ifa.hawaii.edu/~bjacobs/LHonlinefigs.pdf). The red, blue, and green circles overlaid on these images indicate the position of the centroid of each detection in the 160m, 70m, and bandmerged IRAC+24m catalogs, respectively. Each 160m source has one and only one counterpart in the 70m images, and nearly all (36/40) have only one counterpart at 24m. In the cases with multiple 24m sources, we choose the source nearest the 160m centroid. Table 1 lists the source identification numbers from the SWIRE catalogs, as well as coordinates of each source taken from the SWIRE IRAC+24m+Optical catalog, except for sources lacking coverage in two or more IRAC bands (noted in the table) where we list coordinates from the SWIRE 24m catalog. Following the identification of the Optical/IRAC counterpart for each of the MIPS-160m sources, we then match these with objects in the 2MASS and SDSS catalogs and list their source IDs. In the case of 2MASS we prefer to quote the Extended Source Catalog (XSC) when a match is available, but also make use of the Point Source Catalog (PSC). The last two columns in Table 1 list the IDs assigned to sources by Oyabu et al. (2005) using observations from ISO. Table 2 lists the fluxes reported in the SWIRE, 2MASS, and SDSS catalogs along with our own flux measurements as described above.
4.3 Optical spectra
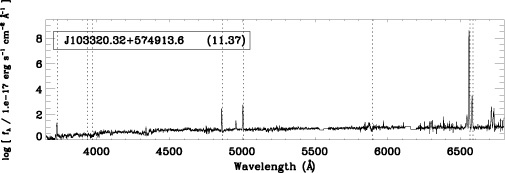
We collected spectroscopic data on the optical counterparts to the ISO sources from several sources, first of which was our library of Keck spectra obtained as part of the original ISO follow-up program which had targeted expected counterparts to the ISOPHOT 170m sources. Both low- and moderate-resolution spectra were taken with the Echellette Spectrograph and Imager (ESI: Sheinis et al., 2000) over several observing runs: 2000 Mar and 2001 Jan UT for the low-resolution data; and 2001 Feb , 2002 Jan , 2002 Feb 16, and 2002 Mar 15 for the moderate-resolution data. The low-resolution spectra had previously been used for redshift identification of putative ISOPHOT 170m counterparts and some of these data were published in Oyabu et al. (2005). The follow-up high-resolution spectra were obtained in order to make accurate emission-line flux measurements. These are published here for the first time. In total, we have Keck spectra for 19/40 (48%) of our complete sample. An example of our high-resolution Keck spectra is shown in Figure 5. In addition to Keck, we supplemented our redshift and flux measurements with public SDSS spectra (Adelman-McCarthy et al., 2007) for an additional 9 of our targets. All 28 of the Keck + SDSS spectra are published on-line in Figures 5.1-5.28333See: http://ifa.hawaii.edu/~bjacobs/LHonlinefigs.pdf. In addition we list spectroscopic redshifts for 2 sources for which the spectra themselves are unavailable (see Table 3).
Ten of our MIPS-160m sources do not have optical spectra. Most of these sources were either not properly identified in the earlier ISOPHOT-170m images, or had several radio and K-band counterparts within the ISOPHOT-170m beam where the dominant counterpart that had previously been targeted with Keck turned out not to be the correct source. For these 10 sources, we have been able to determine fairly accurate photometric redshifts, as described below.
4.4 VLA 1.4 GHz Radio Data
Deep 1.4 GHz radio continuum images of the LHEX and LHNW fields were obtained using the NRAO VLA in the B-configuration in February 2000 and March-April 2001 as part of the AY110 and AY121 programs. The angular resolution of the data are . The achieved sensitivity of the LHEX data is Jy while the sensitivity for the LHNW field is a factor of 2 worse because of a bright (4.2 Jy) continuum source nearby. The photometry is done using the AIPS task SAD, which fits a 2D Gaussian to the brightness distribution, and total integrated flux is reported for extended sources in Table 2. A more detailed discussion of the radio data is presented by Oyabu et al. (2005).
5 Results
The complete photometric data set for each of our 40 MIPS-170m sources is presented in Table 2. We use these data, along with the measured (spectroscopic) and computed (photometric) redshifts listed in Table 3, to construct SEDs for each source and to compute total infrared luminosities, which are then used to construct the luminosity function for our complete sample.
5.1 Photometric Redshifts
The majority of the SWIRE 160m detections have spectroscopic data, which were used to determine their redshifts. For the 10 objects without spectra (noted with “Phot-z” in Table 3), we calculate a photometric redshift using the photometry from SDSS -bands (except for J103341.28+580221.4, see Table 3), 2MASS -bands and IRAC 3.6 and 4.5m. A template-fitting method (Le Phare) was used following the prescription given in Ilbert et al. (2009). This method offers an improvement in photo-z accuracy over previous methods, due primarily to improved calibration using large spectroscopic samples from VLT-VIMOS and Keck-DEIMOS. The best fit redshift values and uncertainties are listed in Table 3.
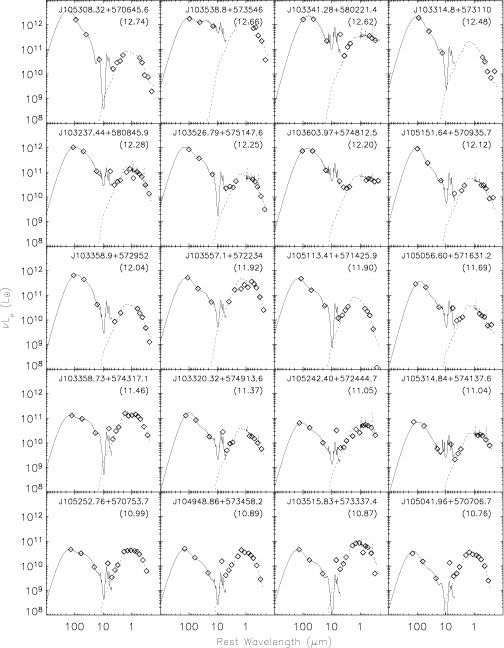
5.2 Spectral Energy Distributions and Infrared Luminosity
The photometry and redshifts were used to construct SEDs () for each source, which are shown in Figure 6 sorted in order of decreasing luminosity. The SEDs are characteristic of what has previously been observed for infrared-selected galaxies, with the most luminous sources showing a dominant “infrared bump” presumably due to thermal dust emission, and an “optical bump” due to thermal emission from stars. Although the mid-infrared sampling is relatively sparse, it is also possible to see the effects of emission from polycyclic aromatic hydrocarbons (PAHs) in the mid-infrared at m, and silicate absorption at m.
The SEDs displayed in Figure 6 also show template fits to the data. The MIPS and 8m points are fit to a library of SED templates by Siebenmorgen & Krugel (2007), and the best fit is shown as solid line. The dotted line in Figure 6 represents a stellar evolution model fit to the UV-NIR data which is used to estimate stellar masses (see below). To estimate each source’s total IR luminosity, m), we use the prescription described by Siebenmorgen & Krugel (2007). The use of this model of SED fitting to estimate IR luminosity over others, such as Chary & Elbaz (2001) or Dale & Helou (2002), is advocated by Symeonidis et al. (2008) largely due to the tendency of these models to underestimate the peak of the FIR luminosity as represented by the 160m flux. This tendency of Siebenmorgen & Krugel (2007) to better fit the FIR data held true for our 160m sample as well. Table 3 lists the computed infrared luminosity for each source.
5.3 Infrared Galaxy Luminosity Function
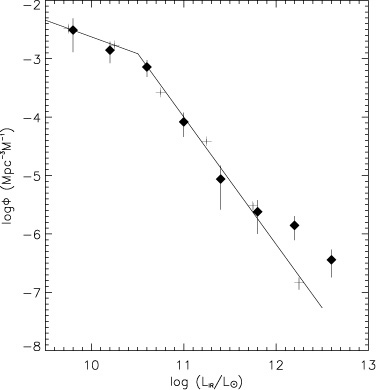
In addition to infrared luminosity, we use each source’s flux at 160m, and redshift ( km s-1 Mpc-1, and to calculate luminosity distance) to calculate a LF from our sample. Figure 7 shows the infrared LF resulting from our observations of the LH in comparison with the LF in the local Universe, previously determined from the IRAS Revised Bright Galaxy Sample (RBGS) all-sky survey, which has median and maximum redshifts: and (Sanders et al., 2003). The LF density values and uncertainties plotted in Figure 7 are listed in Table 4. We divide the data into bins of log in size, corresponding to steps of one in absolute magnitude. Note that SWIRE detected galaxies, J103258.0+573105 and J105349.60+570708.1 at 160m, but we do not include them in our analysis because their calculated total infrared luminosities are log and 8.81 which results in them falling as the lone galaxy in their respective luminosity bins. The volume at which the survey is sensitive to galaxies below this luminosity range is small, so we restrict our attention to higher luminosity sources.
In comparing the LF of our LH data with the RBGS we are comparing a narrow deep survey with
40 galaxies to a wide local survey with several hundred galaxies. This means that the relative significance of
each galaxy is higher for the LH, so it is important to have accurate luminosity estimates. On the
other hand, the one-magnitude bins have the effect of mitigating uncertainties in luminosity, since they can
include galaxies with luminosity estimates differing by as much as a factor of 2.5. This is particularly significant
for the objects in the sample that have luminosity estimates using photometric redshifts, since their luminosity
is less certain than the rest of the sample. The photometric redshifts and their 68% uncertainty limits are noted
in Table 3, and these limits are used to estimate uncertainties in their luminosities. In addition to
photometric redshift uncertainties, the errors in matching to a model infrared luminosity become
less important when the data are binned as described. The space density of galaxies within each bin is calculated
using the method developed by Schmidt (1968), which accounts for the fact that in a flux-limited sample a larger range
of luminosities is observable at small distances than at greater distances. He proposes using a measure of the volume that a
particular flux measurement samples, given the flux limits of the survey. For example, a galaxy at redshift
with a flux at 160m of 170mJy could have been seen at greater redshift (and hence represent
a larger volume), since the flux limit of the sample is 120mJy. This volume sampling is characterized by the
parameter, where is the volume corresponding to the redshift actually observed, and
is the maximum volume over which it could be observed. A mean value of
0.5 within a luminosity bin indicates an even distribution of galaxies within the total volume sampled in that bin.
6 Discussion
6.1 Evidence For Possible Evolution in the Luminosity Function
The space density of galaxies with infrared luminosity (8 - 1000m) in the range log appears to be consistent between the RBGS and our LH sample. In particular, Sanders et al. (2003) fit a broken power-law to the RBGS sample. At log the RBGS is fit with , and at log the power-law is: . The Lockman Hole data for luminosities log , agree within their errors to these power-laws. This concurrence is to be expected given the relatively low redshifts sampled in these lower luminosity bins. At log the situation changes. The co-moving space density of ultraluminous infrared galaxies (ULIRGs: log ) in the log luminosity bin is higher in the LH than in the RBGS. The median redshift of the ULIRGs in the LH in this luminosity bin is . In the highest luminosity bin, log , the median redshift of the 4 LH galaxies in this bin is . To compare the co-moving space density with the RGBS in this bin we extrapolate the RBGS power-law to log and find that the density in the LH sample is higher.
Our new results for the LF of the most luminous infrared galaxies in the LH are consistent with strong evolution in the co-moving space density of ULIRGs. If we assume pure space-density evolution of the form , our new results for the LH imply . This is similar to what was found in an earlier study of the infrared luminosity function of ULIRGs by Kim & Sanders (1998), where the co-moving space density of ULIRGs in the IRAS 1-Jy sample (mean ), was found to be larger than the local space density of ULIRGs in the RBGS (mean ), implying . Our new results are also consistent with a recent determination of the extragalactic 250m luminosity function by Dye et al. (2010), which shows a “smooth increase” with redshift of a factor of 3.6 in the co-moving space density of luminous infrared sources between and , corresponding to .
Deeper far-infrared surveys currently underway with and will eventually allow us to determine whether the strong evolution observed for the most luminous infrared extragalactic sources in the relatively nearby universe continues out to higher redshift. For now, we simply note that if we assume similar strong evolution, e.g. , in the ULIRG population out to higher redshifts, our results would imply a co-moving space-density of ULIRGs that is 700 larger at compared to the value at . Is there evidence for such a large population of ULIRGs at high redshift? The answer seems to be yes. There is a population of faint submillimeter sources detected by the Submillimeter Common User Bolometer Array (SCUBA) on the James Clerk Maxwell Telescope (JCMT), which has been interpreted variously as exotic objects, or ULIRGs at high redshift (Smail et al., 1997; Hughes et al., 1998; Barger et al., 1998; Lilly et al., 1999). Lilly et al. argued that these objects are indeed ULIRGs at . Subsequently, Chapman et al. (2005) measured a range of spectroscopic redshifts, for a sample of 73 submillimeter galaxies, and suggested an evolution in number density of three orders of magnitude for ULIRGs between and . Our results for ULIRGs in the LH, when extrapolated out to are then consistent with the hypothesis that the SCUBA submillimeter sources are indeed ULIRGs.
6.2 Galaxy Properties
To achieve a better understanding of the processes responsible for the observed infrared emission and the nature of the galaxies in our MIPS-160m sample, we use our UV-NIR imaging data and optical spectra to determine galaxy morphology and masses, and spectral types, respectively.
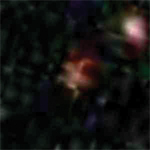
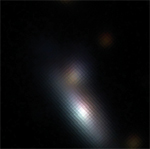
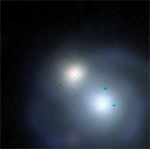
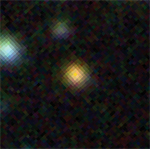
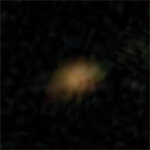
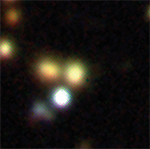
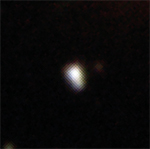
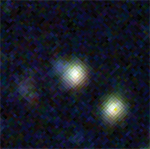
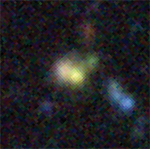
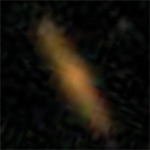
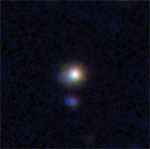
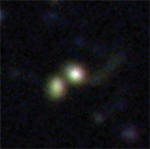
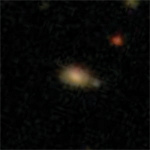
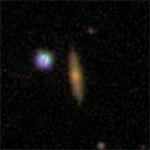
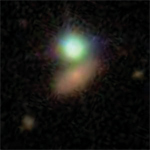
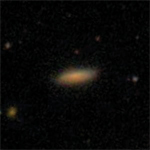
6.2.1 Imaging: Morphology and Masses
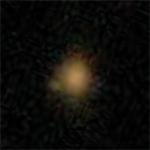
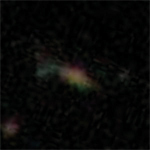
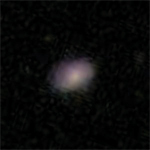
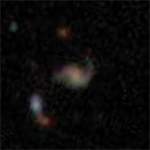
In order to develop a picture of the morphologies, and to gain an indication of the prevalence of merging/interacting galaxies in the sample we examine their UV-NIR images. We compile color composite images of the sources from those available through the Finding Chart section of the SDSS DR7 website, and show these in luminosity order in Figure 8. The zoom on these cutouts is scaled so that each box is 100kpc on a side. At high redshifts and thus high zoom, the image quality of the SDSS charts is low, so for sources with we display stacked images from KPNO when available. A brief description of the galaxy morphologies is presented in Table 5. Many of the higher luminosity sources with log exhibit features suggestive of interactions/mergers, such as multiple cores and/or tidal tails. At luminosities lower than log the large majority of sources appear to be mostly unperturbed spirals. These trends are consistent with previous studies of local samples of LIRGs and ULIRGs (e.g. Sanders & Mirabel, 1996), which have shown that strong interactions and mergers appear responsible for triggering the most luminous infrared sources.
Stellar masses for each of the MIPS-160m sources are listed in Table 5. The masses were computed by fitting the UV-NIR SEDs using Le Phare (Ilbert et al., 2010) and assuming a Chabrier (Chabrier, 2003) initial mass function (IMF). The mass range is log corresponding to . Higher mass systems are more likely to be associated with higher infrared luminosity.
6.2.2 Spectroscopy: Extinction, Abundances and Spectral Types
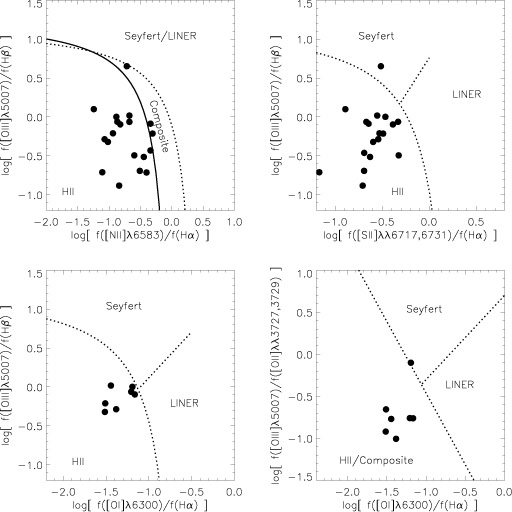
Our high-resolution Keck/ESI spectra, supplemented by SDSS spectra and four low-resolution ESI spectra, allow us to measure robust spectral types for 25 of the 160µm sources in our sample. An example of these spectra was shown in Figure 5. Spectra for the 25 sources with spectral types as well as those from three sources for which we have data but were unable to measure spectral types are available in the online edition of the Journal. After carefully accounting for the effects of stellar absorption and applying an extinction correction (median ), we classify the spectra as H II-region-like, or star-forming (H); composite, or star formation + an AGN (C); Seyfert (S); or LINER (L), based on the classification scheme proposed by Kewley et al. (2006) (see Figure 9). Table 3 lists the measured spectral types and extinctions for each galaxy when they are available.
Dividing the subsample with spectral types into luminosity bins, we find that 15 of 19, (79%), of galaxies in the log bin have H II-region-like spectral type, consistent with star formation as the dominant source of excitation. This is close to the H II-region-like fraction of nearby galaxies selected at 60µm (70% – Veilleux et al., 1995; Yuan et al., 2010). The other four galaxies include one Seyfert and one LINER and 2 objects with mixed types that suggest a “composite” starburst-AGN mixture of excitation. Only six galaxies with high resolution spectroscopy (and hence derived spectral types) have log. Three (3/6 = 50%) have H II-region-like spectral type, one is a Seyfert, one is a Seyfert/LINER, and one is a “composite” mixture of starburst/LINER excitation. Although the fraction of galaxies with H II-region-like spectral types decreases at higher infrared luminosity (similar to what is observed for nearby galaxies selected at 60µm), the number statistics in this high luminosity bin are too low to draw conclusions about the fractions of different spectral types. In an attempt to provide additional information on the spectral types of our high infrared luminosity sources, we have employed a new technique developed from studies of SDSS galaxies (Smolčić et al., 2008) that maps UV/optical continuum colors onto the spectral line diagnostic diagram. This method is described in the Appendix, where the SDSS photometry for all of our MIPS-160m sources is used to derive “P1,P2” photometric spectral types for each source, following the prescription given by Smolčić et al. (2008). These results both confirm the large H II-region-like fraction among the lower luminosity infrared sources, and show that composite and AGN spectral types appear to increase among the highest luminosity sources.
Because our spectra also contain the [O II] 3727, 3729 doublet, we are able to estimate gas-phase oxygen abundances for these systems. Where available, these are listed in Table 5, using the robust [N II]/[O II] diagnostic of Kewley et al. (2002). To put these in context, we also used the measured data to compare to the luminosity-metallicity relation in the NIR (Salzer et al., 2005). For the 8 systems that have sufficient information (upper-branch gas abundances and measured luminosities; see Rupke et al. (2008) for more on the methodology), we find that 5 follow the relation of normal galaxies. Three others have higher luminosities than the data threshold, and appear to be slightly below the relation (by dex), as found for other infrared-selected objects at high luminosity (Rupke et al., 2008).
6.2.3 Radio-FIR Correlation
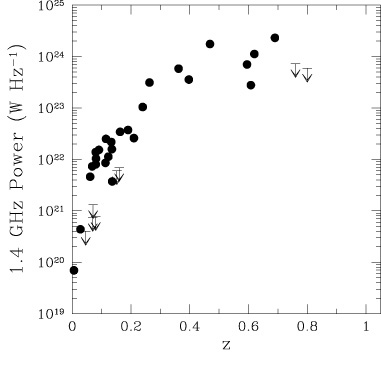
The measured 1.4 GHz radio continuum fluxes are converted to 1.4 GHz radio power assuming a spectral index of 444Spectral index is defined as ., and they are plotted as a function of redshift on the left panel of Figure 10. The observed 1.4 GHz radio power range between and W Hz-1 (see Table 3), similar to the IR-selected galaxies in the local universe studied by Yun et al. (2001b), and none of the sources has sufficient radio power to be classified as a “radio-loud” object. The most luminous infrared sources also tend to be those with the largest radio luminosities, i.e. log, equivalent to the radio powers typically seen among Seyfert galaxies, and thus the presence of a low luminosity AGN cannot be ruled out based on these radio powers alone.
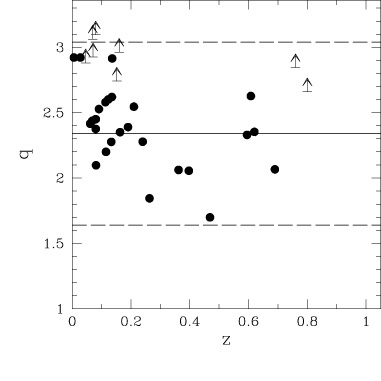
The well-known correlation between the measured infrared luminosity and radio power for star forming galaxies is often quantified using the ratio commonly referred to as “-value”
| (1) |
where FIR is the far-infrared flux density and is in W m-2 Hz-1 (Condon, 1992; Yun et al., 2001b). We computed these -values using the derived above and computed from the best-fit SED models integrated between and 500 µm, where the wavelength range has been chosen to match the original definition of used to compute “”. As shown on the right panel in Figure 10, the derived -values of the LH 160 µm sources fall between 1.6 and 3.0, suggesting that most of these sources follow the same radio-FIR correlation as the local star forming galaxy populations. Some of the low redshift () sources appear to have -values on the high end of the local population. These are also the sources with the largest angular size, and the VLA measurements are likely under-estimates as a consequence. None of the LH 160 µm sources has a -value less than 1.6 and thus a clear evidence for a radio-loud AGN.
7 Summary
We have made use of Spitzer-SWIRE imaging data of two deg2 fields (LHEX and LHNW) in the Lockman Hole,
to identify a complete sample of 40 MIPS-160m selected extragalactic sources, with mJy.
In combination with Keck spectroscopy and photometry from SDSS and 2MASS, we have obtained redshifts and
infrared luminosities, and have attempted to characterize the host galaxy properties for all of the objects in the sample.
The luminosity function for the MIPS-160m sample has been compared with the “local” () luminosity
function of FIR galaxies previously derived using the IRAS all-sky survey.
Our main results can be summarized as follows:
(1) The complete mJy sample contains 40 galaxies with infrared luminosities
in the range log, with a maximum redshift: . The cumulative
source counts down to 120mJy are estimated to be sources sr-1 at 160m.
(2) The luminosity function of the sources with log is similar to that found
previously for infrared galaxies in the IRAS m local galaxy sample.
(3) The co-moving space density of the MIPS-160m galaxies with log
is higher than that for the local infrared galaxies with similar infrared luminosities found in the
IRAS RBGS. Assuming pure number density evolution proportional to , these results give ,
which implies strong evolution of the most luminous infrared sources, in contrast to little or no evolution observed
in the number density of lower luminosity objects with log.
(4) The host galaxy masses for our sample are in the range log (), with evidence for
an increase in host mass from a mean of 10.7 to 11.0 for objects with infrared luminosities below and above log, respectively.
(5) The morphology and spectral types for our flux-limited sample of 160m-selected sources
generally agree with what has been observed locally for 60m-selected samples. At log,
the fraction of disturbed and/or merger systems and the fraction of objects with “composite” and/or AGN spectral types
increases with increasing . At log most objects appear to be either
unperturbed spirals and/or weakly interacting systems with spectral types typical of HII regions.
(6) None of the LH sources has sufficient radio power to be classified as a “radio-loud” object. However, the most luminous infrared sources also tend to have the highest radio luminosities, i.e. log, equivalent to the radio powers typically seen among Seyfert galaxies, and thus the presence of a low luminosity AGN cannot be ruled out based on these radio powers alone.
8 Acknowledgments
We benefited from the published data and preliminary analyses of S. Oyabu. VS acknowledges support from the Owens Valley Radio Observatory, which is supported by the National Science Foundation through grant AST-0838260, and also received funding from the European Union’s Seventh Framework programme under grant agreement 229517. YT was financially supported in part by the Ministry of Education, Culture, Sports, Science and Technology (Nos. 10044052 and 10304013), and by the JSPS (Nos. 15340059, 17253001 and 19340046). This research has made use of the NASA/IPAC Extragalactic Database (NED) which is operated by the Jet Propulsion Laboratory, California Institute of Technology, under contract with the National Aeronautics and Space Administration. This publication makes use of data products from the Two Micron All Sky Survey, which is a joint project of the University of Massachusetts and the Infrared Processing and Analysis Center/California Institute of Technology, funded by the National Aeronautics and Space Administration and the National Science Foundation. Funding for the SDSS and SDSS-II has been provided by the Alfred P. Sloan Foundation, the Participating Institutions, the National Science Foundation, the U.S. Department of Energy, the National Aeronautics and Space Administration, the Japanese Monbukagakusho, the Max Planck Society, and the Higher Education Funding Council for England. The SDSS Web Site is http://www.sdss.org/.
The SDSS is managed by the Astrophysical Research Consortium for the Participating Institutions. The participating institutions are the American Museum of Natural History, Astrophysical Institute Potsdam, University of Basel, University of Cambridge, Case Western Reserve University, University of Chicago, Drexel University, Fermilab, the Institute for Advanced Study, the Japan Participation Group, Johns Hopkins University, the Joint Institute for Nuclear Astrophysics, the Kavli Institute for Particle Astrophysics and Cosmology, the Korean Scientist Group, the Chinese Academy of Sciences (LAMOST), Los Alamos National Laboratory, the Max-Planck-Institute for Astronomy (MPIA), the Max-Planck-Institute for Astrophysics (MPA), New Mexico State University, Ohio State University, University of Pittsburgh, University of Portsmouth, Princeton University, the United States Naval Observatory, and the University of Washington.
Appendix A Using rest-frame colors to assign galaxy types
In an attempt to determine the spectral type of the 12 galaxies in our sample for which we lack optical spectra, we make use of a photometric (rest-frame color based) method extensively studied in Smolčić et al. (2008). Smolčić et al. (2006) have shown that principal component rest-frame colors (P1 and P2 hereafter) drawn from the modified Strömgren photometric system (3500–5800 Å; Odell et al. 2002) essentially trace the position of a galaxy in the BPT diagram (Baldwin, Phillips & Terlevich, 1981; Kewley et al., 2001, 2006; Kauffmann et al., 2003). Hence, they can be used as efficient tracers of galaxy type, such as low-luminosity AGN (Seyfert and LINER), star forming, and composite galaxies (see Smolčić et al. 2006, 2008 for more details). Here we extend the method developed by Smolčić et al. (2008), that utilizes only the P1 color to disentangle star forming from AGN galaxies, to a probabilistic approach that uses both, P1 and P2 colors, and we adapt it to an IR- (rather than radio-) selected sample.
A.1 Derivation of P1, P2 colors
Given that we have SDSS ugriz photometry for the complete MIPS-160m sample, we derive the P1 and P2 colors for all 40 galaxies in our sample by fitting their SEDs (encompassed by the SDSS ugriz photometry) with 100,000 spectra from the Bruzual & Charlot (2003) stellar population synthesis model library. Before performing the minimization fit we redshift all the model spectra to the galaxy’s spectroscopic redshift. The colors are then computed from the best fit model spectrum (see Sec. 4.2. in Smolčić et al. 2008 for more details about the SED fitting).
To assess the accuracy of photometrically synthesized colors for IR-selected galaxies, we have derived the (P1,P2) colors via SED fitting (in the same way as described above) for an IR-selected control sample with available (P1,P2) colors computed independently from their spectra. The control sample, limited to a redshift range of 0.04 to 0.3, contains galaxies drawn from the SDSS DR1 “main” spectroscopic galaxy sample matched to the IRAS Faint Source Catalog (see Obrić et al. 2006 for details about the cross-correlation of the catalogs). The spectroscopically derived (P1,P2) colors have been synthesized by Smolčić et al. (2006) by convolving the SDSS high-resolution spectra with the Strömgren filter system. They estimated that these spectroscopically derived rest-frame colors are accurate to mag.
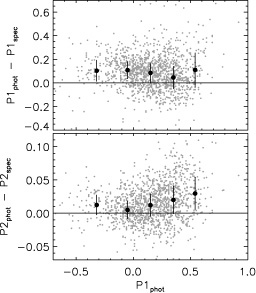
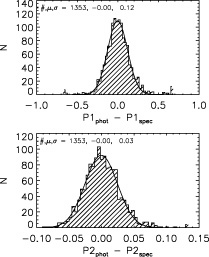
In Figure 11 we show the difference between the photometrically and spectroscopically derived (P1,P2) colors for our IR-selected control galaxies as a function of the photometrically derived P1 color. We use the median offset as a function of P1 to correct the photometrically derived colors, i.e. to scale these to the SDSS spectroscopic system. The distribution of the (P1,P2) color differences after the corrections have been applied are shown in Figure 12. As expected, the corrections have eliminated systematic effects. Furthermore, as the accuracy of the spectroscopically derived colors has been shown to be mag (Smolčić et al., 2006), the accuracy of the photometrically derived (P1,P2) colors is likely better than and , respectively. It is remarkable that the accuracy of the P2 color derived via SED fitting is comparable to that of the spectroscopically derived color.
A.2 Classifying the Lockman galaxies using the P1-P2 color method
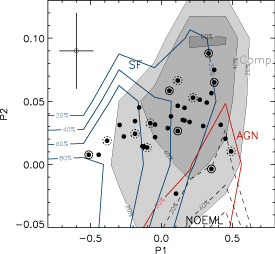
In Figure 13 we show the P1 vs. P2 the distribution for our 40 galaxies in our MIPS-160m sample (their P1,P2 colors were corrected for systematic offsets as described in the previous section; filled dots). To assess the nature of these 40 galaxies for each one we compute the probability that it is a star forming, composite, AGN or absorption galaxy given its (P1,P2) rest-frame colors. The probability is computed based on the underlying distribution of our control (SDSS-IRAS; ) galaxies (spectroscopically divided into absorption, star forming, AGN and composite galaxies using the standard diagnostics; Baldwin, Phillips & Terlevich 1981; Kewley et al. 2001; Kauffmann et al. 2003) in the P1-P2 plane as follows. We bin the P1-P2 plane in 2 dimensions. The size of the bins is taken to be about 2 times the photometric color uncertainty (see previous section). For each (P1,P2) bin we then calculate the probability as the ratio of the number of each (spectroscopically classified) galaxy type relative to the total number of control galaxies in that bin. Given the photometrically synthesized (P1,P2) colors for our Lockman galaxies we can then access the probability of each galaxy being a star forming, AGN, composite or absorption galaxy. These probability contours are shown in Figure 13, and our results are summarized in Table 6.
References
- Adelman-McCarthy et al. (2007) Adelman-McCarthy, J. K., et al. 2007, ApJS, 172, 634
- Baldwin, Phillips & Terlevich (1981) Baldwin, J. A., Phillips, M. M., & Terlevich, R. 1981, PASP, 93, 5
- Barger et al. (1998) Barger, A. J., Cowie, L. L., Sanders, D. B., Fulton, E., Taniguchi, Y., Sato, Y., Kawara, K., & Okuda, H. 1998, Nature, 394, 248
- Beichman et al. (1988) Beichman, C. A., Neugebauer, G., Habing, H. J., Clegg, P. E., & Chester, T. J. 1988, Infrared Astronomical Satellite (IRAS) Catalogs and Atlases, Vol. 1: Explanatory Supplement (Washington, DC: GPO) 1
- Bruzual & Charlot (2003) Bruzual, G., & Charlot, S. 2003, MNRAS, 344, 1000
- Chabrier (2003) Chabrier, G. 2003, PASP, 115, 763
- Chapman et al. (2005) Chapman, S. C., Blain, A. W., Smail, I., Ivison, R. J. 2005, ApJ, 622, 772
- Chary & Elbaz (2001) Chary, R. & Elbaz, D. 2001, ApJ, 556, 562
- Condon (1992) Condon, J. J. 1992, ARA&A, 30, 575
- Dale & Helou (2002) Dale, D. A. & Helou, G. 2002, ApJ, 576, 159
- Dye et al. (2010) Dye, S. et al. 2010, A&A, 518, L10
- Hasinger et al. (1998) Hasinger, G., Burg, R., Giacconi, R., Schmidt, M., Trumper, J., & Zamorani, G. 1998, A&A, 329, 482
- Hughes et al. (1998) Hughes, D., et al. 1998, Nature, 394, 241
- Ilbert et al. (2009) Ilbert, O, et al. 2009, ApJ, 690, 1236
- Ilbert et al. (2010) Ilbert, O, et al. 2010, ApJ, 709, 644
- Kauffmann et al. (2003) Kauffmann, G., et al. 2003, MNRAS, 341, 33
- Kawara et al. (1998) Kawara, K., et al. 1998, A&A, 336, L9
- Kawara et al. (2004) Kawara, K., et al. 2004, A&A, 413, 843
- Kewley et al. (2001) Kewley, L. J., Dopita, M. A., Sutherland, R. S., Heisler, C. A., & Trevena, J. 2001, ApJ, 556, 121
- Kewley et al. (2002) Kewley, L. J., & Dopita, M. A. 2002, ApJS, 142, 35
- Kewley et al. (2006) Kewley, L. J., Groves, B., Kauffmann, G., & Heckman, T. 2006, MNRAS, 372, 961
- Kim & Sanders (1998) Kim, D.-C. & Sanders, D. B. 1998, ApJS, 119, 41
- Lilly et al. (1999) Lilly, S. J., Eales, S. A., Gear, W. K. P., Hammer, F., Le Fevre, O., Crampton, D., Bond, J. R., & Dunne, L. 1998, ApJ, 518, 641
- Lockman et al. (1986) Lockman, F. J., Jahoda, K. & McCammon, D. 1986, ApJ, 302, 432
- Lonsdale et al. (2003) Lonsdale, C. J., et al. 2003, PASP, 115, 897
- Obrić et al. (2006) Obrić, M., et al. 2006, MNRAS, 370, 1677
- Odell et al. (2002) Odell, A. P., Schombert, J., & Rakos, K. 2002, AJ, 124, 3061
- Oyabu et al. (2005) Oyabu, S., et al. 2005, AJ, 130, 2019
- Rupke et al. (2008) Rupke, D. S. N., Veilleux, S., & Baker, A. J. 2008, ApJ, 674, 172
- Salzer et al. (2005) Salzer, J. J., Lee, J. C., Melbourne, J., Hinz, J. L., Alonso-Herrero, A., & Jangren, A. 2005, ApJ, 624, 661
- Sanders & Mirabel (1996) Sanders, D. B., & Mirabel, I. F. 1996, ARAA, 34, 749
- Sanders et al. (2001) Sanders, D. B., et al. 2001, in Springer Proc. Phys. 88, Starburst Galaxies: Near and Far, ed. L. Tacconi & D. Lutz (Heidelberg: Springer-Verlag) 297
- Sanders et al. (2003) Sanders, D. B., Mazzarella, J. M., Kim, D.-C., Surace, J. A., & Soifer, B. T. 2003, AJ, 126, 1607 (RBGS)
- Schmidt (1968) Schmidt, M. 1968, ApJ, 151, 393
- Sheinis et al. (2000) Sheinis, A. I., Miller, J. S., Bolte, M., & Sutin, B. M. 2000, Proc. SPIE, 4008, 522
- Scoville et al. (2007) Scoville, N. Z., et al. 2007, ApJS, 172, 1
- Siebenmorgen & Krugel (2007) Siebenmorgen, R., & Krugel, E. 2007, A&A, 461, 445
- Skrutskie et al. (2006) Skrutskie, M. F. et al., 2006, AJ, 131, 1163
- Smail et al. (1997) Smail, I., Ivison, R. J., & Blain, A. W. 1997, ApJL, 490, L5
- Smolčić et al. (2006) Smolčić, V., et al. 2006, MNRAS, 371, 121
- Smolčić et al. (2008) Smolčić, V., et al. 2008, ApJS, 177, 14
- Soifer et al. (1989) Soifer, B.T., Boehmer, L., Neugebauer, G, & Sanders, D.B. 1989, AJ, 98, 766 (BGS)
- Symeonidis et al. (2008) Symeonidis, M., Willner, S. P., Rigopoulou, D., Huang, J.-S., Fazio, G. G., & Jarvis, M. J. 2008, MNRAS, 385, 1015
- Taniguchi et al. (1997) Taniguchi, Y. et al. 1997, A&A, 328, L9
- Veilleux et al. (1995) Veilleux, S., Kim, D.-C., Sanders, D. B., Mazzarella, J. M., & Soifer, B. T. 1995, ApJS, 98, 171
- York et al. (2000) York, D .G., et al. 2000, AJ, 120, 1579
- Yuan et al. (2010) Yuan, T., Kewley, L. J. & Sanders, D. B. 2010, ApJ, 709, 884
- Yun et al. (2001) Yun, M. S., Sanders, D., Kawara, K., Oyabu, S., Taniguchi, Y., & Okuda, H. 2001a, in ASP Conf. Proc. 240, Gas and Galaxy Evolution, ed. J. E. Hibbard, M. Rupen, & J. H. van Gorkom (San Francisco, CA: ASP), 123
- Yun et al. (2001b) Yun, M. S., Reddy, N. A., & Condon, J. J. 2001b, ApJ, 554, 803
- Yun et al. (2003) Yun, M. S., Oyabu, S., Kawara, K., Okuda, H., Sanders, D., Veilleux, S., Murayama, T., & Taniguchi, Y. 2003, RMxAC, 17, 271
|
![[Uncaptioned image]](/html/1101.5204/assets/fig6b.jpg)
Figure 6 (Continued).
| J105308.32570645.6, (12.74) | J103538.8573546*, (12.66) | J103341.28580221.4*, (12.62) | J103314.8573110*, (12.48) |
 |
 |
 |
 |
| J103237.44580845.9, (12.28) | J103526.79575147.6*, (12.25) | J103603.97574812.5*, (12.20) | J105151.64570935.7*, (12.12) |
 |
 |
 |
 |
| J103358.9572952*, (12.04) | J103557.1572234, (11.92) | J105113.41571425.9*, (11.90) | J105056.60571631.2*, (11.69) |
 |
 |
 |
 |
| J103358.73574317.1, (11.46) | J103320.32574913.6, (11.37) | J105242.40572444.7, (11.05) | J105314.84574137.6, (11.04) |
 |
 |
 |
 |
| J105252.76570753.7, (10.99) | J104948.86573458.2, (10.89) | J103515.83573337.4, (10.87) | J105041.96570706.7, (10.76) |
 |
 |
 |
 |
| J105207.16570745.5, (10.73) | J105318.94572140.7, (10.70) | J103249.4573707, (10.67) | J105301.36570543.1, (10.64) |
![[Uncaptioned image]](/html/1101.5204/assets/fig8_21.jpg) |
![[Uncaptioned image]](/html/1101.5204/assets/fig8_22.jpg) |
![[Uncaptioned image]](/html/1101.5204/assets/fig8_23.jpg) |
![[Uncaptioned image]](/html/1101.5204/assets/fig8_24.jpg) |
| J103327.90574534.4, (10.60) | J103539.24574243.9, (10.58) | J105150.50573905.7, (10.56) | J103653.50575442.5, (10.46) |
![[Uncaptioned image]](/html/1101.5204/assets/fig8_25.jpg) |
![[Uncaptioned image]](/html/1101.5204/assets/fig8_26.jpg) |
![[Uncaptioned image]](/html/1101.5204/assets/fig8_27.jpg) |
![[Uncaptioned image]](/html/1101.5204/assets/fig8_28.jpg) |
| J105432.31570932.4, (10.44) | J105256.85570825.6, (10.40) | J105143.75572936.9, (10.18) | J103253.94580633.0, (10.17) |
![[Uncaptioned image]](/html/1101.5204/assets/fig8_29.jpg) |
![[Uncaptioned image]](/html/1101.5204/assets/fig8_30.jpg) |
![[Uncaptioned image]](/html/1101.5204/assets/fig8_31.jpg) |
![[Uncaptioned image]](/html/1101.5204/assets/fig8_32.jpg) |
| J105225.75570153.6, (10.16) | J105100.42574114.9, (10.12) | J105320.92571433.2, (10.03) | J104956.06571440.4, (9.98) |
![[Uncaptioned image]](/html/1101.5204/assets/fig8_33.jpg) |
![[Uncaptioned image]](/html/1101.5204/assets/fig8_34.jpg) |
![[Uncaptioned image]](/html/1101.5204/assets/fig8_35.jpg) |
![[Uncaptioned image]](/html/1101.5204/assets/fig8_36.jpg) |
| J103606.48574702.4, (9.95) | J105052.41573506.9, (9.64) | J103258.0573105, (9.55) | J105349.60570708.1, (8.81) |
![[Uncaptioned image]](/html/1101.5204/assets/fig8_37.jpg) |
![[Uncaptioned image]](/html/1101.5204/assets/fig8_38.jpg) |
![[Uncaptioned image]](/html/1101.5204/assets/fig8_39.jpg) |
![[Uncaptioned image]](/html/1101.5204/assets/fig8_40.jpg) |
Figure 8 (Continued).
|
| # | Source | RA | DEC | 160 | 70 | 24 | IRAC+24 | NIR | Optical | C_90 | C_160 |
|---|---|---|---|---|---|---|---|---|---|---|---|
| (SWIRE ID11SWIRE2_24_J103249.4573707, J103258.0573105, J103314.8573110, J103358.9572952, J103538.8573546, and J103557.1572234 lack entries in the SWIRE IRAC+24 catalog so their RA, DEC and 24 flux are taken from the independent SWIRE 24 catalog) | (J2000) | (J2000) | (SWIRE IDs) | (2MASS ID22Preceding the 2MASS source designation are the reference catalog abbreviations, PSC for the 2MASS Point Source Catalog, and XSC for the Extended Source Catalog. Values from the XSC are preferred when available.) | (SDSS ID) | (ISO ID) | |||||
| 1 | SWIRE3_J103237.44580845.9 | 10 32 37.45 | 58 08 46.0 | 797 | 1989 | 620978 | PSC:10323767+5808446 | 587729388220776605 | |||
| 2 | SWIRE2_24_J103249.4573707 | 10 32 49.48 | 57 37 07.8 | 938 | 2338 | 3313 | PSC:10324949+5737081 | 587729387683840107 | 1NW192 | 2NW003 | |
| 3 | SWIRE3_J103253.94580633.0 | 10 32 53.95 | 58 06 33.1 | 804 | 2006 | 620883 | PSC:10325395+5806333 | 587729388220776539 | |||
| 4 | SWIRE2_24_J103258.0573105 | 10 32 58.02 | 57 31 05.3 | 974 | 2395 | XSC:10325794+5731068 | 587732582590513271 | ||||
| 5 | SWIRE2_24_J103314.8573110 | 10 33 14.88 | 57 31 10.5 | 964 | 2385 | 2684 | 587732582590513949 | ||||
| 6 | SWIRE3_J103320.32574913.6 | 10 33 20.33 | 57 49 13.6 | 868 | 2177 | 463679 | 587732583127449867 | 1NW021 | 2NW005 | ||
| 7 | SWIRE3_J103327.90574534.4 | 10 33 27.91 | 57 45 34.5 | 887 | 462097 | XSC:10332785+5745351 | 587729387683905620 | ||||
| 8 | SWIRE3_J103341.28580221.4 | 10 33 41.29 | 58 02 21.4 | 805 | 2013 | 472711 | 587732583127515249 | 2NW004 | |||
| 9 | SWIRE3_J103358.73574317.1 | 10 33 58.73 | 57 43 17.2 | 891 | 2211 | 462979 | XSC:10335869+5743169 | 587729387683905627 | 1NW030 | ||
| 10 | SWIRE2_24_J103358.9572952 | 10 33 58.92 | 57 29 52.3 | 945 | 2356 | 3540 | 587732582590578995 | 1NW272 | 2NW009 | ||
| 11 | SWIRE3_J103515.83573337.4 | 10 35 15.84 | 57 33 37.5 | 903 | 2253 | 462870 | XSC:10351578+5733375 | 587732582590644271 | |||
| 12 | SWIRE3_J103526.79575147.6 | 10 35 26.80 | 57 51 47.6 | 807 | 2034 | 473946 | 587729387683971243 | ||||
| 13 | SWIRE2_24_J103538.8573546 | 10 35 38.87 | 57 35 46.1 | 884 | 2209 | 7870 | 587732582590644410 | ||||
| 14 | SWIRE3_J103539.24574243.9 | 10 35 39.24 | 57 42 43.9 | 851 | 2117 | 469789 | XSC:10353919+5742444 | 587732582590644435 | |||
| 15 | SWIRE2_24_J103557.1572234 | 10 35 57.12 | 57 22 34.1 | 941 | 2340 | 5113 | PSC:10355706+5722341 | 587729387147100345 | |||
| 16 | SWIRE3_J103603.97574812.5 | 10 36 03.97 | 57 48 12.6 | 811 | 2038 | 474542 | 587729387684036627 | 1NW092 | |||
| 17 | SWIRE3_J103606.48574702.4 | 10 36 06.48 | 57 47 02.5 | 812 | 2052 | 474042 | PSC:10360650+5747024 | 587729387684036713 | 1NW023 | ||
| 18 | SWIRE3_J103653.50575442.5 | 10 36 53.50 | 57 54 42.6 | 773 | 1935 | 481645 | PSC:10365355+5754426 | 587729387684102266 | |||
| 19 | SWIRE3_J104948.86573458.2 | 10 49 48.87 | 57 34 58.3 | 558 | 1482 | 228325 | XSC:10494884+5734579 | 587729386611015724 | |||
| 20 | SWIRE3_J104956.06571440.4 | 10 49 56.07 | 57 14 40.5 | 652 | 216021 | 587729386074079354 | |||||
| 21 | SWIRE3_J105041.96570706.7 | 10 50 41.96 | 57 07 06.8 | 673 | 1741 | 215353 | XSC:10504192+5707064 | 587732580980818115 | 1EX048 | 2EX004 | |
| 22 | SWIRE3_J105052.41573506.9 | 10 50 52.41 | 57 35 07.0 | 534 | 1401 | 233199 | XSC:10505236+5735064 | 587732581517754577 | 1EX041 | 2EX013 | |
| 23 | SWIRE3_J105056.60571631.2 | 10 50 56.60 | 57 16 31.2 | 625 | 1638 | 222478 | 587729386074145329 | 1EX085 | 2EX068 | ||
| 24 | SWIRE3_J105100.42574114.9 | 10 51 00.43 | 57 41 15.0 | 512 | 1338 | 237144 | XSC:10510035+5741153 | 587729386611081359 | |||
| 25 | SWIRE3_J105113.41571425.9 | 10 51 13.41 | 57 14 26.0 | 617 | 1642 | 222633 | 587729386074145391 | 1EX081 | 2EX115 | ||
| 26 | SWIRE3_J105143.75572936.9 | 10 51 43.75 | 57 29 36.9 | 544 | 1420 | 234071 | XSC:10514374+5729367 | 587732581517754609 | |||
| 27 | SWIRE3_J105150.50573905.7 | 10 51 50.51 | 57 39 05.7 | 499 | 239860 | PSC:10515055+5739054 | 587729386611146842 | ||||
| 28 | SWIRE3_J105151.64570935.7 | 10 51 51.64 | 57 09 35.7 | 634 | 72224 | 587732580980883908 | 1EX047 | 2EX036 | |||
| 29 | SWIRE3_J105207.16570745.5 | 10 52 07.16 | 57 07 45.6 | 635 | 1667 | 72439 | XSC:10520715+5707445 | 587732580980883557 | 1EX034 | 2EX016 | |
| 30 | SWIRE3_J105225.75570153.6 | 10 52 25.76 | 57 01 53.7 | 653 | 1703 | 70615 | PSC:10522572+5701537 | 587732580980883560 | |||
| 31 | SWIRE3_J105242.40572444.7 | 10 52 42.40 | 57 24 44.8 | 542 | 1413 | 235900 | PSC:10524240+5724447 | 587729386074276002 | |||
| 32 | SWIRE3_J105252.76570753.733SWIRE3_J105252.76570753.7 was not included in the SWIRE 160µm catalog, but was visible in the image, and detected by ISO so we independently measure its flux by hand. | 10 52 52.77 | 57 07 53.8 | 1607 | 76811 | XSC:10525283+5707537 | 587732580980949106 | 1EX028 | |||
| 33 | SWIRE3_J105256.85570825.6 | 10 52 56.85 | 57 08 25.7 | 603 | 1606 | 77421 | XSC:10525689+5708257 | 587732580980949119 | 1EX269 | 2EX047 | |
| 34 | SWIRE3_J105301.36570543.1 | 10 53 01.36 | 57 05 43.2 | 611 | 1629 | 76215 | PSC:10530133+5705433 | 587732580980949116 | 1EX062 | ||
| 35 | SWIRE3_J105308.32570645.6 | 10 53 08.32 | 57 06 45.6 | 610 | 77408 | 587732580980949913 | |||||
| 36 | SWIRE3_J105314.84574137.6 | 10 53 14.85 | 57 41 37.7 | 447 | 1202 | 247971 | 587732581517885646 | ||||
| 37 | SWIRE3_J105318.94572140.7 | 10 53 18.94 | 57 21 40.7 | 538 | 1407 | 86339 | PSC:10531899+5721394 | 587729386074276027 | 1EX179 | ||
| 38 | SWIRE3_J105320.92571433.2 | 10 53 20.92 | 57 14 33.3 | 568 | 1498 | 82519 | XSC:10532085+5714338 | 587732580980949157 | 1EX126 | ||
| 39 | SWIRE3_J105349.60570708.1 | 10 53 49.60 | 57 07 08.1 | 582 | 1562 | 80766 | XSC:10534950+5707075 | 587732580980949076 | |||
| 40 | SWIRE3_J105432.31570932.4 | 10 54 32.31 | 57 09 32.5 | 559 | 1478 | 85419 | XSC:10543226+5709324 | 587732580981014580 | |||
Note. — Sources in the LHNW and LHEX fields. The columns list a counter number, SWIRE Source ID, right ascension and declination (HH MM SS.SS and DD MM SS.S) taken from from the SWIRE IRAC+24 when available, ID counter numbers from the SWIRE 160, 70, 24, and IRAC+24 catalogs, 2MASS source designation and catalog, object ID from SDSS, and the ISO-LH 90m and 160 source ID from Oyabu et al. (2005).
| # | Source | 20cm | 160m | 70m | 24m | 8m | 5.8m | 4.5m | 3.6m | |||||||||||
|---|---|---|---|---|---|---|---|---|---|---|---|---|---|---|---|---|---|---|---|---|
| (SWIRE ID) | (mJy) | (mag) | ||||||||||||||||||
| 1 | SWIRE3_J103237.44580845.9 | 390 | 117 | 6.17 | 2.051 | 0.409 | 0.437 | 0.401 | 17.13 | 17.09 | 18.32 | 18.02 | 18.43 | 18.95 | 20.07 | 21.33 | ||||
| 2 | SWIRE2_24_J103249.4573707 | 0.638 | 193 | 52.7 | 3.26 | 0.641 | 0.931 | 16.72 | 16.67 | 17.17 | 16.79 | 17.05 | 17.47 | 18.22 | 19.57 | |||||
| 3 | SWIRE3_J103253.94580633.0 | 142 | 45.1 | 3.96 | 4.067 | 0.697 | 0.550 | 0.785 | 17.12 | 16.82 | 17.15 | 16.44 | 16.61 | 16.93 | 17.39 | 18.50 | ||||
| 4 | SWIRE2_24_J103258.0573105 | 124 | 18.6 | 2.23 | 15.27 | 14.80 | 15.27 | 15.32 | 15.61 | 15.99 | 16.65 | 18.10 | ||||||||
| 5 | SWIRE2_24_J103314.8573110 | 150 | 18.9 | 0.84 | —– | —– | —– | 20.55 | 21.22 | 22.44 | 23.37 | 23.07 | ||||||||
| 6 | SWIRE3_J103320.32574913.6 | 0.437 | 176 | 50.3 | 3.65 | 1.899 | 0.243 | 0.357 | 0.324 | —– | —– | —– | 18.53 | 18.97 | 19.83 | 18.45 | 18.71 | 19.16 | 19.90 | 20.85 |
| 7 | SWIRE3_J103327.90574534.4 | 122 | 12.5 | 1.97 | 2.014 | 0.272 | 0.610 | 0.800 | 16.31 | 16.01 | 15.98 | 16.88 | 17.12 | 17.90 | 16.20 | 16.48 | 16.88 | 17.65 | 18.91 | |
| 8 | SWIRE3_J103341.28580221.4 | 0.315 | 242 | 108 | 4.79 | 2.976 | 0.292 | 0.515 | 0.567 | —– | —– | —– | 17.90 | 18.35 | 18.88 | 20.99 | 21.66 | 21.16 | 22.70 | 22.38 |
| 9 | SWIRE3_J103358.73574317.1 | 1.027 | 144 | 45.9 | 4.18 | 2.093 | 0.572 | 0.942 | 1.088 | 15.44 | 16.01 | 16.24 | 17.03 | 17.48 | 18.61 | 16.48 | 16.89 | 17.38 | 18.46 | 19.70 |
| 10 | SWIRE2_24_J103358.9572952 | 1.146 | 185 | 55.7 | 1.83 | 0.088 | 0.124 | —– | —– | —– | 19.69 | 20.36 | 21.00 | 22.38 | 24.18 | |||||
| 11 | SWIRE3_J103515.83573337.4 | 153 | 25.3 | 2.42 | 2.875 | 0.879 | 1.144 | 1.714 | 15.20 | 15.25 | 15.52 | 16.88 | 17.15 | 17.95 | 16.81 | 16.36 | 16.71 | 17.61 | 20.05 | |
| 12 | SWIRE3_J103526.79575147.6 | 0.224 | 139 | 26.3 | 2.01 | 0.183 | 0.155 | 0.111 | 0.159 | —– | —– | —– | 19.85 | 20.38 | 21.57 | 19.67 | 20.13 | 20.86 | 22.12 | 23.82 |
| 13 | SWIRE2_24_J103538.8573546 | 0.465 | 199 | 62.9 | 14.8 | —– | —– | —– | 17.20 | 17.32 | 18.38 | 19.23 | 21.51 | |||||||
| 14 | SWIRE3_J103539.24574243.9 | 0.227 | 150 | 37.4 | 3.04 | 3.130 | 1.001 | 1.171 | 1.645 | 15.12 | 15.36 | 15.57 | 16.05 | 16.46 | 17.30 | 15.85 | 16.16 | 16.59 | 17.43 | 18.94 |
| 15 | SWIRE2_24_J103557.1572234 | 156 | 24.4 | 2.41 | 0.600 | 1.129 | 16.73 | 16.59 | 17.16 | 16.88 | 17.34 | 17.95 | 19.19 | 20.88 | ||||||
| 16 | SWIRE3_J103603.97574812.5 | 172 | 75.5 | 4.26 | 0.507 | 0.210 | 0.147 | 0.136 | —– | —– | —– | 19.42 | 19.74 | 20.30 | 19.36 | 19.42 | 19.68 | 20.24 | 20.51 | |
| 17 | SWIRE3_J103606.48574702.4 | 220 | 91.3 | 6.65 | 5.419 | 1.384 | 0.619 | 0.898 | 16.90 | 17.27 | 17.39 | 16.79 | 17.03 | 17.44 | 16.53 | 16.76 | 17.08 | 17.51 | 18.53 | |
| 18 | SWIRE3_J103653.50575442.5 | 137 | 62.3 | 5.17 | 3.985 | 0.434 | 0.455 | 0.664 | 17.35 | 17.30 | 17.46 | 17.12 | 17.41 | 17.98 | 16.88 | 17.06 | 17.42 | 17.96 | 19.03 | |
| 19 | SWIRE3_J104948.86573458.2 | 0.276 | 242 | 45.9 | 3.77 | 3.756 | 0.730 | 0.915 | 1.200 | 15.89 | 15.53 | 16.09 | 17.15 | 17.63 | 18.52 | 16.48 | 16.88 | 17.42 | 18.46 | 20.21 |
| 20 | SWIRE3_J104956.06571440.4 | 126 | 14.0 | 1.48 | 1.830 | 0.213 | 0.374 | 0.501 | —– | —– | —– | 17.43 | 17.78 | 18.49 | 17.08 | 17.38 | 17.79 | 18.54 | 19.84 | |
| 21 | SWIRE3_J105041.96570706.7 | 0.669 | 362 | 75.2 | 5.30 | 7.510 | 1.552 | 1.587 | 2.330 | 14.84 | 14.84 | 15.36 | 16.10 | 16.46 | 17.37 | 15.77 | 16.15 | 16.64 | 17.59 | 19.44 |
| 22 | SWIRE3_J105052.41573506.9 | 0.245 | 288 | 106 | 7.97 | 7.632 | 3.171 | 2.581 | 4.199 | 14.22 | 14.02 | 14.35 | 14.99 | 15.32 | 16.11 | 14.69 | 15.03 | 15.45 | 16.24 | 17.83 |
| 23 | SWIRE3_J105056.60571631.2 | 0.379 | 124 | 39.8 | 2.10 | 0.639 | 0.142 | 0.131 | 0.124 | —– | —– | —– | 20.15 | 20.37 | 21.71 | 19.77 | 20.20 | 20.53 | 21.73 | 22.00 |
| 24 | SWIRE3_J105100.42574114.9 | 174 | 29.1 | 3.00 | 4.375 | 0.795 | 0.879 | 1.298 | 15.40 | 15.09 | 15.75 | 15.88 | 16.11 | 16.66 | 15.78 | 15.99 | 16.31 | 16.87 | 18.14 | |
| 25 | SWIRE3_J105113.41571425.9 | 0.802 | 250 | 37.4 | 2.95 | 0.313 | 0.295 | 0.370 | 0.414 | —– | —– | —– | 19.48 | 20.09 | 21.71 | 19.03 | 19.51 | 20.15 | 21.84 | 26.13 |
| 26 | SWIRE3_J105143.75572936.9 | 0.588 | 121 | 26.9 | 2.68 | 4.030 | 1.009 | 1.146 | 1.725 | 15.05 | 14.86 | 15.53 | 16.03 | 16.47 | 17.15 | 15.52 | 15.86 | 16.34 | 17.16 | 18.89 |
| 27 | SWIRE3_J105150.50573905.7 | 0.064 | 139 | 16.4 | 1.82 | 1.918 | 0.296 | 0.531 | 0.747 | 17.19 | 17.13 | 17.25 | 16.94 | 17.34 | 18.22 | 16.73 | 17.07 | 17.53 | 18.41 | 19.99 |
| 28 | SWIRE3_J105151.64570935.7 | 0.083 | 140 | 16.1 | 1.06 | 0.106 | 0.078 | 0.100 | —– | —– | —– | 20.40 | 20.90 | 22.15 | 20.32 | 20.53 | 21.10 | 22.42 | 22.68 | |
| 29 | SWIRE3_J105207.16570745.5 | 0.246 | 202 | 34.6 | 3.37 | 3.563 | 0.314 | 0.524 | 0.715 | 15.87 | 16.81 | 16.20 | 16.66 | 16.86 | 17.24 | 17.86 | 19.06 | |||
| 30 | SWIRE3_J105225.75570153.6 | 0.490 | 213 | 77.3 | 5.85 | 4.769 | 0.901 | 0.615 | 0.885 | 16.52 | 17.22 | 17.24 | 16.24 | 16.30 | 16.55 | 16.86 | 17.87 | |||
| 31 | SWIRE3_J105242.40572444.7 | 0.283 | 147 | 41.3 | 3.47 | 3.711 | 0.517 | 0.420 | 0.625 | 16.98 | 16.59 | 17.23 | 16.79 | 16.94 | 17.26 | 17.78 | 18.90 | |||
| 32 | SWIRE3_J105252.76570753.7 | 0.381 | 149 | 45.4 | 4.34 | 2.048 | 0.399 | 0.611 | 0.781 | 15.86 | 16.05 | 16.31 | 16.69 | 16.99 | 17.47 | 18.36 | 19.84 | |||
| 33 | SWIRE3_J105256.85570825.6 | 0.467 | 266 | 74.1 | 3.15 | 3.070 | 0.702 | 0.847 | 1.212 | 15.54 | 15.51 | 15.77 | 16.17 | 16.55 | 17.03 | 17.92 | 19.73 | |||
| 34 | SWIRE3_J105301.36570543.1 | 0.809 | 249 | 142 | 11.7 | 8.517 | 1.159 | 0.817 | 1.176 | 16.51 | 16.32 | 16.48 | 16.35 | 16.54 | 17.00 | 17.59 | 18.93 | |||
| 35 | SWIRE3_J105308.32570645.6 | 142 | 15.5 | 0.51 | 0.072 | 0.092 | 0.084 | 0.118 | —– | —– | —– | 20.48 | 21.16 | 22.68 | 23.15 | 24.97 | ||||
| 36 | SWIRE3_J105314.84574137.6 | 0.153 | 131 | 39.1 | 1.58 | 0.810 | 0.140 | 0.189 | 0.232 | —– | —– | —– | 18.11 | 18.34 | 19.07 | 18.05 | 18.18 | 18.52 | 19.24 | 20.19 |
| 37 | SWIRE3_J105318.94572140.7 | 0.394 | 156 | 36.1 | 3.75 | 3.338 | 0.464 | 0.505 | 0.713 | 17.33 | 17.35 | 17.55 | 16.64 | 16.91 | 17.27 | 17.88 | 18.91 | |||
| 38 | SWIRE3_J105320.92571433.2 | 144 | 21.6 | 1.19 | 1.863 | 1.392 | 2.110 | 3.230 | 14.37 | 14.30 | 14.72 | 14.75 | 15.13 | 15.61 | 16.59 | 18.50 | ||||
| 39 | SWIRE3_J105349.60570708.1 | 0.911 | 1087 | 379 | 19.8 | 12.89 | 6.983 | 5.458 | 8.529 | 13.52 | 13.13 | 13.21 | 13.76 | 13.83 | 14.03 | 15.28 | 16.25 | |||
| 40 | SWIRE3_J105432.31570932.4 | 0.614 | 195 | 129 | 11.4 | 6.200 | 1.518 | 1.569 | 2.426 | 14.90 | 14.82 | 14.84 | 15.23 | 15.52 | 15.93 | 16.69 | 18.15 | |||
Note. — Source photometry in the LHNW and LHEX fields listed in order of right ascension. The columns list a counter number, the source ID, the 20 cm VLA flux, the flux in the Spitzer wavelengths in mJy, and 2MASS -bands, SWIRE -bands and SDSS -bands in AB magnitudes. Sources without listed values (…) in Spitzer-IRAC and/or the SWIRE/NOAO -bands were typically located on the edge of the LHNW field not covered by SWIRE (see Figure 1). Sources without 2MASS photometry (—–) were not found in the 2MASS photometry catalog.
| # | Source | -Ref. | log | log | |
|---|---|---|---|---|---|
| (W Hz-1) | |||||
| 1 | SWIRE3_J103237.44580845.9**Sources without existing optical spectra, for which we have determined photometric redshifts (see text and Figure 6). The computed phot-z value, and 68% uncertainty is listed. This uncertainty was propagated when computing the listed infrared luminosity. | Phot-z | |||
| 2 | SWIRE2_24_J103249.4573707 | 0.115 | ESI/ech | 10.67 | 22.40 |
| 3 | SWIRE3_J103253.94580633.0 | 0.073 | SDSS | 10.17 | |
| 4 | SWIRE2_24_J103258.0573105 | 0.046 | SDSS | 9.55 | |
| 5 | SWIRE2_24_J103314.8573110**Sources without existing optical spectra, for which we have determined photometric redshifts (see text and Figure 6). The computed phot-z value, and 68% uncertainty is listed. This uncertainty was propagated when computing the listed infrared luminosity. | Phot-z | |||
| 6 | SWIRE3_J103320.32574913.6 | 0.240 | ESI/ech | 11.37 | 23.02 |
| 7 | SWIRE3_J103327.90574534.4 | 0.152 | SDSS | 10.60 | |
| 8 | SWIRE3_J103341.28580221.4**Sources without existing optical spectra, for which we have determined photometric redshifts (see text and Figure 6). The computed phot-z value, and 68% uncertainty is listed. This uncertainty was propagated when computing the listed infrared luminosity. | Phot-z22For the case of J103341.28+580221.4, we prefer the SWIRE optical data due to confusion with a foreground spiral and use these rather than the SDSS data to calculate its photometric redshift. | 24.05 | ||
| 9 | SWIRE3_J103358.73574317.1 | 0.263 | ESI/ech | 11.46 | 23.49 |
| 10 | SWIRE2_24_J103358.9572952 | 0.469 | ESI/ech | 12.04 | 24.24 |
| 11 | SWIRE3_J103515.83573337.4**Sources without existing optical spectra, for which we have determined photometric redshifts (see text and Figure 6). The computed phot-z value, and 68% uncertainty is listed. This uncertainty was propagated when computing the listed infrared luminosity. | Phot-z | |||
| 12 | SWIRE3_J103526.79575147.6 | 0.595 | ESI/low-d | 12.25 | 23.85 |
| 13 | SWIRE2_24_J103538.8573546**Sources without existing optical spectra, for which we have determined photometric redshifts (see text and Figure 6). The computed phot-z value, and 68% uncertainty is listed. This uncertainty was propagated when computing the listed infrared luminosity. | Phot-z | 24.36 | ||
| 14 | SWIRE3_J103539.24574243.9 | 0.113 | ESI/ech | 10.58 | 21.93 |
| 15 | SWIRE2_24_J103557.1572234**Sources without existing optical spectra, for which we have determined photometric redshifts (see text and Figure 6). The computed phot-z value, and 68% uncertainty is listed. This uncertainty was propagated when computing the listed infrared luminosity. | Phot-z | |||
| 16 | SWIRE3_J103603.97574812.511Thirty of the forty sources in our sample have spectroscopic redshifts, and 28 of these have spectra, which are displayed in Figures 5.1 – 5.28. The spectra for sources J103603.97574812.5, and J105349.60570708.1 are not available. | 0.511 | B11Thirty of the forty sources in our sample have spectroscopic redshifts, and 28 of these have spectra, which are displayed in Figures 5.1 – 5.28. The spectra for sources J103603.97574812.5, and J105349.60570708.1 are not available. | 12.20 | |
| 17 | SWIRE3_J103606.48574702.4 | 0.044 | SDSS | 9.95 | |
| 18 | SWIRE3_J103653.50575442.5 | 0.102 | SDSS | 10.46 | |
| 19 | SWIRE3_J104948.86573458.2 | 0.135 | SDSS+ESI/low-d | 10.89 | 22.20 |
| 20 | SWIRE3_J104956.06571440.4**Sources without existing optical spectra, for which we have determined photometric redshifts (see text and Figure 6). The computed phot-z value, and 68% uncertainty is listed. This uncertainty was propagated when computing the listed infrared luminosity. | Phot-z | |||
| 21 | SWIRE3_J105041.96570706.7 | 0.091 | ESI/ech | 10.76 | 22.18 |
| 22 | SWIRE3_J105052.41573506.9 | 0.028 | SDSS+ESI/ech | 9.64 | 20.64 |
| 23 | SWIRE3_J105056.60571631.2 | 0.397 | ESI/low-d | 11.69 | 23.55 |
| 24 | SWIRE3_J105100.42574114.9 | 0.071 | ESI/ech | 10.12 | |
| 25 | SWIRE3_J105113.41571425.9 | 0.362 | ESI/ech | 11.90 | 23.76 |
| 26 | SWIRE3_J105143.75572936.9 | 0.081 | ESI/ech | 10.18 | 22.01 |
| 27 | SWIRE3_J105150.50573905.7 | 0.136 | SDSS | 10.56 | 21.57 |
| 28 | SWIRE3_J105151.64570935.7 | 0.608 | ESI/low-d | 12.12 | 23.44 |
| 29 | SWIRE3_J105207.16570745.5 | 0.123 | ESI/ech | 10.73 | 22.05 |
| 30 | SWIRE3_J105225.75570153.6 | 0.061 | ESI/ech | 10.16 | 21.66 |
| 31 | SWIRE3_J105242.40572444.7**Sources without existing optical spectra, for which we have determined photometric redshifts (see text and Figure 6). The computed phot-z value, and 68% uncertainty is listed. This uncertainty was propagated when computing the listed infrared luminosity. | Phot-z | 22.57 | ||
| 32 | SWIRE3_J105252.76570753.7 | 0.163 | SDSS+ESI/low-d | 10.99 | 22.53 |
| 33 | SWIRE3_J105256.85570825.6 | 0.080 | ESI/low-d | 10.40 | 21.90 |
| 34 | SWIRE3_J105301.36570543.1 | 0.080 | ESI/ech | 10.64 | 22.14 |
| 35 | SWIRE3_J105308.32570645.6**Sources without existing optical spectra, for which we have determined photometric redshifts (see text and Figure 6). The computed phot-z value, and 68% uncertainty is listed. This uncertainty was propagated when computing the listed infrared luminosity. | Phot-z | |||
| 36 | SWIRE3_J105314.84574137.6**Sources without existing optical spectra, for which we have determined photometric redshifts (see text and Figure 6). The computed phot-z value, and 68% uncertainty is listed. This uncertainty was propagated when computing the listed infrared luminosity. | Phot-z | 22.41 | ||
| 37 | SWIRE3_J105318.94572140.7 | 0.133 | SDSS | 10.70 | 22.34 |
| 38 | SWIRE3_J105320.92571433.2 | 0.080 | SDSS | 10.03 | |
| 39 | SWIRE3_J105349.60570708.111Thirty of the forty sources in our sample have spectroscopic redshifts, and 28 of these have spectra, which are displayed in Figures 5.1 – 5.28. The spectra for sources J103603.97574812.5, and J105349.60570708.1 are not available. | 0.006 | NED11Thirty of the forty sources in our sample have spectroscopic redshifts, and 28 of these have spectra, which are displayed in Figures 5.1 – 5.28. The spectra for sources J103603.97574812.5, and J105349.60570708.1 are not available. | 8.81 | 19.84 |
| 40 | SWIRE3_J105432.31570932.4 | 0.068 | SDSS | 10.44 | 21.86 |
Note. — Sources in the LHNW and LHEX fields listed in order of increasing right ascension, with columns giving a counter number, source ID, redshift, infrared luminosity (8-1000) in units of , and radio power in units: log(W Hz-1). The sources of the spectra listed in the -Ref. column are: from ESI on Keck II in low-dispersion (low-d) and echellette (ech) mode, from Amy Barger’s private communication (2003) (B), from SDSS, and from NED.
| log | Number | Median | ||||
|---|---|---|---|---|---|---|
| (Mpc-3 mag-1) | ||||||
| 9.8 | 0.53 | 0.11 | 3 | 0.044 | ||
| 10.2 | 0.64 | 0.09 | 6 | 0.077 | ||
| 10.6 | 0.59 | 0.07 | 10 | 0.114 | ||
| 11.0 | 0.68 | 0.11 | 5 | 0.163 | ||
| 11.4 | 0.66 | 0.17 | 2 | 0.251 | ||
| 11.8 | 0.65 | 0.13 | 3 | 0.397 | ||
| 12.2 | 0.57 | 0.09 | 5 | 0.511 | ||
| 12.6 | 0.58 | 0.10 | 4 | 0.725 | ||
Note. — The galaxy sample is placed into luminosity bins of 0.4 in the range log. We list the space density , the uncertainty in this value, volume sampling parameter , uncertainty in , the number of galaxies in each bin, and the median redshift.
| # | Source | log | 12+log | S-Type | q-value | log | Morphology | Notes | |
|---|---|---|---|---|---|---|---|---|---|
| () | |||||||||
| 35 | SWIRE3_J105308.32570645.6 | 10.90 | Highly Disturbed | tidal features | |||||
| 13 | SWIRE2_24_J103538.8573546 | 2.07 | **Sources J103538.8573546 and J103341.28580221.4 suffer from contamination due to partially overlapping foreground galaxies, which prohibits determining accurate masses. Source J105151.64570935.7 is spectroscopically classified as a Seyfert and is suspected to harbor a QSO, thus the use of Le Phare to determine a mass from the UV-NIR photometry is inappropriate. | Spheroid | S overlapping foreground galaxy with . | ||||
| 8 | SWIRE3_J103341.28580221.4 | 2.35 | **Sources J103538.8573546 and J103341.28580221.4 suffer from contamination due to partially overlapping foreground galaxies, which prohibits determining accurate masses. Source J105151.64570935.7 is spectroscopically classified as a Seyfert and is suspected to harbor a QSO, thus the use of Le Phare to determine a mass from the UV-NIR photometry is inappropriate. | Spheroid | SW foreground spiral with . | ||||
| 5 | SWIRE2_24_J103314.8573110 | 11.25 | Spheroid | ||||||
| 1 | SWIRE3_J103237.44580845.9 | 11.18 | Disk | disturbed, tidal features | |||||
| 12 | SWIRE3_J103526.79575147.6 | 12.25 | H/C/L: | 2.33 | 10.82 | Spheroid | pair ( kpc, ); star to S. | ||
| 16 | SWIRE3_J103603.97574812.5 | 12.20 | 10.88 | Merger | overlapping pair | ||||
| 28 | SWIRE3_J105151.64570935.7 | 12.12 | S: | 2.63 | **Sources J103538.8573546 and J103341.28580221.4 suffer from contamination due to partially overlapping foreground galaxies, which prohibits determining accurate masses. Source J105151.64570935.7 is spectroscopically classified as a Seyfert and is suspected to harbor a QSO, thus the use of Le Phare to determine a mass from the UV-NIR photometry is inappropriate. | Spheroid | pair ? ( = 30 kpc) | ||
| 10 | SWIRE2_24_J103358.9572952 | 12.04 | 1.70 | 10.75 | Spheroid | tidal debris. (NE object is bkg source with .) | |||
| 15 | SWIRE2_24_J103557.1572234 | 11.77 | Disk | large (100 kpc) edge-on disk | |||||
| 25 | SWIRE3_J105113.41571425.9 | 11.90 | S/L: | 2.06 | 11.49 | Spheroid | compact | ||
| 23 | SWIRE3_J105056.60571631.2 | 11.69 | 1.00 | 8.87 | H: | 2.06 | 10.63 | Spheroid | tidal debris + pair ( = 40 kpc, ) |
| 9 | SWIRE3_J103358.73574317.1 | 11.46 | 0.88 | H | 1.84 | 11.70 | Spheroid | faint SE companion ( = 7 kpc) | |
| 6 | SWIRE3_J103320.32574913.6 | 11.37 | 0.66 | 8.89 | H | 2.28 | 10.77 | Disk | tidal arm(s). |
| 31 | SWIRE3_J105242.40572444.7 | 2.39 | 10.86 | Disk | |||||
| 36 | SWIRE3_J105314.84574137.6 | 2.55 | 10.46 | Disk | interacting system with SE companion ( = 30 kpc) | ||||
| 32 | SWIRE3_J105252.76570753.7 | 10.99 | 0.86 | 8.93 | H | 2.35 | 11.11 | Disk | tidal feature - possible SW companion |
| 19 | SWIRE3_J104948.86573458.2 | 10.89 | C/S/L: | 2.62 | 11.24 | Disk | edge-on with bright nucleus | ||
| 11 | SWIRE3_J103515.83573337.4 | 11.04 | Disk | bright star to N | |||||
| 21 | SWIRE3_J105041.96570706.7 | 10.76 | 2.08 | H | 2.53 | 11.19 | Disk | edge-on | |
| 29 | SWIRE3_J105207.16570745.5 | 10.73 | 0.11 | 9.08 | H | 2.60 | 10.72 | Disk | |
| 37 | SWIRE3_J105318.94572140.7 | 10.70 | 0.53 | 8.95 | H | 2.28 | 10.88 | Disk | |
| 2 | SWIRE2_24_J103249.4573707 | 10.67 | 0.58 | 8.56 | H | 2.20 | 10.74 | Disk | |
| 34 | SWIRE3_J105301.36570543.1 | 10.64 | 0.47 | 8.64 | H | 2.38 | 10.49 | Disk | compact with bright nucleus |
| 7 | SWIRE3_J103327.90574534.4 | 10.60 | 0.71 | 8.87 | H | 11.25 | Disk | possible tidal arm | |
| 14 | SWIRE3_J103539.24574243.9 | 10.58 | 0.71 | 8.89 | H | 2.58 | 11.03 | Disk | small companion to N |
| 27 | SWIRE3_J105150.50573905.7 | 10.56 | 2.91 | 10.95 | Disk | edge-on | |||
| 18 | SWIRE3_J103653.50575442.5 | 10.46 | 0.52 | 8.43 | H | 10.58 | Disk | compact with possible companion to SW | |
| 40 | SWIRE3_J105432.31570932.4 | 10.44 | 0.74 | 8.77 | H | 2.44 | 10.88 | Disk | bright nucleus |
| 33 | SWIRE3_J105256.85570825.6 | 10.40 | L: | 2.45 | 10.80 | Disk | edge-on with companion to SE | ||
| 26 | SWIRE3_J105143.75572936.9 | 10.18 | 1.87 | S | 2.10 | 11.09 | Disk | edge-on with bright nucleus | |
| 3 | SWIRE3_J103253.94580633.0 | 10.17 | 0.55 | 8.18 | H | 10.26 | Disk | disturbed | |
| 30 | SWIRE3_J105225.75570153.6 | 10.16 | 0.14 | 8.48 | H | 2.42 | 10.04 | Disk | blue compact |
| 24 | SWIRE3_J105100.42574114.9 | 10.12 | 1.41 | H | 10.56 | Disk | face-on | ||
| 38 | SWIRE3_J105320.92571433.2 | 10.03 | 11.47 | Disk | face-on, disturbed with bright nucleus | ||||
| 20 | SWIRE3_J104956.06571440.4 | 10.23 | Disk | small, edge-on | |||||
| 17 | SWIRE3_J103606.48574702.4 | 9.95 | 0.55 | 8.58 | H | 9.70 | Disk | small, edge-on | |
| 22 | SWIRE3_J105052.41573506.9 | 9.64 | 0.52 | 8.43 | H | 2.92 | 10.40 | Disk | small, edge-on |
| 4 | SWIRE2_24_J103258.0573105 | 9.55 | 0.49 | 9.00 | H/C: | 10.47 | Disk | edge-on | |
| 39 | SWIRE3_J105349.60570708.1 | 8.81 | 2.92 | 9.45 | Disk | blue compact | |||
Note. — Sources in the LHNW and LHEX fields listed in order of decreasing . Columns give RA ordered counter number, source ID, infrared luminosity (8-1000) in units of , extinction, metallicity, spectral type (H = star-forming, C = star forming + AGN, S = Seyfert, L = LINER), stellar mass estimates in log(M☉) using the methods described in Ilbert et al. (2010), ‘q-value’ of FIR-radio correlation, morphology, and Notes (tidal debris and/or companions). The spectral types are determined by use of the methods of Kewley et al. (2006), while the extinction is calculated using the Balmer decrement, and metallicities using the [NII]/[OII] diagnostic of Kewley et al. (2002).
| # | Source | log | P1 Color | P2 Color | SF | Comp. | AGN | No EML |
|---|---|---|---|---|---|---|---|---|
| () | Probabilities | |||||||
| 35 | SWIRE3_J105308.32570645.6 | 0.37 | 0.06 | 0.37 | 0.51 | 0.06 | 0.06 | |
| 13 | SWIRE2_24_J103538.8573546**Sources J103538.8573546 and J103341.28580221.4 suffer from contamination due to partially overlapping foreground galaxies, which prohibits determining accurate P1,P2 colors. Source J105151.64570935.7 is spectroscopically classified as a Seyfert and is suspected to harbor a QSO, thus the use of P1,P2 color to determine spectral type is inappropriate. | **Sources J103538.8573546 and J103341.28580221.4 suffer from contamination due to partially overlapping foreground galaxies, which prohibits determining accurate P1,P2 colors. Source J105151.64570935.7 is spectroscopically classified as a Seyfert and is suspected to harbor a QSO, thus the use of P1,P2 color to determine spectral type is inappropriate. | **Sources J103538.8573546 and J103341.28580221.4 suffer from contamination due to partially overlapping foreground galaxies, which prohibits determining accurate P1,P2 colors. Source J105151.64570935.7 is spectroscopically classified as a Seyfert and is suspected to harbor a QSO, thus the use of P1,P2 color to determine spectral type is inappropriate. | **Sources J103538.8573546 and J103341.28580221.4 suffer from contamination due to partially overlapping foreground galaxies, which prohibits determining accurate P1,P2 colors. Source J105151.64570935.7 is spectroscopically classified as a Seyfert and is suspected to harbor a QSO, thus the use of P1,P2 color to determine spectral type is inappropriate. | **Sources J103538.8573546 and J103341.28580221.4 suffer from contamination due to partially overlapping foreground galaxies, which prohibits determining accurate P1,P2 colors. Source J105151.64570935.7 is spectroscopically classified as a Seyfert and is suspected to harbor a QSO, thus the use of P1,P2 color to determine spectral type is inappropriate. | **Sources J103538.8573546 and J103341.28580221.4 suffer from contamination due to partially overlapping foreground galaxies, which prohibits determining accurate P1,P2 colors. Source J105151.64570935.7 is spectroscopically classified as a Seyfert and is suspected to harbor a QSO, thus the use of P1,P2 color to determine spectral type is inappropriate. | **Sources J103538.8573546 and J103341.28580221.4 suffer from contamination due to partially overlapping foreground galaxies, which prohibits determining accurate P1,P2 colors. Source J105151.64570935.7 is spectroscopically classified as a Seyfert and is suspected to harbor a QSO, thus the use of P1,P2 color to determine spectral type is inappropriate. | |
| 8 | SWIRE3_J103341.28580221.4**Sources J103538.8573546 and J103341.28580221.4 suffer from contamination due to partially overlapping foreground galaxies, which prohibits determining accurate P1,P2 colors. Source J105151.64570935.7 is spectroscopically classified as a Seyfert and is suspected to harbor a QSO, thus the use of P1,P2 color to determine spectral type is inappropriate. | **Sources J103538.8573546 and J103341.28580221.4 suffer from contamination due to partially overlapping foreground galaxies, which prohibits determining accurate P1,P2 colors. Source J105151.64570935.7 is spectroscopically classified as a Seyfert and is suspected to harbor a QSO, thus the use of P1,P2 color to determine spectral type is inappropriate. | **Sources J103538.8573546 and J103341.28580221.4 suffer from contamination due to partially overlapping foreground galaxies, which prohibits determining accurate P1,P2 colors. Source J105151.64570935.7 is spectroscopically classified as a Seyfert and is suspected to harbor a QSO, thus the use of P1,P2 color to determine spectral type is inappropriate. | **Sources J103538.8573546 and J103341.28580221.4 suffer from contamination due to partially overlapping foreground galaxies, which prohibits determining accurate P1,P2 colors. Source J105151.64570935.7 is spectroscopically classified as a Seyfert and is suspected to harbor a QSO, thus the use of P1,P2 color to determine spectral type is inappropriate. | **Sources J103538.8573546 and J103341.28580221.4 suffer from contamination due to partially overlapping foreground galaxies, which prohibits determining accurate P1,P2 colors. Source J105151.64570935.7 is spectroscopically classified as a Seyfert and is suspected to harbor a QSO, thus the use of P1,P2 color to determine spectral type is inappropriate. | **Sources J103538.8573546 and J103341.28580221.4 suffer from contamination due to partially overlapping foreground galaxies, which prohibits determining accurate P1,P2 colors. Source J105151.64570935.7 is spectroscopically classified as a Seyfert and is suspected to harbor a QSO, thus the use of P1,P2 color to determine spectral type is inappropriate. | **Sources J103538.8573546 and J103341.28580221.4 suffer from contamination due to partially overlapping foreground galaxies, which prohibits determining accurate P1,P2 colors. Source J105151.64570935.7 is spectroscopically classified as a Seyfert and is suspected to harbor a QSO, thus the use of P1,P2 color to determine spectral type is inappropriate. | |
| 5 | SWIRE2_24_J103314.8573110 | 0.35 | 0.00 | 0.08 | 0.19 | 0.29 | 0.44 | |
| 1 | SWIRE3_J103237.44580845.9 | 0.11 | 0.03 | 0.54 | 0.31 | 0.10 | 0.04 | |
| 12 | SWIRE3_J103526.79575147.6 | 12.25 | 0.05 | 0.06 | 0.43 | 0.53 | 0.04 | 0.00 |
| 16 | SWIRE3_J103603.97574812.5 | 12.20 | -0.51 | 0.01 | 0.90 | 0.03 | 0.02 | 0.05 |
| 28 | SWIRE3_J105151.64570935.7**Sources J103538.8573546 and J103341.28580221.4 suffer from contamination due to partially overlapping foreground galaxies, which prohibits determining accurate P1,P2 colors. Source J105151.64570935.7 is spectroscopically classified as a Seyfert and is suspected to harbor a QSO, thus the use of P1,P2 color to determine spectral type is inappropriate. | 12.12 | **Sources J103538.8573546 and J103341.28580221.4 suffer from contamination due to partially overlapping foreground galaxies, which prohibits determining accurate P1,P2 colors. Source J105151.64570935.7 is spectroscopically classified as a Seyfert and is suspected to harbor a QSO, thus the use of P1,P2 color to determine spectral type is inappropriate. | **Sources J103538.8573546 and J103341.28580221.4 suffer from contamination due to partially overlapping foreground galaxies, which prohibits determining accurate P1,P2 colors. Source J105151.64570935.7 is spectroscopically classified as a Seyfert and is suspected to harbor a QSO, thus the use of P1,P2 color to determine spectral type is inappropriate. | **Sources J103538.8573546 and J103341.28580221.4 suffer from contamination due to partially overlapping foreground galaxies, which prohibits determining accurate P1,P2 colors. Source J105151.64570935.7 is spectroscopically classified as a Seyfert and is suspected to harbor a QSO, thus the use of P1,P2 color to determine spectral type is inappropriate. | **Sources J103538.8573546 and J103341.28580221.4 suffer from contamination due to partially overlapping foreground galaxies, which prohibits determining accurate P1,P2 colors. Source J105151.64570935.7 is spectroscopically classified as a Seyfert and is suspected to harbor a QSO, thus the use of P1,P2 color to determine spectral type is inappropriate. | **Sources J103538.8573546 and J103341.28580221.4 suffer from contamination due to partially overlapping foreground galaxies, which prohibits determining accurate P1,P2 colors. Source J105151.64570935.7 is spectroscopically classified as a Seyfert and is suspected to harbor a QSO, thus the use of P1,P2 color to determine spectral type is inappropriate. | **Sources J103538.8573546 and J103341.28580221.4 suffer from contamination due to partially overlapping foreground galaxies, which prohibits determining accurate P1,P2 colors. Source J105151.64570935.7 is spectroscopically classified as a Seyfert and is suspected to harbor a QSO, thus the use of P1,P2 color to determine spectral type is inappropriate. |
| 10 | SWIRE2_24_J103358.9572952 | 12.04 | 0.33 | 0.09 | 0.37 | 0.51 | 0.06 | 0.06 |
| 15 | SWIRE2_24_J103557.1572234 | 0.22 | 0.05 | 0.37 | 0.51 | 0.06 | 0.06 | |
| 25 | SWIRE3_J105113.41571425.9 | 11.90 | 0.49 | 0.01 | 0.06 | 0.33 | 0.36 | 0.24 |
| 23 | SWIRE3_J105056.60571631.2 | 11.69 | -0.10 | 0.01 | 0.72 | 0.25 | 0.02 | 0.00 |
| 9 | SWIRE3_J103358.73574317.1 | 11.46 | 0.11 | 0.07 | 0.43 | 0.53 | 0.04 | 0.00 |
| 6 | SWIRE3_J103320.32574913.6 | 11.37 | -0.08 | 0.03 | 0.72 | 0.25 | 0.02 | 0.00 |
| 31 | SWIRE3_J105242.40572444.7 | -0.38 | 0.02 | 0.90 | 0.03 | 0.02 | 0.05 | |
| 36 | SWIRE3_J105314.84574137.6 | -0.19 | 0.02 | 0.72 | 0.25 | 0.02 | 0.00 | |
| 32 | SWIRE3_J105252.76570753.7 | 10.99 | 0.11 | 0.05 | 0.54 | 0.31 | 0.10 | 0.04 |
| 19 | SWIRE3_J104948.86573458.2 | 10.89 | 0.37 | 0.07 | 0.37 | 0.51 | 0.06 | 0.06 |
| 11 | SWIRE3_J103515.83573337.4 | 0.10 | -0.02 | 0.34 | 0.29 | 0.24 | 0.12 | |
| 21 | SWIRE3_J105041.96570706.7 | 10.76 | 0.35 | 0.06 | 0.37 | 0.51 | 0.06 | 0.06 |
| 29 | SWIRE3_J105207.16570745.5 | 10.73 | -0.12 | 0.01 | 0.72 | 0.25 | 0.02 | 0.00 |
| 37 | SWIRE3_J105318.94572140.7 | 10.70 | -0.16 | 0.05 | 0.72 | 0.25 | 0.02 | 0.00 |
| 2 | SWIRE2_24_J103249.4573707 | 10.67 | 0.04 | 0.03 | 0.54 | 0.31 | 0.10 | 0.04 |
| 34 | SWIRE3_J105301.36570543.1 | 10.64 | -0.05 | 0.03 | 0.54 | 0.31 | 0.10 | 0.04 |
| 7 | SWIRE3_J103327.90574534.4 | 10.60 | -0.05 | 0.02 | 0.54 | 0.31 | 0.10 | 0.04 |
| 14 | SWIRE3_J103539.24574243.9 | 10.58 | 0.16 | 0.04 | 0.54 | 0.31 | 0.10 | 0.04 |
| 27 | SWIRE3_J105150.50573905.7 | 10.56 | 0.15 | 0.04 | 0.54 | 0.31 | 0.10 | 0.04 |
| 18 | SWIRE3_J103653.50575442.5 | 10.46 | -0.19 | 0.03 | 0.72 | 0.25 | 0.02 | 0.00 |
| 40 | SWIRE3_J105432.31570932.4 | 10.44 | 0.20 | 0.03 | 0.54 | 0.31 | 0.10 | 0.04 |
| 33 | SWIRE3_J105256.85570825.6 | 10.40 | 0.32 | 0.05 | 0.22 | 0.47 | 0.19 | 0.12 |
| 26 | SWIRE3_J105143.75572936.9 | 10.18 | 0.27 | 0.05 | 0.37 | 0.51 | 0.06 | 0.06 |
| 3 | SWIRE3_J103253.94580633.0 | 10.17 | -0.27 | 0.02 | 0.72 | 0.25 | 0.02 | 0.00 |
| 30 | SWIRE3_J105225.75570153.6 | 10.16 | -0.44 | 0.01 | 0.90 | 0.03 | 0.02 | 0.05 |
| 24 | SWIRE3_J105100.42574114.9 | 10.12 | -0.14 | 0.01 | 0.72 | 0.25 | 0.02 | 0.00 |
| 38 | SWIRE3_J105320.92571433.2 | 10.03 | 0.45 | 0.02 | 0.22 | 0.47 | 0.19 | 0.12 |
| 20 | SWIRE3_J104956.06571440.4 | 0.16 | 0.03 | 0.54 | 0.31 | 0.10 | 0.04 | |
| 17 | SWIRE3_J103606.48574702.4 | 9.95 | -0.30 | 0.03 | 0.72 | 0.25 | 0.02 | 0.00 |
| 22 | SWIRE3_J105052.41573506.9 | 9.64 | 0.07 | 0.04 | 0.54 | 0.31 | 0.10 | 0.04 |
| 4 | SWIRE2_24_J103258.0573105 | 9.55 | 0.29 | 0.03 | 0.22 | 0.47 | 0.19 | 0.12 |
| 39 | SWIRE3_J105349.60570708.1 | 8.81 | 0.42 | 0.03 | 0.22 | 0.47 | 0.19 | 0.12 |
Note. — Sources in the LHNW and LHEX fields listed in order of decreasing . Columns give RA ordered counter number, source ID, infrared luminosity (8-1000) in units of log(), corrected P1 color, corrected P2 color, Star-Forming probability, Composite probability, AGN probability, and No Emission-Line probability calculated by comparing P1 and P2 colors with those of the IRAS sample (see Appendix).