Optical spectral classification of southern ultraluminous infrared galaxies
Abstract
We present a study of the optical spectral properties of 115 ultraluminous infrared galaxies (ULIRGs) in the southern sky. Using the optical spectra obtained at CTIO 4 m and provided by the 2dF Galaxy Redshift Survey and the 6dF Galaxy Survey, we measure emission line widths and fluxes for spectral classification. We determine the spectral types of ULIRGs with H measurement using the standard diagnostic diagrams. For ULIRGs without H measurement, we determine their spectral types using the plane of flux ratio between [O iii] and H versus [O iii] line width based on our new empirical criterion. This criterion is efficient to distinguish active galactic nuclei (AGNs) from non-AGN galaxies with completeness and reliability of about 90 per cent. The sample of 115 ULIRGs is found to consist of 8 broad-line AGNs, 49 narrow-line AGNs, and 58 non-AGNs. The AGN fraction is on average 50 per cent and increases with infrared luminosity and IRAS 2560 m colour, consistent with previous studies. The IRAS 2560 m colour distributions are significantly different between AGN and non-AGN ULIRGs, while their IRAS 60100 m colour distributions are similar.
keywords:
galaxies: active – galaxies: general – galaxies: starburst – infrared: galaxies1 Introduction
Ultraluminous infrared galaxies (ULIRGs) with infrared luminosity at 8–1000 m greater than 1012 (Soifer et al. 1987) are extremely energetic objects in the universe. Although they contribute little to the infrared luminosity density in the local universe due to small numbers, they become cosmologically important at z 1 (e.g., Le Floc’h et al. 2005; Magnelli et al. 2009). Their enormous infrared luminosity comes from dust heated by hot young stars (starburst), a supermassive black hole rapidly accreting matter (active galactic nucleus, AGN), or a mixture of these two (see Sanders & Mirabel 1996 and Lonsdale et al. 2006 for a review). These starburst and/or AGN activities can be triggered by tidal interactions between galaxies and associated shocks (e.g., Bushouse 1987; Liu & Kennicutt 1995; Barnes 2004). In fact, numerous observational and theoretical studies suggested that ULIRGs are mergers of gas-rich disk galaxies (e.g., Clements et al. 1996; Mihos & Hernquist 1996; Veilleux et al. 2002; Younger et al. 2009; Hwang et al. 2010a), and evolve into quasars (e.g., Sanders et al. 1988; Dasyra et al. 2006; Hopkins et al. 2006; Yuan et al. 2010) or intermediate-mass elliptical galaxies (e.g., Genzel et al. 2001; Tacconi et al. 2002).
To better understand the origin and evolution of ULIRGs, it is essential to find out what their primary energy source is. A standard spectroscopic method to distinguish between starburst and AGN is to use so-called BPT diagrams (Baldwin et al. 1981), which are based on optical emission line ratios sensitive to the photoionization source. This optical diagnostic was revised by Veilleux & Osterbrock (1987) and an alternative scheme was proposed by Kewley et al. (2006). In heavily obscured galaxies like ULIRGs, additional observations at other wavelengths are helpful to characterize their dominant energy source (e.g., X-ray: Franceschini et al. 2003, Teng et al. 2009; infrared: Risaliti et al. 2006, Farrah et al. 2007, Imanishi et al. 2010; radio: Nagar et al. 2003, Sajina et al. 2008). However, it is still difficult to determine the relative contribution of starburst and AGN within individual galaxies.
ULIRGs were discovered in large numbers by the Infrared Astronomical Satellite (IRAS; Neugebauer et al. 1984) and the number of ULIRGs increased with the advent of wide-field galaxy redshift surveys (Goto 2005; Pasquali et al. 2005; Cao et al. 2006; Hwang et al. 2007, 2010a; Hou et al. 2009). However, previous studies based on optical spectra of the large sample are limited to the Sloan Digital Sky Survey (SDSS; York et al. 2000), which mainly covers the northern hemisphere. The optical spectral properties of ULIRGs in the southern hemisphere remain to be studied.
In this study, we present the analysis of optical spectra for about a hundred southern ULIRGs in the catalogue given by Hwang et al. (2007). The structure of this paper is as follows. The survey data and our observations are described in Section 2. Section 3 explains the procedures to analyse these data and to classify the ULIRGs. In Section 4, the results of our study are discussed, and are compared with those of previous studies. We summarize and conclude in Section 5. Throughout, we adopt = 70 km s-1 Mpc-1 and a flat CDM cosmology with density parameters = 0.3 and = 0.7.
2 Observations and data
Hwang et al. (2007) identified 324 ULIRGs by
cross-correlating the IRAS Faint Source Catalogue Version 2 (Moshir et al. 1992)
with the spectroscopic catalogues of galaxies in the Fourth Data Release of SDSS (Adelman-McCarthy et al. 2006.),
the Final Data Release of the 2dF Galaxy Redshift Survey (2dFGRS; Colless et al. 2001),
and the Second Data Release of the 6dF Galaxy Survey (6dFGS; Jones et al. 2004, 2005).
The spectral types of ULIRGs in the SDSS among them were determined in Hou et al. (2009).
In this study, we focus on 198 ULIRGs that were not covered by the SDSS but covered by the 2dFGRS and 6dFGS.
We used the optical spectra of these ULIRGs available online111For 2dFGRS, http://www.mso.anu.edu.au/2dFGRS/
For 6dFGS, http://www-wfau.roe.ac.uk/6dFGS/.
The optical spectra of 2dFGRS galaxies were taken with the Two-degree Field (2dF) multi-object spectrograph on the Anglo-Australian Telescope. This spectrograph has 140 m diameter fibres corresponding to 2″.16 at the plate centre and 1″.99 at the edge and covers 3600–8000 Å with a spectral resolution of 9 Å. The 6dFGS galaxies were observed with the Six-degree Field (6dF) multi-object spectrograph having 6″.7 diameter fibres on the United Kingdom Schmidt Telescope. The original grating in the 6dFGS spectrograph spans 4000–8400 Åand gives a resolution of 5–12 Å. The improved grating, used after 2002 October, spans 3900–7500 Å with a resolution of 4.9–6.6 Å. It is noted that the 2dFGRS and 6dFGS spectra are not properly flux-calibrated, but the flux ratio of adjacent lines is still useful (to be discussed in Section 4).
In addition, we conducted optical spectroscopy of 15 ULIRGs in the survey sample plus one ULIRG, IRAS 090223615, in Sanders et al. (2003) at the Cerro Tololo Inter-American Observatory (CTIO). The total number of our ULIRG sample with spectra was increased to 199. The additional ULIRGs were observed on 2008 February 20–21 with the Ritchey-Chretien spectrograph and the Loral 3K CCD at the CTIO 4-m telescope (0″.5 pixel-1). A slit with a width of 1″.5 (a slightly larger than the seeing size) was adopted, and was positioned in the east-west direction (P.A. = 90 °). We used 316 lines mm-1 grating to cover the spectral range 4500–10500 Å with a resolution of 5.6 Å ( 2.8 pixels). Three exposures were taken for each object and the integration times ranged from 360 to 3000 seconds depending on its brightness.
Data reduction was performed using the IRAF package. This involved bias subtraction, flat fielding, sky subtraction, wavelength and flux calibration. Galaxy spectra were extracted using an aperture width corresponding to a constant linear scale of 5 kpc at the redshift of each galaxy. A He-Ne-Ar lamp and standard star Hiltner 600 (Massey et al. 1988) taken nightly were used for wavelength and flux calibration, respectively. In Fig. 1, we display 13 spectra with median signal-to-noise ratio (S/N) per pixel for the continuum greater than 3. Typical emission lines (H, [O iii], H+[N ii], and [S ii]) are clearly seen in most spectra.
Among the sample of 199 ULIRGs considered in this study, we analyse the spectra of 115 ULIRGs with continuum S/N 3. In the case that there are more than one spectrum for the same object, the spectrum with a higher S/N of H flux is chosen for the final classification. If H is not available from any spectra, the spectrum with a higher S/N of H flux has priority.

3 Analysis
3.1 Emission-line measurements
After transforming the spectrum to the rest-frame and subtracting the local continuum defined by a linear fit around emission-lines, we measure the line widths and fluxes via Gaussian profile fit using the MPFIT/IDL package based on the Levenberg-Marquardt method (Markwardt 2009). A single Gaussian is used to obtain the line width of [O iii]. For the line fluxes, we fit the [O i] line, [S ii] doublet, H+[N ii] and H+[O iii] line complexes with one Gaussian, two Gaussians, four Gaussians, and six Gaussians, respectively. The widths of the [N ii] doublet are kept the same and the height ratio of [N ii] to [N ii] is fixed to 1/3, as required by the energy level structure of the [N ii] ion (Osterbrock & Ferland 2006). The [O iii] doublet is fitted in the same way but each of the [O iii] lines is modelled with two Gaussians because [O iii] line often has a blue, asymmetric wing that is perhaps from outflows of gas with opaque clouds (e.g., Heckman et al 1981; Greene & Ho 2005). Some AGN host galaxies show both narrow and broad Balmer lines (e.g., Osterbrock & Mathews 1986; Hao et al. 2005) and the narrow Balmer lines can have extended bases even in star-forming galaxies, which are probably due to Wolf-Rayet stars (e.g., Osterbrook & Cohen 1982; Brinchmann et al. 2008). To take this into account, we fit each Balmer line with two Gaussians. If the H+[N ii] line complex cannot be decomposed into individual lines, the line fluxes are not kept. Meanwhile, the decomposition of [S ii] doublet is not important because we are interested only in the total flux of the lines. Uncertainties in the line measurements, comes from MPFIT routine, are typically 10–30 per cent.
3.2 Corrections
We correct the line fluxes for Galactic extinction using the foreground reddening maps provided by Schlegel et al. (1998) and the extinction law of Cardelli et al. (1989).
Balmer emission lines can be strongly affected by stellar absorption features. We remove the stellar absorption effects following the method discussed in Hopkins et al. (2003): , where is the stellar absorption-corrected line flux, is the measured line flux after foreground reddening correction, is the equivalent width of the line, and is a correction factor. We adopted values (2.6 and 3.2 Å for H and H, respectively) of Sc type galaxies (Miller & Owen 2002).
If both H and H are measured, we can correct the line fluxes for internal extinction using the Balmer decrement and the extinction curve with an assumption of an intrinsic H/H line ratio of 2.85 for star-forming galaxies and 3.1 for AGN galaxies (Osterbrock & Ferland 2006). We do not apply this correction when the observed ratio is smaller than the theoretical value.
An observed line width is the convolution of intrinsic line width and instrumental response. Since the instrumental resolution of each survey is significantly different, the observed line width should be corrected for a fair comparison. To correct the full width at half maximum (FWHM) of [O iii] line using the quadrature method, we adopt 250 km s-1 as a finite resolution of CTIO spectra. Then we determine that the resolutions are roughly 450, 600, and 400 km s-1 for the 2dFGRS, original 6dFGS, and improved 6dFGS grating, respectively, by considering that the [O iii] lines from different spectra have the same intrinsic width. Note that corrected line widths below 100 km s-1 should be treated with caution due to their large uncertainties ( 200 km s-1).
3.3 Spectral classification
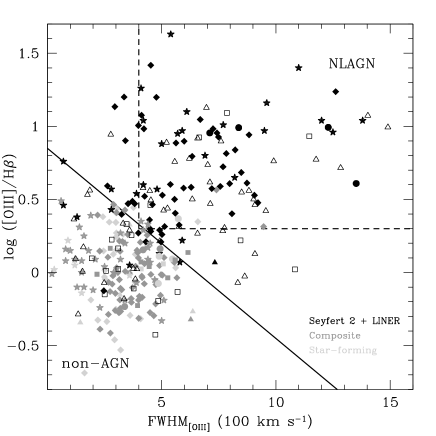
Table 1. Basic information and spectral types of 115 southern ULIRGs.
| IRAS name | RA (J2000) | Dec (J2000) | z | sample | class | sub. | known | ||||
|---|---|---|---|---|---|---|---|---|---|---|---|
| F000503259 | 00 07 34.6 | 32 43 03 | 0.285 | 0.144 | 0.222 | 0.758 | 12.12 | 2dFGRS | X | ||
| F000913905 | 00 11 42.3 | 38 49 15 | 0.253 | 0.125 | 0.316 | 0.756 | 12.14 | 6dFGS | N | ||
| F001843331 | 00 20 57.7 | 33 14 28 | 0.238 | 0.120 | 0.334 | 0.613 | 12.10 | 2dFGRS | X | ||
| F003183137 | 00 34 16.0 | 31 21 04 | 0.284 | 0.167 | 0.257 | 0.563 | 12.18 | 6dFGS | X | ||
| F003352732 | 00 35 59.2 | 27 15 42 | 0.068 | 0.632 | 4.294 | 3.207 | 12.01 | 2dFGRS | X | Co | Co(5) |
| F004562904 | 00 48 03.5 | 28 48 38 | 0.110 | 0.141 | 2.598 | 3.377 | 12.23 | 2dFGRS | X | Co | Co(5) |
| F004822721 | 00 50 40.0 | 27 04 42 | 0.129 | 0.182 | 1.134 | 1.839 | 12.03 | 2dFGRS | X | Co | Co(5) |
| F005693108 | 00 59 22.3 | 30 52 27 | 0.344 | 0.055 | 0.239 | 0.463 | 12.34 | 6dFGS | N | ||
| F010042237 | 01 02 51.2 | 22 21 50 | 0.117 | 0.660 | 2.287 | 1.790 | 12.24 | 6dFGS | N | Co(5)a | |
| F010093241 | 01 03 19.8 | 32 25 37 | 0.256 | 0.123 | 0.291 | 0.750 | 12.12 | 2dFGRS | N | ||
| F011602551 | 01 18 24.2 | 25 36 19 | 0.237 | 0.138 | 0.452 | 1.153 | 12.23 | 2dFGRS | X | ||
| F011644740 | 01 18 36.5 | 47 25 04 | 0.235 | 0.219 | 0.487 | 0.674 | 12.25 | CTIO | X | SF | |
| F012125025 | 01 23 20.1 | 50 09 29 | 0.201 | 0.077 | 0.415 | 0.717 | 12.02 | 6dFGS | N | ||
| F012340447 | 01 25 56.0 | 04 31 57 | 0.156 | 0.162 | 0.711 | 1.108 | 12.01 | 6dFGS | X | ||
| F013583300 | 01 38 05.3 | 32 45 29 | 0.197 | 0.138 | 0.835 | 1.079 | 12.31 | 2dFGRS | X | SF(1) | |
| F013793203 | 01 40 15.3 | 31 48 18 | 0.202 | 0.146 | 0.686 | 0.929 | 12.25 | 6dFGS | N | ||
| F014972906 | 01 52 04.0 | 28 51 18 | 0.183 | 0.052 | 0.588 | 1.278 | 12.08 | 2dFGRS | X | Co | |
| F015692939 | 01 59 13.1 | 29 24 37 | 0.140 | 0.143 | 1.734 | 1.514 | 12.29 | 2dFGRS | N | Co(5)a | |
| F020380816 | 02 06 18.7 | 08 02 32 | 0.220 | 0.326 | 0.351 | 0.525 | 12.04 | 6dFGS | N | ||
| F020682000 | 02 09 09.0 | 19 46 30 | 0.253 | 0.190 | 0.278 | 0.647 | 12.09 | 6dFGS | N | ||
| F021301948 | 02 15 23.5 | 19 34 18 | 0.191 | 0.196 | 0.553 | 0.565 | 12.10 | 6dFGS | N | ||
| F023564628 | 02 37 29.3 | 46 15 48 | 0.206 | 0.090 | 1.034 | 1.738 | 12.45 | 2dFGRS | X | ||
| F023613233 | 02 38 15.2 | 32 20 34 | 0.198 | 0.073 | 0.741 | 1.821 | 12.26 | 2dFGRS | X | SF | |
| F023644751 | 02 38 13.6 | 47 38 06 | 0.097 | 0.175 | 2.794 | 4.953 | 12.15 | 6dFGS | N | ||
| F023841744 | 02 40 46.4 | 17 31 52 | 0.308 | 0.072 | 0.269 | 1.344 | 12.28 | 6dFGS | X | ||
| F024371145 | 02 46 07.8 | 11 32 42 | 0.270 | 0.148 | 0.208 | 0.710 | 12.03 | 6dFGS | B | S1 | |
| F025954714 | 03 01 18.4 | 47 02 17 | 0.245 | 0.063 | 0.268 | 0.484 | 12.04 | CTIO | X | Co | |
| F030002719 | 03 02 10.6 | 27 07 29 | 0.221 | 0.113 | 0.918 | 2.039 | 12.47 | 2dFGRS | N | ||
| F031303119 | 03 15 04.6 | 31 08 02 | 0.258 | 0.103 | 0.252 | 0.438 | 12.06 | 2dFGRS | X | ||
| F032593105 | 03 27 59.3 | 30 54 50 | 0.261 | 0.065 | 0.249 | 0.559 | 12.07 | 2dFGRS | X | ||
| F034834704 | 03 49 54.4 | 46 55 10 | 0.301 | 0.098 | 0.156 | 0.542 | 12.02 | CTIO | X | SF | |
| F034851827 | 03 50 45.7 | 18 18 27 | 0.174 | 0.164 | 0.580 | 0.822 | 12.03 | 6dFGS | N | ||
| F035692535 | 03 59 00.9 | 25 26 44 | 0.220 | 0.071 | 0.613 | 0.598 | 12.28 | 6dFGS | X | ||
| F040565722 | 04 06 41.9 | 57 14 38 | 0.267 | 0.079 | 0.259 | 0.453 | 12.11 | 6dFGS | X | ||
| F042793035 | 04 29 55.7 | 30 28 54 | 0.232 | 0.114 | 0.311 | 0.839 | 12.04 | 6dFGS | X | ||
| F044891026 | 04 51 19.5 | 10 21 22 | 0.231 | 0.090 | 0.357 | 1.767 | 12.10 | 6dFGS | N | ||
| F045052958 | 04 52 30.7 | 29 53 34 | 0.285 | 0.189 | 0.650 | 0.765 | 12.58 | 6dFGS | B | S1 | S1(4) |
| F050202941 | 05 04 00.8 | 29 36 57 | 0.154 | 0.102 | 1.932 | 2.059 | 12.43 | 6dFGS | X | Co(5) | |
| F051563024 | 05 17 31.9 | 30 21 14 | 0.171 | 0.103 | 1.162 | 1.402 | 12.31 | 6dFGS | N | S2(5) | |
| F053483204 | 05 36 44.9 | 32 02 20 | 0.174 | 0.224 | 0.623 | 0.712 | 12.06 | CTIO | N | S2 | |
| F061584017 | 06 17 29.8 | 40 18 57 | 0.221 | 0.083 | 0.311 | 0.707 | 12.00 | 6dFGS | N | ||
| F082740147 | 08 30 00.6 | 01 57 05 | 0.250 | 0.149 | 0.594 | 0.622 | 12.40 | CTIO | X | SF | |
| F084112501 | 08 43 18.8 | 25 11 58 | 0.134 | 0.262 | 1.655 | 1.572 | 12.23 | 6dFGS | N | ||
| F090611248 | 09 08 35.1 | 13 01 01 | 0.073 | 0.191 | 3.634 | 5.316 | 12.01 | CTIO | X | Co | SF(2) |
| F090901349 | 09 11 27.9 | 14 01 40 | 0.171 | 0.091 | 0.845 | 1.553 | 12.17 | 6dFGS | X | ||
| F092480128 | 09 27 23.9 | 01 41 19 | 0.324 | 0.102 | 0.221 | 0.667 | 12.25 | CTIO | B | S1 | |
| F095210400 | 09 54 37.2 | 04 15 12 | 0.237 | 0.108 | 0.387 | 0.600 | 12.16 | 2dFGRS | N | ||
| F100770034 | 10 10 16.6 | 00 19 31 | 0.182 | 0.127 | 0.513 | 0.834 | 12.02 | 2dFGRS | X | SF | |
| F102982300 | 10 32 11.7 | 23 15 41 | 0.285 | 0.153 | 0.377 | 1.583 | 12.35 | 6dFGS | N | ||
| F104792808 | 10 50 18.9 | 28 24 01 | 0.191 | 0.327 | 1.002 | 1.151 | 12.36 | 6dFGS | B | S1 | |
| F105112723 | 10 53 33.3 | 27 39 05 | 0.159 | 0.319 | 0.896 | 1.351 | 12.13 | CTIO | N | S2 | |
| F105333534 | 10 55 40.2 | 35 50 06 | 0.190 | 0.096 | 0.556 | 1.153 | 12.09 | 6dFGS | X | Co | |
| F105493702 | 10 57 18.5 | 37 18 25 | 0.216 | 0.077 | 0.348 | 1.265 | 12.02 | 6dFGS | N | ||
| F110532413 | 11 07 47.0 | 24 29 25 | 0.225 | 0.092 | 0.314 | 2.103 | 12.02 | 6dFGS | N | ||
| F110933353 | 11 11 45.4 | 34 09 35 | 0.231 | 0.102 | 0.318 | 0.894 | 12.05 | 6dFGS | X | SF | |
| F110950238 | 11 12 02.5 | 02 54 18 | 0.106 | 0.418 | 3.249 | 2.531 | 12.30 | 2dFGRS | X | Co | Co(5) |
| F112042154 | 11 22 58.0 | 22 11 02 | 0.248 | 0.114 | 0.264 | 1.263 | 12.04 | 6dFGS | X | ||
| F113000522 | 11 32 41.4 | 05 39 41 | 0.230 | 0.164 | 0.668 | 1.610 | 12.37 | 2dFGRS | X | ||
| F114512128 | 11 47 39.0 | 21 45 06 | 0.219 | 0.182 | 0.375 | 0.859 | 12.07 | 6dFGS | B | S1 | |
| F121312809 | 12 15 42.4 | 28 26 19 | 0.360 | 0.102 | 0.325 | 1.811 | 12.52 | 6dFGS | N | ||
| F124323138 | 12 45 57.2 | 31 54 42 | 0.423 | 0.154 | 0.256 | 0.718 | 12.61 | 6dFGS | N | ||
| F124522032 | 12 47 53.6 | 20 48 24 | 0.209 | 0.203 | 0.383 | 0.988 | 12.03 | 6dFGS | X | ||
| F132692251 | 13 29 40.8 | 23 07 10 | 0.290 | 0.114 | 0.382 | 1.410 | 12.37 | 6dFGS | X |
Table 1. – Continued.
| IRAS name | RA (J2000) | Dec (J2000) | z | sample | class | sub. | known | ||||
|---|---|---|---|---|---|---|---|---|---|---|---|
| F132700331 | 13 29 40.7 | 03 46 59 | 0.221 | 0.306 | 0.954 | 0.797 | 12.48 | 2dFGRS | N | ||
| F133051739 | 13 33 15.2 | 17 55 00 | 0.148 | 0.392 | 1.164 | 1.044 | 12.17 | CTIO | N | S2 | S2(5) |
| F133061644 | 13 33 21.5 | 17 00 22 | 0.231 | 0.208 | 0.298 | 0.752 | 12.02 | 6dFGS | X | ||
| F133352612 | 13 36 22.1 | 26 27 30 | 0.125 | 0.139 | 1.402 | 2.101 | 12.09 | CTIO | X | Co | Co(5) |
| F133790256 | 13 40 33.4 | 03 11 42 | 0.218 | 0.235 | 0.728 | 1.032 | 12.35 | 2dFGRS | X | ||
| F135313422 | 13 56 06.6 | 34 37 02 | 0.220 | 0.135 | 0.380 | 0.777 | 12.08 | 6dFGS | N | ||
| F140213139 | 14 05 02.1 | 31 54 17 | 0.202 | 0.178 | 0.568 | 1.124 | 12.17 | 6dFGS | N | ||
| F140902850 | 14 11 59.2 | 29 05 01 | 0.212 | 0.197 | 0.507 | 0.807 | 12.17 | CTIO | N | S2 | |
| F141210126 | 14 14 45.7 | 01 40 53 | 0.150 | 0.239 | 1.394 | 2.073 | 12.26 | 2dFGRS | X | Co | S2(5)a |
| F142072002 | 14 23 31.5 | 20 15 47 | 0.173 | 0.208 | 0.850 | 1.082 | 12.18 | 6dFGS | N | S2(1) | |
| F142483644 | 14 27 51.7 | 36 58 03 | 0.208 | 0.122 | 0.450 | 1.499 | 12.10 | 6dFGS | X | ||
| F142542655 | 14 28 19.9 | 27 08 49 | 0.253 | 0.206 | 0.534 | 0.809 | 12.37 | 6dFGS | N | S2(1) | |
| F143481447 | 14 37 37.2 | 15 00 20 | 0.082 | 0.495 | 6.870 | 7.068 | 12.39 | 6dFGS | X | SF | Co(5)a |
| F145441302 | 14 57 09.5 | 13 14 55 | 0.254 | 0.265 | 0.309 | 0.761 | 12.13 | CTIO | B | S1 | |
| F151301958 | 15 15 55.5 | 20 09 17 | 0.108 | 0.388 | 1.916 | 2.299 | 12.09 | 6dFGS | N | S2(3) | |
| F160900139 | 16 11 40.9 | 01 47 06 | 0.134 | 0.264 | 3.609 | 4.874 | 12.57 | 6dFGS | X | Co | Co(3)b |
| F161590402 | 16 18 36.3 | 04 09 42 | 0.211 | 0.299 | 0.979 | 1.768 | 12.45 | 6dFGS | N | ||
| F194663649 | 19 49 55.5 | 36 42 06 | 0.093 | 0.316 | 2.425 | 3.378 | 12.05 | 6dFGS | X | SF | |
| F195486237 | 19 59 18.9 | 62 29 18 | 0.351 | 0.081 | 0.365 | 0.823 | 12.55 | 6dFGS | X | ||
| F200235253 | 20 06 08.1 | 52 44 48 | 0.238 | 0.089 | 0.312 | 1.454 | 12.07 | 6dFGS | X | ||
| F200661630 | 20 09 27.7 | 16 22 06 | 0.163 | 0.146 | 0.639 | 1.285 | 12.00 | 6dFGS | X | ||
| F201812244 | 20 21 03.9 | 22 35 22 | 0.184 | 0.199 | 0.568 | 0.885 | 12.07 | 6dFGS | N | ||
| F202483204 | 20 27 59.1 | 31 54 54 | 0.203 | 0.119 | 0.440 | 2.673 | 12.06 | 6dFGS | X | ||
| F202704237 | 20 30 24.9 | 42 27 24 | 0.242 | 0.102 | 0.287 | 0.646 | 12.05 | 6dFGS | N | ||
| F202736558 | 20 31 50.8 | 65 48 22 | 0.349 | 0.155 | 0.430 | 1.151 | 12.61 | 6dFGS | N | ||
| F205421832 | 20 57 03.6 | 18 20 43 | 0.298 | 0.126 | 0.322 | 0.934 | 12.33 | 6dFGS | N | ||
| F205514250 | 20 58 27.3 | 42 38 57 | 0.042 | 1.906 | 12.780 | 9.948 | 12.06 | 6dFGS | X | SF | Co(5)a |
| F210161900 | 21 04 29.8 | 18 48 17 | 0.230 | 0.230 | 0.305 | 1.025 | 12.03 | 6dFGS | N | ||
| F213561015 | 21 38 20.2 | 10 01 57 | 0.206 | 0.159 | 0.460 | 0.550 | 12.09 | 6dFGS | N | ||
| F213672405 | 21 39 36.6 | 23 51 51 | 0.234 | 0.102 | 0.383 | 0.565 | 12.15 | 6dFGS | X | SF | |
| F214353648 | 21 46 31.9 | 36 34 54 | 0.160 | 0.149 | 0.665 | 0.999 | 12.01 | 6dFGS | N | ||
| F214882819 | 21 51 41.4 | 28 05 14 | 0.234 | 0.135 | 0.301 | 0.677 | 12.04 | 2dFGRS | X | ||
| F215424050 | 21 57 21.3 | 40 36 03 | 0.301 | 0.093 | 0.253 | 0.531 | 12.23 | 6dFGS | B | S1 | |
| F215554235 | 21 58 37.5 | 42 21 33 | 0.181 | 0.132 | 0.833 | 0.987 | 12.22 | 6dFGS | X | ||
| F220583501 | 22 08 48.8 | 34 46 38 | 0.173 | 0.162 | 0.561 | 1.375 | 12.01 | 2dFGRS | N | ||
| F222062715 | 22 23 29.4 | 26 59 59 | 0.131 | 0.159 | 1.754 | 2.333 | 12.23 | 2dFGRS | X | Co | Co(5) |
| F223012822 | 22 32 56.7 | 28 07 17 | 0.244 | 0.123 | 0.312 | 0.925 | 12.10 | 2dFGRS | N | ||
| F224234707 | 22 45 20.2 | 46 52 03 | 0.200 | 0.150 | 0.451 | 0.693 | 12.05 | 6dFGS | B | S1 | |
| F225213929 | 22 54 56.5 | 39 13 14 | 0.261 | 0.135 | 0.283 | 0.545 | 12.13 | 6dFGS | N | ||
| F225462637 | 22 57 23.8 | 26 21 23 | 0.163 | 0.166 | 0.752 | 1.362 | 12.08 | 2dFGRS | X | SF(1) | |
| F225603501 | 22 58 46.7 | 34 45 44 | 0.171 | 0.141 | 0.593 | 0.795 | 12.02 | 2dFGRS | X | Co | |
| F230463454 | 23 07 21.3 | 34 38 41 | 0.208 | 0.093 | 0.937 | 1.313 | 12.41 | 2dFGRS | X | ||
| F231285919 | 23 15 46.5 | 59 03 14 | 0.044 | 1.590 | 10.800 | 10.990 | 12.03 | 6dFGS | X | SF | |
| F231420611 | 23 16 49.3 | 05 55 13 | 0.346 | 0.158 | 0.263 | 0.405 | 12.39 | 6dFGS | N | ||
| F231850328 | 23 21 05.9 | 03 12 03 | 0.246 | 0.228 | 0.308 | 0.385 | 12.10 | 6dFGS | N | ||
| F232061222 | 23 23 14.4 | 12 06 29 | 0.249 | 0.255 | 0.246 | 0.689 | 12.01 | 2dFGRS | N | ||
| F232420357 | 23 26 49.1 | 03 41 18 | 0.189 | 0.275 | 0.454 | 0.566 | 12.00 | 6dFGS | X | ||
| F232535415 | 23 28 06.0 | 53 58 26 | 0.129 | 0.214 | 2.296 | 3.493 | 12.34 | 6dFGS | N | LI | |
| F235162420 | 23 54 13.0 | 24 04 05 | 0.154 | 0.283 | 0.834 | 1.240 | 12.06 | 6dFGS | X | ||
| F235292119 | 23 55 33.8 | 21 02 49 | 0.428 | 0.156 | 0.327 | 0.627 | 12.73 | 6dFGS | N | ||
| F235593009 | 23 58 31.0 | 29 52 18 | 0.342 | 0.152 | 0.237 | 0.463 | 12.33 | 2dFGRS | X | ||
| 090223615 | 09 04 12.8 | 36 27 02 | 0.059 | 1.154 | 11.470 | 11.080 | 12.26 | CTIO | X | SF |
Column descriptions: (1) Object name in the IRAS catalogue. (2-3) Right ascension and declination in units of and ° ′ ″, respectively. (4) Redshift. (5-7) The IRAS flux density at 25, 60, and 100 m [Jy]. (8) Infrared luminosity. (1-8) Basic information taken from Hwang et al. (2007) except 090223615, for which information was taken from Sanders et al. (2003). (9) Adopted spectrum. (10) Spectral class in this study (Bbroad-line AGN, Nnarrow-line AGN, Xnon-AGN). (11) Subclass in this study (S1=Seyfert 1, S2=Seyfert 2, LI=LINER, Co=composite, SF=star-forming galaxy). (12) Subclass from previous studies. Numbers in parentheses are references (1=Allen et al. 1991, 2=Duc et al. 1997, 3=Kim et al. 1998, 4=Low et al. 1988, 5=Yuan et al. 2010).
a The spectral types of these objects are different between this study and previous studies.
b This object was classified as a LINER by Kim et al. (1998) using the Veilleux & Osterbrock (1987) scheme.
Table 2. Line information of the Sample A ULIRGs.
| IRAS name | quality | EW | FWHM | ||||||||||||
|---|---|---|---|---|---|---|---|---|---|---|---|---|---|---|---|
| F003352732 | 3333333 | … | 50 | 5. | 81 | 559 | 23 | 0.06 | 0.10 | 0.44 | 0.06 | 0.66 | 0.10 | 0.99 | 0.10 |
| F004562904 | 3333333 | … | 78 | 4. | 75 | 394 | 16 | 0.25 | 0.03 | 0.33 | 0.02 | 0.48 | 0.04 | 1.23 | 0.09 |
| F004822721 | 2323320 | … | 40 | 5. | 44 | 445 | 76 | 0.01 | 0.19 | 0.23 | 0.06 | 0.49 | 0.30 | 0.86 | 0.22 |
| F011644740 | 1103322 | 8.5 | 86 | 10. | 88 | 489 | 168 | 0.04 | 0.45 | 0.71 | 0.16 | 0.75 | 0.25 | … | |
| F014972906 | 3203300 | … | 47 | 4. | 09 | 526 | 74 | 0.06 | 0.23 | 0.18 | 0.12 | … | … | ||
| F015692939 | 3333333 | … | 97 | 5. | 58 | 636 | 8 | 0.32 | 0.03 | 0.02 | 0.02 | 0.28 | 0.06 | 0.63 | 0.03 |
| F023613233 | 3303300 | … | 72 | 5. | 14 | 507 | 21 | 0.03 | 0.10 | 0.54 | 0.10 | … | … | ||
| F025954714 | 2303321 | 3.9 | 25 | 5. | 69 | 493 | 45 | 0.12 | 0.18 | 0.17 | 0.06 | 0.46 | 0.29 | … | |
| F034834704 | 1203311 | 6.5 | 72 | 4. | 78 | 485 | 64 | 0.10 | 0.35 | 0.39 | 0.10 | 0.59 | 0.35 | … | |
| F053483204 | 1323322 | 16.5 | 99 | 4. | 24 | 1351 | 38 | 0.59 | 0.22 | 0.21 | 0.06 | 0.48 | 0.21 | 0.96 | 0.25 |
| F082740147 | 3323333 | 20.4 | 236 | 8. | 18 | 573 | 88 | 0.31 | 0.08 | 0.80 | 0.07 | 0.68 | 0.11 | 1.18 | 0.20 |
| F090611248 | 1103332 | 13.4 | 36 | 7. | 72 | 338 | 145 | 0.29 | 0.38 | 0.30 | 0.10 | 0.43 | 0.23 | … | |
| F100770034 | 2222300 | … | 66 | 4. | 55 | 410 | 56 | 0.03 | 0.25 | 0.44 | 0.21 | … | 0.93 | 0.30 | |
| F105112723 | 2323332 | 12.5 | 25 | 2. | 26 | 837 | 10 | 0.99 | 0.13 | 0.01 | 0.07 | 0.01 | 0.17 | 0.57 | 0.19 |
| F105333534 | 2103300 | … | 201 | 1. | 71 | … | 0.06 | 0.46 | 0.32 | 0.17 | … | … | |||
| F110933353 | 2102200 | … | 36 | 1. | 31 | 636 | 157 | 0.27 | 0.40 | 0.56 | 0.31 | … | … | ||
| F110950238 | 3232322 | … | 54 | 5. | 39 | 409 | 40 | 0.07 | 0.28 | 0.24 | 0.26 | 0.40 | 0.29 | 0.85 | 0.30 |
| F133051739 | 3333330 | 128.5 | 228 | 6. | 15 | 1229 | 9 | 0.96 | 0.08 | 0.27 | 0.05 | 0.57 | 0.04 | 0.98 | 0.06 |
| F133352612 | 2323321 | 9.0 | 58 | 5. | 66 | 418 | 52 | 0.12 | 0.20 | 0.28 | 0.20 | 0.39 | 0.38 | 0.96 | 0.37 |
| F140902850 | 3303332 | 33.3 | 161 | 6. | 76 | 710 | 12 | 0.91 | 0.08 | 0.42 | 0.09 | 0.53 | 0.18 | … | |
| F141210126 | 2103332 | … | 68 | 10. | 40 | 615 | 51 | 0.07 | 0.41 | 0.16 | 0.13 | 0.46 | 0.18 | … | |
| F143481447 | 3333333 | … | 99 | 4. | 68 | … | 0.01 | 0.11 | 0.55 | 0.09 | 0.62 | 0.16 | 1.02 | 0.20 | |
| F160900139 | 2103300 | … | 27 | 2. | 13 | 627 | 176 | 0.32 | 0.40 | 0.05 | 0.17 | … | … | ||
| F194663649 | 2103300 | … | 15 | 3. | 78 | 143 | 120 | 0.37 | 0.43 | 0.42 | 0.10 | … | … | ||
| F205514250 | 3333333 | … | 60 | 3. | 92 | 318 | 13 | 0.17 | 0.03 | 0.53 | 0.04 | 0.44 | 0.05 | 1.07 | 0.06 |
| F213672405 | 3303300 | … | 91 | 1. | 23 | … | 0.10 | 0.11 | 0.52 | 0.13 | … | … | |||
| F220583501 | 1302300 | … | 19 | 13. | 34 | 407 | 20 | 0.97 | 0.17 | 0.09 | 0.33 | … | … | ||
| F222062715 | 2203300 | … | 43 | 6. | 97 | 217 | 76 | 0.06 | 0.19 | 0.36 | 0.05 | … | … | ||
| F225603501 | 2202322 | … | 51 | 3. | 78 | 274 | 66 | 0.15 | 0.32 | 0.42 | 0.29 | 0.48 | 0.28 | … | |
| F231285919 | 3302222 | … | 52 | 2. | 57 | 360 | 19 | 0.33 | 0.17 | 0.69 | 0.41 | 0.60 | 0.31 | … | |
| F232535415 | 3223300 | … | 40 | 2. | 04 | 733 | 99 | 0.07 | 0.30 | 0.01 | 0.06 | … | 0.79 | 0.23 | |
| 090223615 | 3333333 | 154.7 | 164 | 5. | 67 | 547 | 11 | 0.06 | 0.04 | 0.48 | 0.16 | 0.58 | 0.16 | 1.43 | 0.19 |
Column descriptions: (1) Object name in the IRAS catalogue. (2) Line flux qualities at H, [O iii], [O i], H, [N ii], [S ii], and [S ii] (0=unmeasurable, 1=low, 2=moderate, 3=high). (3) Absolute flux of H [10-15 ergs s-1 cm-2]. The values from uncalibrated spectra are not presented. (4) Equivalent width of H [Å]. (5) Observed H/H line ratio. (6) [O iii] line width after instrumental resolution correction and its uncertainty [km s-1]. Line widths below 100 km s-1 are not shown. (7-10) Logarithms of the line ratios and their uncertainties. The ratios are corrected for Galactic extinction and stellar absorption. The internal extinction correction is applied, if available.
Table 3. Line information of the Sample B ULIRGs.
| IRAS name | quality | FWHM | IRAS name | quality | FWHM | ||||||||
|---|---|---|---|---|---|---|---|---|---|---|---|---|---|
| F000503259 | 33 | 378 | 41 | 0.11 | 0.14 | F124323138 | 12 | 701 | 66 | 0.74 | 0.39 | ||
| F000913905 | 12 | 621 | 102 | 0.78 | 0.40 | F124522032 | 33 | 185 | 53 | 0.56 | 0.13 | ||
| F001843331 | 11 | 472 | 141 | 0.43 | 0.38 | F132692251 | 11 | 384 | 93 | 0.05 | 0.51 | ||
| F003183137 | 22 | … | 0.26 | 0.30 | F132700331 | 33 | 1146 | 8 | 0.93 | 0.14 | |||
| F005693108 | 12 | … | 0.84 | 0.52 | F133061644 | 12 | 175 | 48 | 0.53 | 0.34 | |||
| F010042237 | 32 | 850 | 28 | 0.55 | 0.16 | F133790256 | 23 | 310 | 58 | 0.02 | 0.16 | ||
| F010093241 | 33 | 786 | 13 | 1.09 | 0.07 | F135313422 | 23 | 760 | 23 | 0.90 | 0.19 | ||
| F011602551 | 33 | 250 | 54 | 0.15 | 0.09 | F140213139 | 12 | 575 | 87 | 0.31 | 0.37 | ||
| F012125025 | 22 | 908 | 134 | 0.13 | 0.39 | F142072002 | 12 | 448 | 91 | 0.56 | 0.53 | ||
| F012340447 | 22 | … | 0.17 | 0.20 | F142483644 | 12 | 331 | 90 | 0.34 | 0.41 | |||
| F013583300 | 22 | 368 | 18 | 0.25 | 0.09 | F142542655 | 11 | 711 | 61 | 0.62 | 0.45 | ||
| F013793203 | 23 | 1176 | 27 | 0.77 | 0.19 | F151301958 | 12 | 1283 | 75 | 0.72 | 0.47 | ||
| F020380816 | 13 | 277 | 28 | 0.94 | 0.38 | F161590402 | 11 | 833 | 134 | 0.07 | 0.43 | ||
| F020682000 | 22 | … | 0.52 | 0.25 | F195486237 | 11 | 335 | 119 | 0.18 | 0.51 | |||
| F021301948 | 12 | 657 | 83 | 0.27 | 0.29 | F200235253 | 12 | 376 | 135 | 0.03 | 0.35 | ||
| F023564628 | 33 | 569 | 45 | 0.13 | 0.15 | F200661630 | 32 | 134 | 102 | 0.28 | 0.30 | ||
| F023644751 | 33 | 508 | 40 | 0.43 | 0.10 | F201812244 | 33 | 882 | 12 | 0.56 | 0.12 | ||
| F023841744 | 12 | 248 | 66 | 0.07 | 0.43 | F202483204 | 12 | 359 | 120 | 0.29 | 0.54 | ||
| F030002719 | 23 | 664 | 17 | 0.92 | 0.02 | F202704237 | 12 | 696 | 78 | 1.13 | 0.37 | ||
| F031303119 | 11 | 281 | 83 | 0.22 | 0.47 | F202736558 | 13 | 1402 | 70 | 1.07 | 0.30 | ||
| F032593105 | 31 | 256 | 36 | 0.01 | 0.32 | F205421832 | 23 | 418 | 24 | 0.58 | 0.22 | ||
| F034851827 | 33 | 657 | 11 | 0.92 | 0.12 | F210161900 | 12 | 863 | 165 | 0.03 | 0.31 | ||
| F035692535 | 23 | 157 | 37 | 0.17 | 0.19 | F213561015 | 23 | 902 | 12 | 0.50 | 0.20 | ||
| F040565722 | 32 | … | 0.27 | 0.18 | F214353648 | 13 | 557 | 25 | 0.76 | 0.18 | |||
| F042793035 | 23 | 116 | 37 | 0.36 | 0.20 | F214882819 | 33 | 346 | 13 | 0.33 | 0.09 | ||
| F044891026 | 13 | 525 | 53 | 0.44 | 0.19 | F215554235 | 33 | 123 | 32 | 0.09 | 0.14 | ||
| F050202941 | 33 | 154 | 46 | 0.01 | 0.15 | F223012822 | 32 | 1083 | 113 | 0.02 | 0.19 | ||
| F051563024 | 23 | 990 | 28 | 0.76 | 0.17 | F225213929 | 13 | 775 | 79 | 0.31 | 0.40 | ||
| F061584017 | 22 | 767 | 52 | 0.28 | 0.28 | F225462637 | 23 | 194 | 37 | 0.10 | 0.16 | ||
| F084112501 | 31 | 908 | 149 | 0.46 | 0.41 | F230463454 | 33 | 309 | 23 | 0.17 | 0.10 | ||
| F090901349 | 12 | … | 0.07 | 0.52 | F231420611 | 22 | 452 | 51 | 0.50 | 0.38 | |||
| F095210400 | 12 | 845 | 94 | 0.22 | 0.40 | F231850328 | 33 | 956 | 32 | 0.42 | 0.15 | ||
| F102982300 | 23 | 1490 | 71 | 0.99 | 0.24 | F232061222 | 33 | 451 | 5 | 0.46 | 0.15 | ||
| F105493702 | 12 | 491 | 112 | 0.22 | 0.28 | F232420357 | 22 | … | 0.20 | 0.38 | |||
| F110532413 | 13 | 521 | 55 | 0.89 | 0.44 | F235162420 | 21 | … | 0.39 | 0.43 | |||
| F112042154 | 22 | 391 | 87 | 0.02 | 0.36 | F235292119 | 12 | 634 | 106 | 0.50 | 0.51 | ||
| F113000522 | 32 | … | 0.45 | 0.26 | F235593009 | 11 | 485 | 71 | 0.19 | 0.54 | |||
| F121312809 | 23 | 713 | 40 | 0.47 | 0.17 | ||||||||
Column descriptions: (1, 5) Object name in the IRAS catalogue. (2, 6) Line flux qualities at H and [O iii] (0=unmeasurable, 1=low, 2=moderate, 3=high). (3, 7) [O iii] line width after instrumental resolution correction and its uncertainty [km s-1]. Line widths below 100 km s-1 are not presented. (4, 8) Logarithm of [O iii]/H line ratio and its uncertainty. The ratio is corrected only for Galactic extinction and stellar absorption.
We use the emission lines with flux uncertainty 60% for spectral classification. The qualities of line fluxes with uncertainty 20%, 20–40%, and 40–60% are referred to hereafter as high, moderate, and low, respectively (see Tables 2 and 3).
In the sample of 115 ULIRGs, 8 ULIRGs have broad Balmer lines, FWHM of broad component of Balmer lines 2000 km s-1 and height of the broad component 3 times the local rms of the continuum-subtracted spectra. These are considered to be broad-line AGN galaxies222In Table 1, we use the term “Seyfert 1 galaxies” to indicate broad-line AGNs, which is commonly used in previous studies..
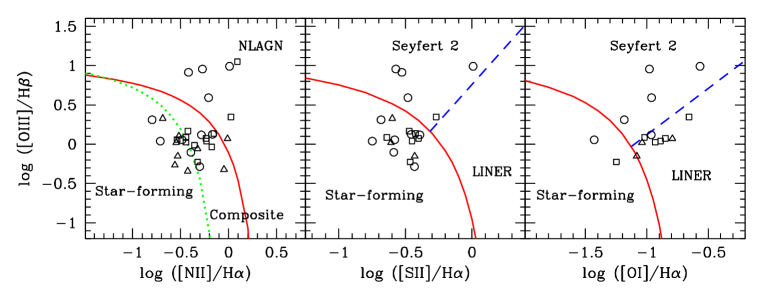
There are 32 narrow emission-line ULIRGs for which more than two line ratios ([O iii]/H and at least one of [N ii]/H, [S ii]/H, and [O i]/H) were measured (hereafter Sample A). In Fig. 2, we show the diagnostic diagrams for these ULIRGs and divide them into star-forming, (starburst-AGN) composite, and narrow-line AGN galaxies based on their loci in the diagrams. Star-forming galaxies lie below the pure star formation line (Kauffmann et al. 2003) in the [N ii]/H diagram and lie below the extreme starburst line (Kewley et al. 2001) in other diagrams. Composite galaxies lie between the extreme starburst line and the pure star formation line in the [N ii]/H diagram. Narrow-line AGNs lie above the extreme starburst line in all three diagrams. Whenever possible, narrow-line AGNs are subdivided into Seyfert 2 and low ionization narrow emission-line region (LINER) galaxies. Seyfert 2 galaxies lie above the Seyfert-LINER classification lines (Kewley et al. 2006) in the [S ii]/H and [O i]/H diagrams, whereas LINERs lie below the lines. For ambiguous galaxies that are classified as one type in two diagrams but another type in the remaining diagram, we adopt the types that are given in the first two diagrams.
There are 75 narrow emission-line ULIRGs without measurable H line mainly because H falls outside the spectral coverage (hereafter Sample B). These galaxies could not be classified in the diagnostic diagrams so that we attempt to classify them in flux ratio between [O iii] and H lines versus [O iii] line width diagram as demonstrated in Fig. 3. Zakamska et al. (2003) used the criteria of ([O iii]/H) 0.3 and FWHM 400 km s-1 to select narrow-line AGN galaxies (dashed line). Using our Sample A and two large, homogeneous samples in the literature (the IRAS 1 Jy ULIRGs: Kim & Sanders 1998; Veilleux et al. 1999; Yuan et al. 2010; the SDSS ULIRGs: Hou et al. 2009), we determine a new boundary to separate narrow-line AGN galaxies from the others (solid line) with high completeness and reliability as far as possible: ([O iii]/H) 0.13 (FWHM/100 km s-1) 0.85. If we regard AGNs classified in the diagnostic diagrams as genuine AGNs, the application of our new boundary provides 89% completeness (among the total 88 AGNs, 78 AGNs are found inside this boundary) and 89% reliability (among 88 objects in the boundary, 78 objects are AGNs), while 68% (60/88) completeness and 90% (60/67) reliability using the criteria of Zakamska et al. The galaxies outside the boundary are mostly star-forming or composite galaxies, but they are not separable from each other in this diagram. They are referred to as non-AGN galaxies.
Our 115 southern ULIRGs contain 8 broad-line AGNs, 49 narrow-line AGNs including four Seyfert 2 and one LINER galaxies, and 58 non-AGNs including thirteen composite and twelve star-forming galaxies. The spectral classification results (and their basic information) are presented in Table 1. Detailed line information of Samples A and B is listed in Tables 2 and 3, respectively.
4 Discussion
4.1 Reliability of our spectral classification
Table 4. AGN fraction as a function of infrared properties
| sample | all | [12.0, 12.15) | [12.15, 12.4) | [12.4, 13.0) |
|---|---|---|---|---|
| This study | 50% of 115 | 48% of 61 | 50% of 40 | 57% of 14 |
| Kim & Sanders (1998) | 45% of 108 | 38% of 40 | 39% of 49 | 79% of 19 |
| Hou et al. (2009) | 55% of 209 | 43% of 90 | 51% of 81 | 89% of 36 |
| sample | all | [1.4, 0.9) | [0.9, 0.5) | [0.5, 0.1) |
| This study | 59% of 37 | 40% of 10 | 47% of 15 | 92% of 12 |
| Kim & Sanders (1998) | 56% of 59 | 29% of 28 | 76% of 25 | 100% of 6 |
| Hou et al. (2009) | 53% of 45 | 33% of 18 | 38% of 13 | 93% of 14 |
| sample | all | [0.7, 0.3) | [0.3, 0.1) | [0.1, 0.3) |
| This study | 40% of 70 | 36% of 11 | 33% of 36 | 52% of 23 |
| Kim & Sanders (1998) | 45% of 108 | 33% of 51 | 56% of 57 | |
| Hou et al. (2009) | 43% of 106 | 58% of 19 | 39% of 61 | 46% of 24 |
The small aperture spectroscopy could not always contain enough light of an extended source to determine its spectral type. For reliable classification, it is suggested to use an aperture covering more than 20% of the galaxy light. The minimum aperture covering fraction of 20% corresponds to 2.1 kpc (see fig. 6 in Kewley et al. 2005). All spectra of ULIRGs in this study satisfy this condition. Therefore, aperture-related effects on our classification are expected to be negligible.
In the 2dFGRS and 6dFGS spectra, the flux for individual line can be unreliable because these spectra are not properly flux-calibrated. Nevertheless, the flux ratio between lines with similar wavelengths is still useful (e.g., Mouhcine et al. 2005; Owers et al. 2007). To ensure this, in Fig. 4, we compare [O iii]/H line ratios derived from both calibrated (i.e., CTIO or SDSS) and uncalibrated (i.e., 2dFGRS or 6dFGS) spectra. It shows that two measurements agree well within the errors. The measurements between the 2dFGRS and 6dFGS spectra also agree well.
Among the 115 ULIRGs, there are 22 objects whose spectral types have been previously determined in the literature. The spectral types for 19 out of 22 ULIRGs determined in this study are consistent with those in the literature. If we compare ULIRGs whose subclasses (see columns 11 and 12 in Table 1) were determined, 9 out of 13 ULIRGs show a good agreement. Although there are three ULIRGs with different types (or four ULIRGs with different subclasses), all of these ULIRGs are composite galaxies either in this study or in the previous studies.

4.2 Dependence of optical properties on infrared parameters
In our sample, 50% (57/115) of the ULIRGs are found to host AGN. The AGN fraction depends on the infrared luminosity and the IRAS flux density ratios (hereafter IRAS colours) as follows: 48% for ULIRGs with 12.0 12.15, 50% for [12.15, 12.4), and 57% for [12.4, 13.0). 40% for ULIRGs with 1.4 0.9, 47% for [0.9, 0.5), and 92% for [0.5, 0.1). 36% for ULIRGs with 0.7 0.3, 33% for [0.3, 0.1), and 52% for [0.1, 0.3). The ULIRGs with a flux upper limit at 25 (100) m are not included in the calculations for IRAS 2560 (60100) m colour dependence. These results are summarized in Table 4 together with those from the 1 Jy (Kim & sanders 1998) and SDSS (Hou et al. 2009) samples. Note that no ULIRGs in the 1 Jy sample have colours of 0.3 due to the selection criteria in Kim & Sanders (1998). The AGN fractions for each sample are comparable in the sense that the differences are less than 1.6 by assuming Poisson errors. In all samples, there is a tendency for the ULIRGs with higher infrared luminosity, warmer IRAS 2560 m colour to be more AGN-like. These findings are consistent with those in previous works (e.g., Veilleux et al. 1999; Kewley et al. 2001; Goto 2005; Cao et al. 2006; Hou et al. 2009; Yuan et al. 2010).
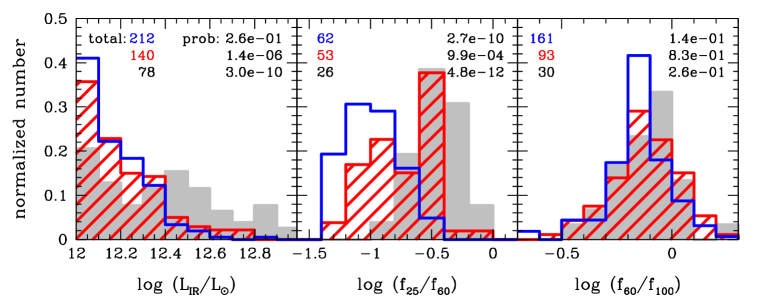
In Fig. 5, we present infrared luminosity, IRAS 2560 m colour, and IRAS 60100 m colour distributions of the combined sample (432 ULIRGs) including this study, Kim & Sanders (1998), and Hou et al. (2009). Based on the Kolmogorov-Smirnov (K-S) test, we find that the infrared luminosity distribution of broad-line AGN ULIRGs is significantly different from those of non-AGN and narrow-line AGN ULIRGs, while those of non-AGN and narrow-line AGN ULIRGs are not so different. We also find that the three types of ULIRGs are significantly different from each other in IRAS 2560 m colour distribution but they are indistinguishable in IRAS 60100 m colour distribution. In IRAS 2560 m colour distribution, the significant difference between AGN and non-AGN ULIRGs strengthens that mid-infrared colour is a good indicator of AGN activity in infrared galaxies (e.g., de Grijp et al. 1985; Neff & Hutchings 1992). The little differences in IRAS 60100 m colour distribution reinforce that star formation dominates the emission of AGN in the far-infrared regime (e.g., Elbaz et al. 2010; Hatziminaoglou et al. 2010; Hwang et al. 2010b; Shao et al. 2010). On the other hand, narrow-line AGN ULIRGs have in general lower infrared luminosity and cooler IRAS 2560 m colour than broad-line AGN ULIRGs do. If we assume that the infrared emission in galaxies is emitted isotropically, and does not depend on viewing angle (e.g., Mulchaey et al. 1994; Schartmann et al. 2008; Gandhi et al. 2009), the difference between narrow-line AGN and broad-line AGN ULIRGs seems not to be compatible with the predictions of the orientation-dependent unification model of AGNs in which narrow-line and broad-line AGNs are intrinsically same objects observed from different angles (Antonucci 1993). This conflict can be explained if narrow-line AGN ULIRGs host a central engine deeply buried by extended, dusty regions of star formation as proposed by several authors (e.g., Genzel et al 1998; Gerssen et al. 2004).
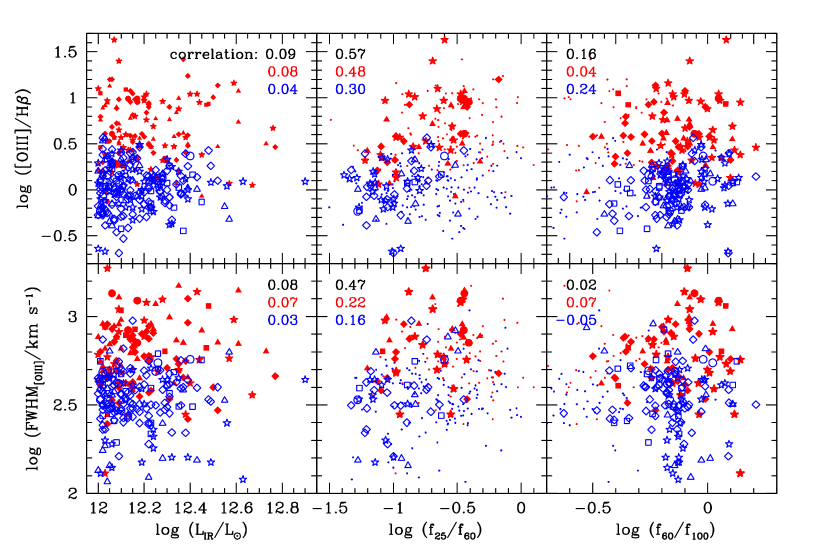
In Fig. 6, we show the relations between optical ([O iii]/H line ratio or [O iii] line width) and infrared (infrared luminosity, IRAS 2560 m colour or IRAS 60100 m colour) properties of the combined ULIRG sample. Broad-line AGN ULIRGs are not plotted because their line widths and fluxes are not properly measured in many cases333 The spectra of broad-line AGNs should be analysed with more sophisticated methods of galaxy modelling (e.g., Kim et al. 2006).. Since the spectral types are determined by the optical emission lines, narrow-line AGNs and non-AGNs are well separated along the y-axis. As expected, clear correlations are found only in the middle panels (see the values of Spearman’s rank correlation coefficients). We checked these relations using various infrared colours from the AKARI all-sky survey point source catalogues444 http://www.ir.isas.jaxa.jp/AKARI/Observation/PSC/Public/ but we could not draw any meaningful results due to the small number of data points.
5 Summary
We studied optical spectral properties of 115 southern ULIRGs using the spectra obtained from our CTIO observations, 2dFGRS, and 6dFGS. For ULIRGs with H measurement, we classified them in the standard diagnostic diagrams. We classified the other ULIRGs using the [O iii]/H line ratio against [O iii] line width diagram with an empirically determined criterion. Main results are summarized below.
-
1.
Our new criterion, ([O iii]/H) 0.13 (FWHM /100 km s-1) 0.85, is successful to separate AGN ULIRGs from non-AGN ULIRGs with completeness and reliability of about 90%.
-
2.
In our sample of the 115 ULIRGs, there are 8 broad-line AGNs, 49 narrow-line AGNs, and 58 non-AGNs. The AGN fraction is 50% and changes as a function of infrared luminosity and IRAS 2560 m colour. These results are consistent with those in previous studies.
-
3.
Using the combined ULIRG sample, we show that the colour distributions of AGN and non-AGN ULIRGs are significantly different in IRAS 2560 m colour and are indistinguishable in IRAS 60100 m colour. These results support that mid-infrared colour is sensitive to AGN activity, whereas far-infrared colour is dominated by star formation.
-
4.
We also show that broad-line AGN ULIRGs differ from narrow-line AGN ULIRGs in infrared luminosity and IRAS 2560 m colour. This presents a challenge to the simple unification model of AGNs.
Acknowledgments
We thank the CTIO staff for their help on the observations. We also thank L. G. Hou for providing the [O iii] line width data of the SDSS ULIRGs. We are grateful to anonymous referee whose comments helped to improve the original manuscript. This work was supported by Mid-career Research Program through NRF grant funded by the MEST (No.2010-0013875). H.S.H acknowledges the support of the Centre National d’Etudes Spatiales (CNES). S.C.K is a member of the Dedicated Researchers for Extragalactic AstronoMy (DREAM) team in Korea Astronomy and Space Science Institute (KASI).
References
- Adelman-McCarthy et al.. (2006) Adelman-McCarthy J. K. et al., 2006, ApJS, 162, 38
- Allen et al. (1991) Allen D. A., Norris R. P., Meadows V. S., Roche P. F., 1991, MNRAS, 248, 528
- Antonucci (1993) Antonucci R., 1993, ARA&A, 31, 473
- Baldwin et al. (1981) Baldwin J. A., Phillips M. M., Terlevich R., 1981, PASP, 93, 5
- Barnes (2004) Barnes J. E., 2004, MNRAS, 350, 798
- Brinchmann et al. (2008) Brinchmann J., Kunth D., Durret F., 2008, A&A, 485, 657
- Bushouse (1987) Bushouse H. A., 1987, ApJ, 320, 49
- Cao et al. (2006) Cao C., Wu H., Wang J. L., Hao C. N., Deng Z. G., Xia X. Y., Zou Z. L., 2006, ChJAA, 6, 197
- Cardelli et al. (1989) Cardelli J. A., Clayton G. C., Mathis J. S., 1989, ApJ, 345, 245
- Clements et al. (1996) Clements D. L., Sutherland W. J., McMahon R. G., Saunders W., 1996, MNRAS, 279, 477
- Colless et al. (2001) Colless M. et al., 2001, MNRAS, 328, 1039
- Dasyra et al. (2006) Dasyra K. M. et al., 2006, ApJ, 638, 745
- de Grijp et al. (1985) de Grijp M. H. K., Miley G. K., Lub J., de Jong T., 1985, Nature, 314, 240
- Duc et al. (1997) Duc P.-A., Mirabel I. F., Maza J., 1997, A&AS, 124, 533
- Elbaz et al. (2010) Elbaz D. et al., 2010, A&A, 518, L29
- Farrah et al. (2007) Farrah D. et al., 2007, ApJ, 667, 149
- Franceschini et al. (2003) Franceschini A. et al., 2003, MNRAS, 343, 1181
- Gandhi et al. (2009) Gandhi P. et al., 2009, A&A, 502, 457
- Genzel et al. (1998) Genzel R. et al., 1998, ApJ, 498, 579
- Genzel et al. (2001) Genzel R., Tacconi L. J., Rigopoulou D., Lutz D., Tecza M., 2001, ApJ, 563, 527
- Gerssen et al. (2004) Gerssen J., van der Marel R. P., Axon D., Mihos J. C., Hernquist L., Barnes J. E., 2004, AJ, 127, 75
- Goto (2005) Goto T., 2005, MNRAS, 360, 322
- Greene & Ho (2005) Greene J. E., Ho L. C., 2005, ApJ, 627, 721
- Hao et al. (2005) Hao L. et al., 2005, AJ, 129, 1783
- Hatziminaoglou et al. (2010) Hatziminaoglou E. et al., 2010, A&A, 518, L33
- Heckman et al. (1981) Heckman T. M., Miley G. K., van Breugel W. J. M., Butcher H. R., 1981, ApJ, 247, 403
- Hopkins et al. (2003) Hopkins A. M. et al., 2003, ApJ, 599, 971
- Hopkins et al. (2006) Hopkins P. F., Somerville R. S., Hernquist L., Cox T. J., Robertson B., Li Y., 2006, ApJ, 652, 864
- Hou et al. (2009) Hou L. G., Wu X., Han J. L., 2009, ApJ, 704, 789
- Hwang et al. (2010a) Hwang H. S., Elbaz D., Lee J. C., Jeong W.-S., Park C., Lee M. G., Lee H. M., 2010a, A&A, 522, A33
- Hwang et al. (2010b) Hwang H. S. et al., 2010b, MNRAS, 409, 75
- Hwang et al. (2007) Hwang H. S., Serjeant S., Lee M. G., Lee K. H., White G. J., 2007, MNRAS, 375, 115
- Imanishi et al. (2010) Imanishi M., Maiolino R., Nakagawa T., 2010, ApJ, 709, 801
- Jones et al. (2005) Jones D. H., Saunders W., Read M., Colless M., 2005, PASA, 22, 277
- Jones et al. (2004) Jones D. H. et al. 2004, MNRAS, 355, 747
- Kauffmann et al. (2003) Kauffmann G. et al., 2003, MNRAS, 346, 1055
- Kewley et al. (2006) Kewley L. J., Groves B., Kauffmann G., Heckman T., 2006, MNRAS, 372, 961
- Kewley et al. (2001) Kewley L. J., Heisler C. A., Dopita M. A., Lumsden S., 2001, ApJS, 132, 37
- Kewley et al. (2005) Kewley L. J., Jansen R. A., Geller M. J., 2005, PASP, 117, 227
- Kim & Sanders (1998) Kim D.-C., Sanders D. B., 1998, ApJS, 119, 41
- Kim et al. (1998) Kim D.-C., Veilleux S., Sanders D. B., 1998, ApJ, 508, 627
- Kim et al. (1998) Kim M., Ho L. C., Im M., 2006, ApJ, 642, 702
- Le Floc’h et al. (2005) Le Floc’h E. et al., 2005, ApJ, 632, 169
- Liu & Kennicutt (1995) Liu C. T., Kennicutt R. C., 1995, ApJS, 100, 325
- Lonsdale et al. (2006) Lonsdale C. J., Farrah D., Smith H. E., 2006, in Mason J. W., ed., Astrophysics Update 2: Topical and Timely Reviews on Astronomy and astrophysics. Springer, Berlin, p.285
- Low et al. (1988) Low F. J., Cutri R. M., Huchra J. P., Kleinmann S. G., 1988, ApJL, 327, 41
- Magnelli et al. (2009) Magnelli B., Elbaz D., Chary R. R., Dickinson M., Le Borgne D., Frayer D. T., Willmer C. N. A., 2009, A&A, 496, 57
- Markwardt (2009) Markwardt C. B., 2009, in Bohlender D. A., Durand D., Dowler P., eds, ASP conf. Ser. Vol. 411, Astron. Soc. Pac., San Francisco, p. 251
- Massey et al. (1988) Massey P., Strobel K., Barnes J. V., Anderson E., 1988, ApJ, 328, 315
- Mihos & Hernquist (1996) Mihos J. C., Hernquist L., 1996, ApJ, 464, 641
- Miller & Owen (2002) Miller N. A., Owen F. N., 2002, AJ, 124, 2453
- Moshir et al. (1992) Moshir M. et al., 1992, Explanatory Supplement to the IRAS Faint Source Survey, Version 2, JPL D-10015 8/92. JPL, Pasadena
- Mouhcine et al. (2005) Mouhcine M., Lewis I., Jones B., Lamareille F., Maddox S. J., Contini T., 2005, MNRAS, 362, 1143
- Mulchaey et al. (1994) Mulchaey J. S. et al., 1994, ApJ, 436, 586
- Nagar et al. (2003) Nagar N. M., Wilson A. S., Falcke H., Veilleux S., Maiolino R., 2003, A&A, 409, 115
- Neff & Hutchings (1992) Neff S. G., Hutchings J. B., 1992, AJ, 103, 1746
- Neugebauer et al. (1984) Neugebauer G. et al., 1984, ApJ, 278, L1
- Osterbrock & Cohen (1982) Osterbrock D. E., Cohen R. D., 1982, ApJ, 261, 64
- Osterbrock & Ferland (2006) Osterbrock D. E., Ferland G. J., 2006, Astrophysics of Gaseous Nebulae and Active Galactic Nuclei, 2nd edn. University Science Books, Mill Valley, CA
- Osterbrock & Mathews (1986) Osterbrock D. E., Mathews W. G., 1986, ARA&A, 24, 171
- Owers et al. (2007) Owers M. S., Blake C., Couch W. J., Pracy M. B., Bekki K., 2007, MNRAS, 381, 494
- Pasquali et al. (2005) Pasquali A., Kauffmann G., Heckman T. M., 2005, MNRAS, 361, 1121
- Risaliti et al. (2006) Risaliti G. et al., 2006, MNRAS, 365, 303
- Sajina et al. (2008) Sajina A. et al. 2008, ApJ, 683, 659
- Sanders et al. (2003) Sanders D. B., Mazzarella J. M., Kim D.-C., Surace J. A., 2003, AJ, 126, 1607
- Sanders & Mirabel (1996) Sanders D. B., Mirabel I.F., 1996, ARA&A, 34, 749
- Sanders et al. (1988) Sanders D. B., Soifer B. T., Elias J. H., Madore B. F., Matthews K., Neugebauer G., Scoville N. Z., 1988. ApJ, 325, 74
- Schartmann et al. (2008) Schartmann M., Meisenheimer K., Camenzind M., Wolf S., Tristram K. R. W., Henning T., 2008, A&A, 482, 67
- Schlegel et al. (1998) Schlegel D. J., Finkbeiner D. P., Davis M., 1998, ApJ, 500, 525
- Shao et al. (2010) Shao L. et al., 2010, A&A, 518, L26
- Soifer et al. (1987) Soifer B. T., Sanders D. B., Madore B. F., Neugebauer G., Danielson G. E., Elias J. H., Lonsdale C. J., Rice W. L., 1987, ApJ, 320, 238
- Tacconi et al. (2002) Tacconi L. J., Genzel R., Lutz D., Rigopoulou D., Baker A. J., Iserlohe C., Tecza M., 2002, ApJ, 580, 73
- Teng et al. (2009) Teng S. H. et al., 2009, ApJ, 691, 261
- Veilleux et al. (1999) Veilleux S., Kim D.-C., Sanders D. B., 1999, ApJ, 522, 113
- Veilleux et al. (2002) Veilleux S., Kim D.-C., Sanders D. B., 2002, ApJS, 143, 315
- Veilleux & Osterbrock (1987) Veilleux S., Osterbrock D. E., 1987, ApJS, 63, 295
- York et al. (2000) York D. G. et al., 2000, AJ, 120, 1579
- Younger et al. (2009) Younger J. D., Hayward C. C., Narayanan D., Cox T. J., Hernquist L., Jonsson P., 2009, MNRAS, 396, 66
- Yuan et al. (2010) Yuan T.-T., Kewley L. J., Sanders D. B., 2010, ApJ, 709, 884
- Zakamska et al. (2003) Zakamska N. L. et al., 2003, AJ, 126, 2125