Molecular Gas in Lensed Quasar Host Galaxies and
the Star
Formation Law for Galaxies with Luminous Active Galactic Nuclei
Abstract
We report the detection of luminous CO(=21), CO(=32), and CO(=43) emission in the strongly lensed high-redshift quasars B1938+666 (=2.059), HE 0230–2130 (=2.166), HE 1104–1805 (=2.322), and B1359+154 (=3.240), using the Combined Array for Research in Millimeter-wave Astronomy. B1938+666 was identified in a ‘blind’ CO redshift search, demonstrating the feasibility of such investigations with millimeter interferometers. These galaxies are lensing-amplified by factors of 11–170, and thus allow us to probe molecular gas in intrinsically fainter galaxies than currently possible without the aid of gravitational lensing. We report lensing-corrected intrinsic CO line luminosities of =0.65–21109 K km s-1 pc2, translating to H2 masses of =0.52–17109 (/0.8). To investigate whether or not the AGN in luminous quasars substantially contribute to , we study the – relation for quasars relative to galaxies without a luminous AGN as a function of redshift. We find no substantial differences between submillimeter galaxies and high- quasars, but marginal evidence for an excess in in nearby low- AGN galaxies. This may suggest that an AGN contribution to is significant in systems with relatively low gas and dust content, but only minor in the most far-infrared-luminous galaxies (in which is dominated by star formation).
Subject headings:
galaxies: active — galaxies: starburst — galaxies: formation — galaxies: high-redshift — cosmology: observations — radio lines: galaxies1. Introduction
Molecular line emission from galaxies at high redshift (2) has proven to be a unique tool to investigate the stellar mass buildup in the often heavily dust-enshrouded star-forming environments of massive galaxies at early cosmic times. Molecular gas (CO) was detected in 26 2 quasar host galaxies to date (see, e.g., review by Solomon & Vanden Bout 2005), all of which are luminous in the rest-frame far infrared (FIR; typically 1013 ; e.g., Wang et al. 2008). These studies typically reveal molecular gas masses of few times 1010 , indicating gas-rich host galaxies for the luminous active galactic nuclei (AGN) that are observed at optical wavelengths. The high FIR luminosities are thought to be dominated by dust heating from young stars formed in intense starburst events comparable to those found in submillimeter galaxies (SMGs), with star formation rates (SFRs) exceeding 1000 yr-1. These starburst are fueled by the massive molecular gas reservoirs, which can maintain them for 107 yr (e.g., Riechers et al. 2008). The connection between gas mass and star formation is reflected in the relation between CO and FIR luminosities (e.g., Sanders et al. 1991; Gao & Solomon 2004), which in turn can be used to constrain the contribution of the AGN to in quasars (e.g., Riechers et al. 2006). The presence of both luminous AGN and massive starbursts make these objects the ideal candidates to better understand the AGN-starburst connection back to early cosmic times.
The currently most efficient way to investigate the molecular gas properties of quasar host galaxies with somewhat less extreme star formation events is by facilitating the flux magnification provided by gravitational lensing. Besides the flux boost, the spatial magnification of lensed quasars also aids in resolving these systems, allowing us to probe the gas reservoirs at smaller physical scales. About one third of the CO-detected 2 quasar host galaxies are gravitationally lensed (9 sources), with typical magnification factors between a few and 30 (Solomon & Vanden Bout 2005). To study the gas properties of high redshift AGN host galaxies in more detail, we here enhance this sample by four galaxies with magnification factors of 10.8–173, including double, quadruple, sextuple, and Einstein ring lens configurations.
In this paper, we report the detection of CO(=21), CO(=32), and CO(=43) emission in the far-infrared-luminous, strongly lensed quasar host galaxies of B1938+666 (=2.059), HE 0230–2130 (=2.166), HE 1104–1805 (=2.322), and B1359+154 (=3.240), using the Combined Array for Research in Millimeter-wave Astronomy (CARMA). We use a concordance, flat CDM cosmology throughout, with =71 km s-1 Mpc-1, =0.27, and =0.73 (Spergel et al. 2003, 2007).
2. Observations
| target | line | aaTuning frequency (where applicable), corresponding to zero velocity in Figs. 1 and 7. | sideband | configuration | dates | tracks | calibrator | /bbTime on source/total. | |
|---|---|---|---|---|---|---|---|---|---|
| [GHz] | [hr] | ||||||||
| B1938+666 | CO(=21) | — | 75.3638 | C/D/E | 2010 Jul 05–Oct 10 | 3/10/4 | 1849+670 | 43.6/69.9 | |
| CO(=32) | 113.0425 | ||||||||
| HE 0230–2130 | CO(=32) | 2.163 | 109.360 | USB | D | 2009 Aug 01–Sep 02 | 5 | 0132–169 | 13.3/22.9 |
| 0204–170 | |||||||||
| HE 1104–1805 | CO(=32) | 2.319 | 104.155 | USB | C | 2010 Mar 21/22 | 2 | 1127–189 | 6.6/10.6 |
| B1359+154 | CO(=32) | 3.235 | 81.652 | LSB | D/E | 2009 Jul 07–Aug 15 | 1/2 | 1357+193 | 5.9/10.6 |
| CO(=43) | 108.864 | USB | D/E | 2009 Jun 29–Jul 27 | 2/2 | 7.2/13.3 | |||
| total | 31 | 76.6/127.3 |
2.1. Targeted CO Searches
We used CARMA to observe the CO(=32) transition line (=345.7960 GHz) toward the 2 quasars HE 0230–2130, HE 1104–1805, and B1359+154, and the CO(=43) line (=461.0408 GHz) toward B1359+154, all of which are redshifted to the 3 mm atmospheric window (see Tab. 1 for redshifted frequencies). All targets were observed with 14 or 15 antennas (corresponding to 91 or 105 baselines per antenna configuration) for a total of 14 tracks in the C, D, and E configurations between 2009 June 29 and 2010 March 22, amounting to a total observing time of 57 hr (33 hr on source).
Weather conditions scaled between acceptable and excellent for observations at 3 mm wavelengths. The nearby quasars J0132–169, J0204–170, J1127–189, and J1357+193 were observed every 15 minutes for secondary amplitude and phase calibration. The strong calibrator sources J0423–013, J1058+015, 3C446, and 3C273 were observed at least once per track for bandpass and secondary flux calibration. Absolute fluxes were bootstrapped relative to Mars, Uranus, MWC349, or 3C84 (when no planet was available). Pointing was performed at least every 2–4 hr on nearby sources, using both radio and optical modes. The resulting total calibration is estimated to be accurate within 15%.
All observations were carried out with the previous generation correlator. The CO(=32) line in B1359+154 was centered in the lower sideband (LSB). All other lines were centered in the upper sideband (USB), at intermediate frequencies of 2.5 GHz. Three bands with 15 channels of 31.25 MHz (86–115 km s-1) width each were centered on the tuning frequencies. The bands were overlapped by 2 channels to improve calibration of the correlated dataset, leading to an effective bandwidth of 1281.25 MHz (3500–4700 km s-1) per sideband.
For data reduction and analysis, the MIRIAD package was used. The final plots were created with the GILDAS package. All data were imaged using ‘natural’ weighting, yielding synthesized beam sizes of 7.3′′4.2′′, 2.5′′1.9′′, 10.1′′7.8′′, and 9.4′′6.8′′ for the CO(=32) observations in HE 0230–2130, HE 1104–1805, and B1359+154 and the CO(=43) observations of B1359+154, respectively. The final rms noise values are 0.52, 0.65, 0.97, and 0.71 mJy beam-1 over 1114, 450, 344, and 430 km s-1 (406.25, 156.25, 93.75, and 156.25 MHz). Averaging over all line-free data (LSB+USB) in the observations of B1359+154 (both line setups) yields a beam size of 9.8′′7.3′′ and an rms noise of 0.12 mJy beam-1.
2.2. ‘Blind’ CO Search
We also used CARMA to observe the very submillimeter-bright, radio-loud quasar B1938+666, for which the redshift was previously unknown. Thus, we searched the entire frequency range from 82.4 to 115.3 GHz for CO line emission, facilitating the large bandwidth of 3708.096 MHz per sideband (eight bands with 95 channels of 5.208 MHz with per sideband, overlapping bands by typically 6 channels to reduce sensitivity losses due to bandpass rolloff) of the new correlator. Observations were carried out for 14 tracks in the D and E configurations between 2010 July 05 and September 08, amounting to a total observing time of 58 hr (37 hr on source). A total of 6 (partially overlapping) frequency settings were used to cover the 82.4–115.3 GHz frequency range. Observations were typically carried out in pairs of frequency settings with an IF frequency of 3.6 GHz, where the LSB of the second setup was used to fill the gap between sidebands of the first setup (and, vice versa, the USB of the first setup fills the IF gap of the second setup) to achieve continuous frequency coverage.
After identification of a CO line, a seventh frequency setup was used to observe a second CO line, redshifted to 75.4 GHz, for confirmation. This frequency is almost 10 GHz below the nominal tuning range of CARMA’s 3 mm receivers (85–116 GHz). We thus placed the line in the LSB, using the extended IF range with an IF frequency of 7.5 GHz (same bandwidth as above), and placing the local oscillator (LO) at 82.874 GHz.111The USB falls into the frequency range covered by the previous setups. With this setup, we successfully extended the covered frequency range down to 74.1 GHz, with decreasing sensitivity below 76 GHz. These observations were carried out for 3 tracks in C configuration between 2010 September 27 and October 10, amounting to a total observing time of 12 hr (6.6 hr on source).
Weather conditions scaled between acceptable and excellent for observations at 3 mm wavelengths. The nearby quasar J1849+670 was observed every 12–20 minutes for secondary amplitude and phase calibration. The strong calibrator sources J1751+096, J2015+372, 3C273, 3C345 and 3C454.3 were observed at least once per track for bandpass and secondary flux calibration. Absolute fluxes were bootstrapped relative to Neptune and Mars. Pointing was performed at least every 2–4 hr on nearby sources, using both radio and optical modes. The resulting total calibration is estimated to be accurate within 15% (20% for setup 7).
| target | line | aaLine brightness temperature ratio CO(=n+1n)/CO(=nn–1), where n=2/3 (=1: thermalized). | ||||
|---|---|---|---|---|---|---|
| [mJy] | [ km s-1] | [Jy km s-1] | ||||
| B1938+666 | CO(=21) | 2.05900.0003 | 9.92.6 | 366124 | 3.81.1 | 1.00.3 |
| CO(=32) | 16.31.8 | 52975 | 9.11.1 | |||
| HCN(=32) | (3.11.1) | (496192)bbFixed to a common linewidth. The width of the C2H line is corrected for broadening due to hyperfine structure. | (1.620.54)⋆ | |||
| HCO+(=32) | (1.61.1) | (496192)bbFixed to a common linewidth. The width of the C2H line is corrected for broadening due to hyperfine structure. | (0.860.45)⋆ | |||
| HNC(=32) | (1.91.1) | (496192)bbFixed to a common linewidth. The width of the C2H line is corrected for broadening due to hyperfine structure. | (1.000.46)⋆ | |||
| C2H(=32) | (1.71.1) | (496192)bbFixed to a common linewidth. The width of the C2H line is corrected for broadening due to hyperfine structure. | (0.890.46)⋆ | |||
| CN(=32) | (1.51.1) | (1.00.7)⋆ | ||||
| HE 0230–2130 | CO(=32) | 2.16640.0005 | 11.11.5 | 705123 | 8.31.2 | |
| HE 1104–1805 | CO(=32) | 2.32210.0004 | 16.12.4 | 44181 | 7.51.2 | |
| B1359+154 | CO(=32) | 3.23990.0003 | 5.61.7 | 19892 | 1.20.4 | 1.20.5 |
| CO(=43) | 10.01.6 | 23747 | 2.50.4 |
Note. — ⋆: Considered not detected. Corresponds to 3 upper limits of 1.6 (HCN), 1.4 (HCO+, HNC, C2H), and 2.1 Jy km s-1 (CN).
For data reduction and analysis, the MIRIAD package was used. The final plots were created with the GILDAS package. All data were imaged using ‘natural’ weighting, yielding synthesized beam sizes of 2.8′′2.3′′ and 4.5′′3.9′′ at 75.4 and 113.0 GHz, and 4.5′′4.0′′ over the full, 41.2 GHz wide bandpass (with a small gap around 80 GHz, and excluding line emission). Due to varying effective exposure time, atmospheric conditions and receiver noise, the sensitivity varies somewhat over the full spectral bandpass, in particular toward the edges of the 3 mm band. The final rms noise values are 24 Jy beam-1 over the full bandpass, 0.77 mJy beam-1 over 203 MHz (808 km s-1) at 75.4 GHz, and 0.52 mJy beam-1 over 292 MHz (773 km s-1) at 113.0 GHz.
3. Results
3.1. B1938+666
3.1.1 Previous Results
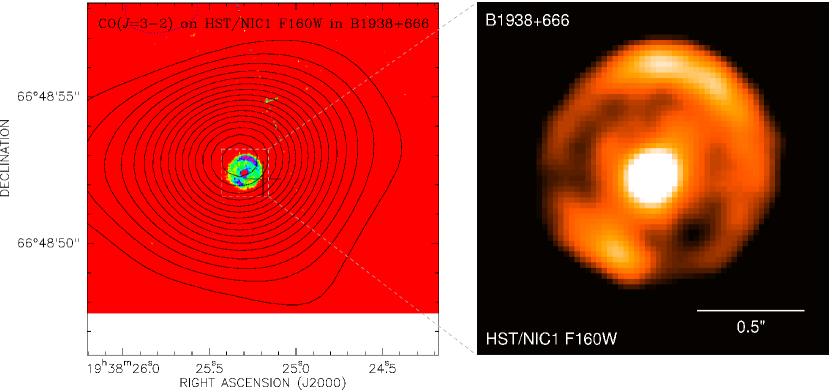
B1938+666 is a radio-selected gravitational lens with a small image separation of only 0.95′′ in the radio continuum emission associated with its radio-loud active galactic nucleus (AGN; Patnaik et al. 1992). The bright radio continuum emission (0.5770.017 Jy at 1.4 GHz) is lensed into at least 3 components that break up into 7 subcomponents along a partial Einstein ring, some of which show polarized emission (King et al. 1997). The radio components show a relatively steep spectral index that varies between the different subcomponents (=–(1.0–0.5) from 1.612 to 5 GHz), suggesting a superposition of flat and steep spectrum emission associated with lensed core and jet emission. Its 1.6 m continuum emission is lensed into a full, almost perfectly symmetric Einstein ring with 0.95′′ diameter, but only the foreground lensing galaxy is detected at band and shorter wavelengths (King et al. 1998). This shows that B1938+666 has properties that are clearly different from optically-selected, gravitationally lensed quasars. The lensing galaxy has a spectroscopic redshift of =0.881, suggesting 1.7 for B1938+666 based on the lensing configuration, with a most likely redshift of =2.8 (Tonry & Kochanek 2000). Until now, the redshift of B1938+666 was highly uncertain. In addition to its radio-loud AGN, B1938+666 also hosts a luminous dust bump, with =12622 mJy, =34.62.0 mJy, and =14.72.0 mJy (Barvainis & Ivison 2002). Correcting for synchrotron emission from the AGN, Barvainis & Ivison (2002) estimate that 32.06.7 mJy of the 850 m emission are due to dust heating, likely dominated by star formation. They also find a model-based lensing magnification factor of =173. Its extreme submillimeter brightness, dust obscuration in the optical and small Einstein radius (making optical spectroscopic redshift searches unfeasible) make B1938+666 an ideal candidate to attempt a ‘blind’ CO redshift search.
3.1.2 New Results: ‘Blind’ CO Redshift and Line Emission
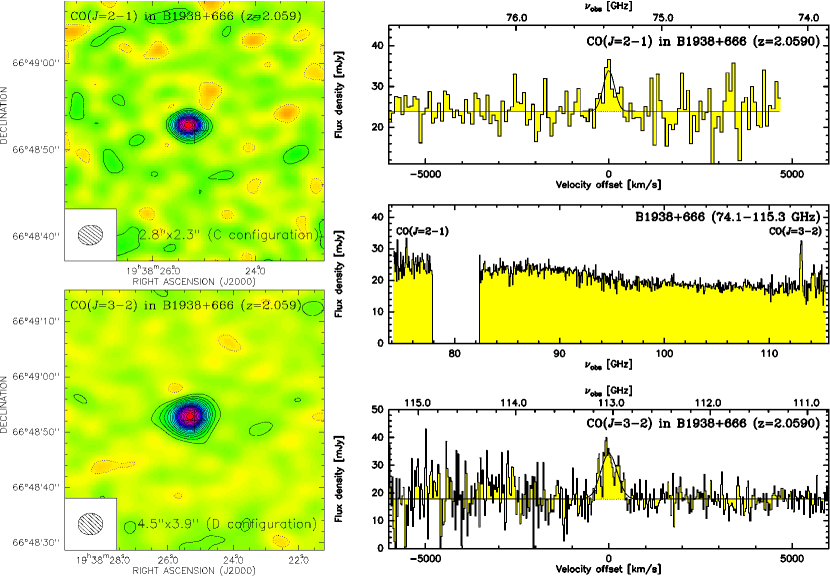
Scanning the whole 3 mm band from 82.4–115.3 GHz, we have identified a single CO line in B1938+666 at 113.0425 GHz. The lack of detecting a second, lower- CO line at 82.4113.0 GHz rules out any candidate redshifts at 3.0. Assuming a lower limit of =1.7 as suggested by the lensing configuration, this leaves CO(=32) emission at =2.059 as the only likely explanation for the detected line emission. We confirmed this conclusion through a subsequent detection of CO(=21) emission at 75.3638 GHz.
In Fig. 1, the full covered spectral range is shown, along with higher spectral resolution, zoomed-in spectra of the emission lines, and emission line maps (continuum not subtracted). As both redshifted CO lines are close to the edges of the 3 mm band, the noise across the zoomed-in spectra is not flat, and substantially increases below 75 GHz and above 114 GHz. From Gaussian fitting to the line profiles, we derive line peak flux densities of =9.92.6 and 16.32.8 mJy at FWHM widths of =366124 and 52975 km s-1 for the CO(=21) and CO(=32) lines, respectively (see Tab. 2). The line widths are consistent within the errors. A comparison of the line profiles may suggest more complex structure than a single Gaussian, but more sensitive observations are required to investigate this in more detail. The observed-frame peak velocities correspond to a median redshift of =2.05900.0003. We find velocity-integrated CO(=21) and CO(=32) line fluxes of =3.81.1 and 9.11.1 Jy km s-1. The line brightness temperature ratio of =1.00.3 is consistent with optically thick, thermalized emission within the errors, consistent with what is found in other high- quasars (e.g., Riechers et al. 2006).
We derive a lensing-corrected CO line luminosity of =1.3109 (/173)-1 K km s-1 pc2. Assuming a conversion factor of
=0.8 (K km s-1 pc2)-1 from to gas mass for ultra-luminous infrared galaxies (ULIRGs; Downes
& Solomon 1998), we find
=1.0109 (/173)-1 (/0.8) (see
Tab. 3). In their analysis, Barvainis & Ivison
(2002) introduce a cutoff in of a factor of
20, which may be more appropriate if the gas reservoir extends over a
100 pc size region. Under this assumption, and
would be 8 higher, but still at the low
end of observed values at high .
3.1.3 New Results: Constraints on HCN, HCO+, HNC, C2H, and CN Line Emission
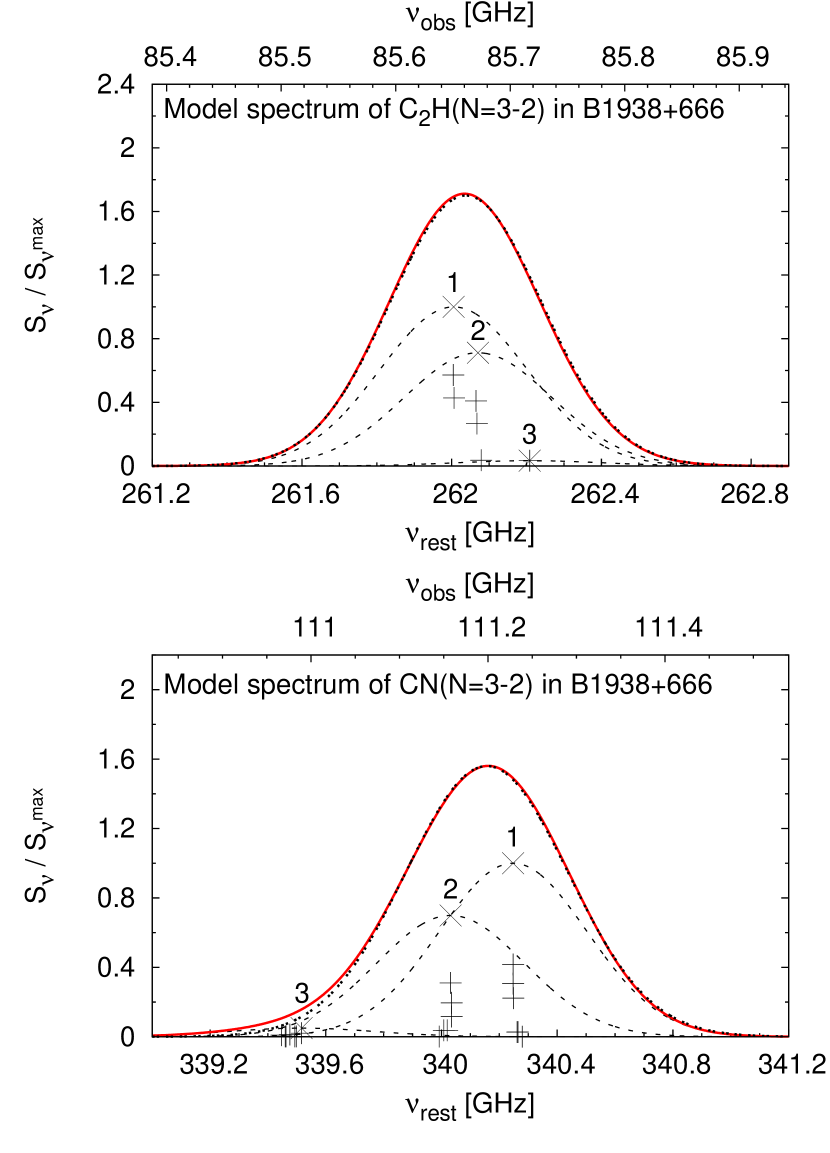
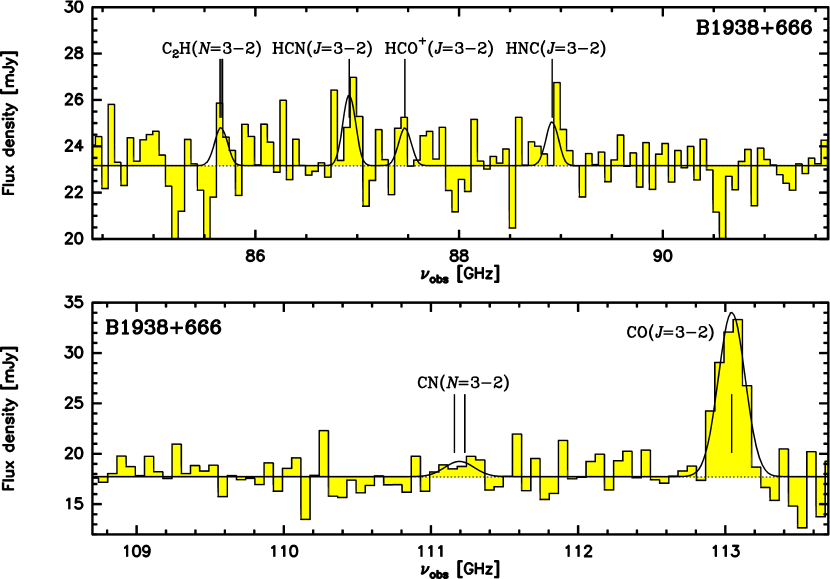
Based on the firm CO redshift, we went back to the spectrum to search for emission from dense molecular gas tracers. Fixing the redshift to =2.0590 and all four lines to a common width (the width of the C2H line was corrected up by 2.6% to account for hyperfine structure; see Fig. 2; and Riechers et al. 2007a, 2009a, for more details on the fitting procedure), we simultaneously fitted Gaussian line profiles at the redshifted frequencies of HCN(=32), HCO+(=32), HNC(=32), and C2H(=32) emission,222The rest frequencies of the HCN, HCO+, and HNC(=32) lines are =265.886180, 267.557619, and 271.981142 GHz. The C2H(=32) line has six spectrally distinguishable hyperfine components at =262.004227–262.208439 GHz (see Fig. 2). adding one free parameter to fit the underlying continuum (see Fig. 3). We find =3.11.1, 1.61.1, 1.91.1, and 1.71.1 mJy at a common =496192 km s-1 for the HCN, HCO+, and HNC(=32) and C2H(=32) lines, respectively. This corresponds to =1.620.54, =0.860.45, =1.000.46, and =0.890.46 Jy km s-1, respectively. We also searched for CN emission, simultaneously fitting the CN(=32) and CO(=32) lines and the underlying continuum emission (see Fig. 3). The width of the CN line was corrected up by 10% to account for hyperfine structure (see Fig. 2).333The CN(=32) line has 19 spectrally distinguishable hyperfine components at =339.446777–340.279166 GHz (see Fig. 2). The fit yields =1.51.1 mJy. corresponding to =1.00.7 Jy km s-1.
The HCN(=32) line is marginally detected at 3.0 level, but we conservatively treat it as an upper limit in the following. The other four lines yield 1.4–2.2 signals, and thus are not detected. Translating their fluxes to 3 upper limtis yields 1.4 (HCO+, HNC, C2H) and 2.1 Jy km s-1 (CN). Given that the simultaneously fitted HCN, HCO+, HNC, and C2H lines all yield positive signals at 1.9–3.0 level, we attempted to stack their spectra. This yields a weighted average flux of 1.050.24 Jy km s-1, corresponding to a signal of 4.4 significance. This stacked signal corresponds to 19%5% of the CO(=32) luminosity (i.e., not corrected for line excitation). This is consistent with the median HCN/CO ratios (a measure of the dense gas fraction in galaxies) in nearby ULIRGs and 2 quasars (e.g., Gao et al. 2007; Riechers et al. 2007b).
3.1.4 New Results: Continuum Emission
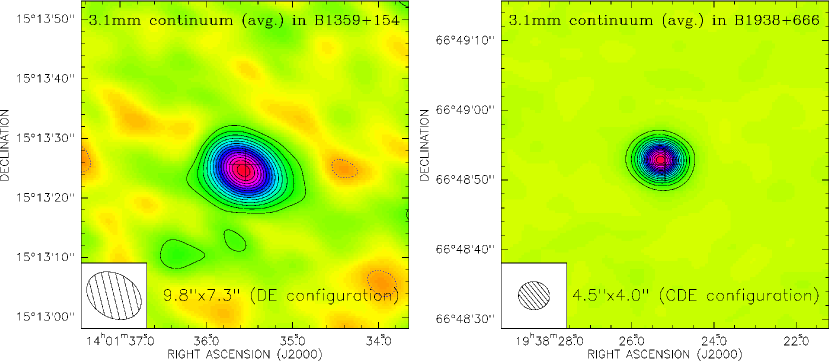
As shown in Fig. 1, we detect continuum emission toward B1938+666 over the entire observed wavelength range. Simultaneous fits to the line and continuum emission suggest continuum strengths of 23.890.32 and 17.760.26 mJy below the CO(=21) and CO(=32) lines, and 23.150.15 mJy below the HCN(=32), HCO+(=32), HNC(=32), and C2H(=32) lines. The strength and slope of the emission is consistent with synchrotron emission from the radio-loud AGN. The spectrum may suggest a more complex continuum slope than a simple power law. However, due to variability of the phase calibrator over the 4 month course of the observations, there is a residual uncertainty in the flux calibration between the different frequency settings. We thus conclude that the continuum slope is consistent with a power law within the errors. By averaging the line-free channels over the entire observed frequency range and fitting a 2-dimensional Gaussian to the data, we find a 3.1 mm continuum flux of 20.840.14 mJy. In Fig. 4, a map of the averaged continuum emission is shown. From the fit, we also find a continuum size of (1.48′′0.05′′)(1.10′′0.05′′) at a position angle of 85∘5∘. Accounting for interferometric seeing (which is not part of the above errors), this is consistent with the 0.95′′ diameter of the Einstein ring, and the continuum emission to be dominated by the radio-loud AGN.
3.1.5 Origin of the CO/Continuum Emission
| Source | aaAdopted from Barvainis & Ivison 2002. | bbApparent luminosities (not corrected for lensing)/intrinsic luminosities (lensing–corrected).,cc calculated assuming similar SED shapes as for the Cloverleaf quasar (Weiß et al. 2003). | bbApparent luminosities (not corrected for lensing)/intrinsic luminosities (lensing–corrected).,ddExtrapolated to CO(=10) luminosity by correcting for excitation, based on excitation modeling of high- quasars (Riechers et al. 2006, 2009a). Corrections applied: 0% for CO(=21), 2% for CO(=32), 6% for CO(=43). | / | eeAssuming a conversion factor of M/K km s-1pc2 from to as appropriate for ULIRGs (see Downes & Solomon 1998). | SFRffAssuming (Kennicutt 1998a; 1998b): SFR[M⊙ yr-1][L⊙], i.e., following the notation of Omont et al. 2001: describes the dependence on the mass function of the stellar population, gives the fraction of that is actually powered by the starburst and not the AGN. | ggGas depletion timescales, defined as =/SFR. | |
|---|---|---|---|---|---|---|---|---|
| [Gpc] | [10L⊙] | [10K km s-1pc2] | [L⊙/K km s-1pc2] | [1010 M⊙] | [M⊙ yr-1] | [Myr] | ||
| B1938+666 | 16.31 | 173 | 33/0.19 | (22.02.5)/0.13 | 150 | 0.10 | 30 | 35 |
| HE 0230–2130 | 17.36 | 14.5 | 21/1.5 | (21.93.1)/1.5 | 100 | 1.2 | 220 | 55 |
| HE 1104–1805 | 18.91 | 10.8 | 16/1.5 | (22.43.4)/2.1 | 70 | 1.7 | 220 | 75 |
| B1359+154 | 28.36 | 118 | 11/0.093 | (7.71.2)/0.065 | 140 | 0.052 | 14 | 40 |
In Figure 5, an overlay of the CO(=32) and underlying continuum emission on top of observed-frame 1.6 m continuum emission in B1938+666 is shown (Hubble Space Telescope (HST) image from King et al. 1998; all HST images are data products from the Hubble Legacy Archive).444http://hla.stsci.edu/ The peak of the CO/continuum emission is consistent with the brightest rest-frame optical (523 nm) emission region along the Einstein ring. This suggests that the optical and (rest frame) (sub-)millimeter emission (observed frame 2.6–4.0 mm) are likely cospatial, with the optical emission being dominated by stellar light above the Balmer break. The lack of pointlike images along the Einstein ring suggest that the radio-loud AGN is optically obscured (or, alternatively, has low optical luminosity). The strength and spectral slope of the rest-frame submillimeter continuum emission make it unlikely that the AGN is much less magnified than its host galaxy. Thus, B1938+666 likely hosts a type-2 AGN along with its starburst.
3.1.6 Absorption Line Searches
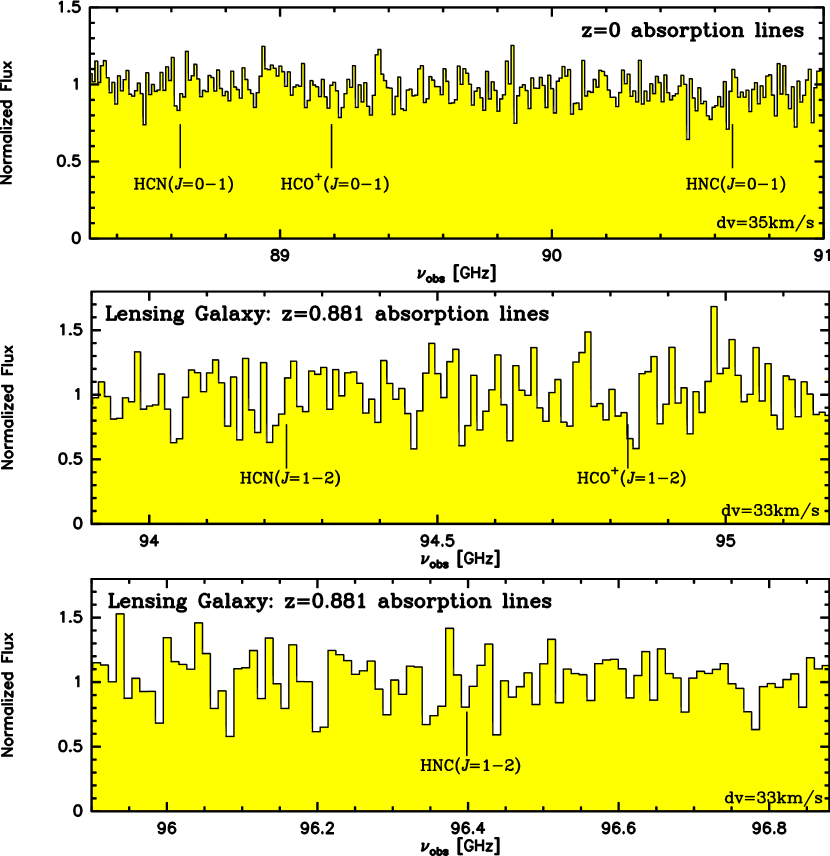
Given the high 3 mm continuum flux of B1938+666, we have searched the spectrum for absorption lines from foreground sources. In Fig. 6, three spectral regions are shown that cover the absorption line frequencies of HCN(=10), HCO+(=10), and HNC(=10) in the Milky Way (i.e., at =0), and of HCN(=21), HCO+(=21), and HNC(=21) at =0.881, the redshift of the lensing galaxy. HCN, HCO+, or HNC are abundant molecules typically found in dense regions, and typically produce some of the deepest absorption features (e.g., Wiklind & Combes 1995, 1996). The spectra are normalized to an arbitrary flux scale, and re-binned to 10.416 MHz (35 and 33 km s-1), to enable searches for narrow lines from compact molecular structures. At this resolution, the continuum emission is detected in every single velocity channel, but at relatively moderate signal-to-noise ratio. We do not detect any absorption lines. Assuming a velocity width that is at least comparable to the resolution of these spectra, this suggests that 20% of the continuum emission of B1938+666 are absorbed by Galactic or nearby extragalactic foreground structures, and 40% are absorbed by molecular gas (HCN, HCO+, or HNC) in the lensing galaxy.
3.2. HE 0230–2130: The Southern Cloverleaf
3.2.1 Previous Results
HE 0230–2130 is an optically selected, quadruply lensed quasar at an optical redshift of =2.1630.003 with a maximum image separation of 2.15′′ (Wisotzki et al. 1999; Anguita et al. 2008), similar to the well-known Cloverleaf quasar (Magain et al. 1988). It is lensed by two galaxies at almost identical redshift (=0.5230.001, =0.5260.002; Eigenbrod et al. 2006). This ‘Southern Cloverleaf’ is radio-quiet, but has a luminous dust bump, with =7713 mJy and =21.02.2 mJy. These fluxes are 35% of those found for the Cloverleaf, and consistent with the same spectral slope (Barvainis & Ivison 2002). Barvainis & Ivison find a model-based lensing magnification factor of =14.5, which is similar to that of the Cloverleaf (=11; Venturini & Solomon 2003). HE 0230–2130 also exhibits luminous emission from polycyclic aromatic hydrocarbons (PAHs; Lutz et al. 2008). Together, these properties suggest the presence of a substantial molecular gas reservoir.
3.2.2 New Results
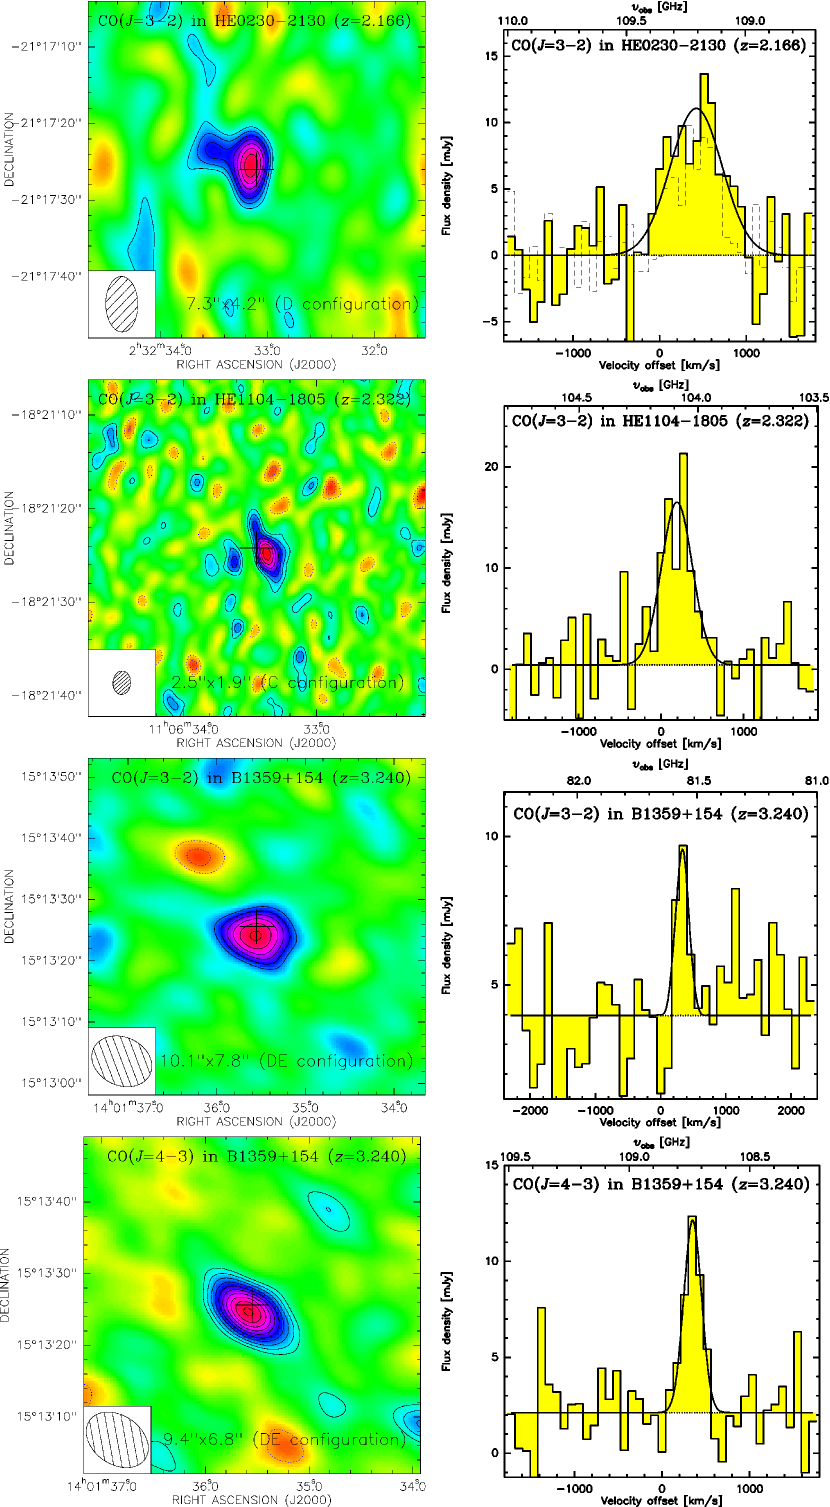
We detect luminous, marginally resolved CO(=32) emission toward HE 0230–2130 at 9 significance (Fig. 7). From Gaussian fitting to the line profile, we find =11.11.5 mJy and =705123 km s-1, corresponding to =8.31.2 Jy km s-1(see Tab. 2). We do not detect the underlying continuum down to a 2 limit of 1.5 mJy. The CO line emission yields a host galaxy redshift of =2.16640.0005, which is consistent with the optical redshift of the quasar within the errors (d=–0.003).
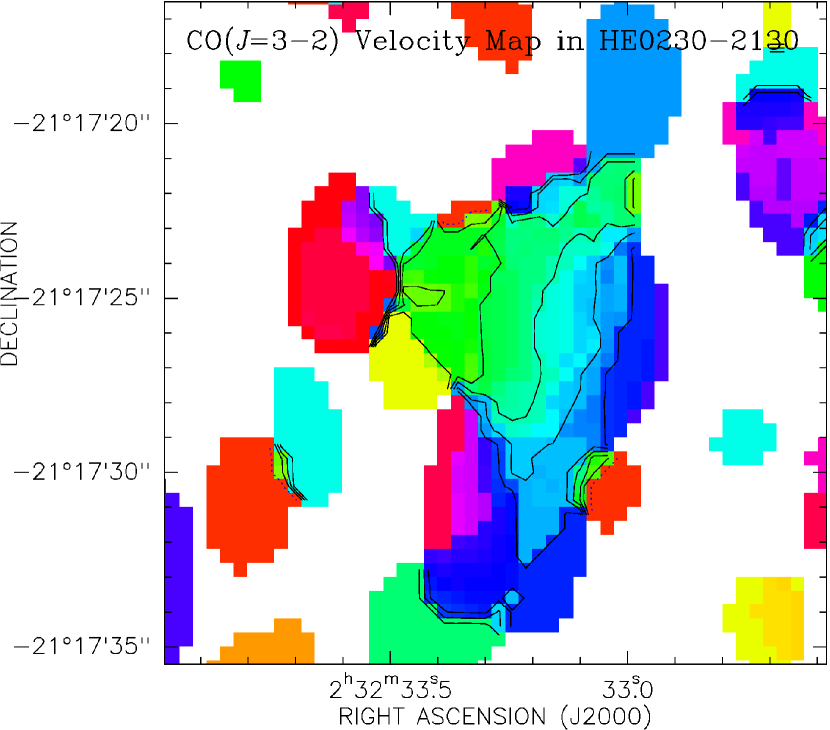
The CO line emission in HE 0230–2130 appears resolved both spatially and in velocity. There is a clear difference between the CO line width at peak position (dashed spectrum in Fig. 7) and the spatially integrated line width. In Figure 8, a first moment map is shown (clipped below 1 in the individual velocity channels). Despite the moderate signal-to-noise ratio of this map, a clear velocity gradient is apparent. Accounting for beam convolution, the spatial and velocity structure is consistent with the lensed size of the source as defined by the maximum images separation of 2.15′′ within the uncertainties.
Assuming a 2% correction for subthermal excitation of the CO(=32) line555This model-based, small correction factor is not statistically significant, but applied for consistency with estimates based on higher- lines, as described below. Within the uncertainties of our measurements, the CO(=32) lines in our targets are consistent with thermal excitation. (based on CO line radiative transfer modeling of high- quasars, e.g., Riechers et al. 2006; 2009b) we derive =1.51010 (/14.5)-1 K km s-1 pc2, and =1.21010 (/14.5)-1 (/0.8) (see Tab. 3).
3.3. HE 1104–1805
3.3.1 Previous Results
HE 1104–1805 is an optically selected double image quasar with a lens image separation of 3.19′′ at an optical redshift of =2.31920.0007 (Wisotzki et al. 1995; Sulentic et al. 2006). It is lensed by a galaxy at =0.7290.001 (Lidman et al. 2000). Its host galaxy is lensed into an Einstein ring (Peng et al. 2006). It has a supermassive black hole mass of =2.4109 , and follows the relation between black hole mass and rest-frame -band luminosity of the host galaxy (–) for 1.7 galaxies (Peng et al. 2006). Estimating its bolometric AGN luminosity from its and -band magnitude (Peng et al. 2006), HE 1104-1805 follows the – relation for PG quasars, and is consistent with the values found for other high- FIR-luminous quasars within the uncertainties (e.g., Omont et al. 2003; Wang et al. 2008; see Tab. 3 for ). HE 1104–1805 is radio-quiet, but has a luminous dust bump, with =14.83.0 mJy and =5.30.9 mJy. It is magnified by a factor of =10.8 (Barvainis & Ivison 2002). It also exhibits luminous PAH emission (Lutz et al. 2008).
3.3.2 New Results
We detect luminous, spatially resolved CO(=32) emission toward both lens images of HE 1104–1805 at 8 and 4 significance (Fig. 7). From Gaussian fitting to the line profile, we find =16.12.4 mJy and =44181 km s-1, corresponding to =7.51.2 Jy km s-1 (see Tab. 2). We do not detect the underlying continuum down to a 2 limit of 1.5 mJy. The CO line emission yields a host galaxy redshift of =2.32210.0004, which is close to the optical redshift of the quasar (d=–0.003).
Assuming a 2% correction for subthermal excitation of the CO(=32) line, we derive =2.11010 (/14.5)-1 K km s-1 pc2, and =1.71010 (/10.8)-1 (/0.8) (see Tab. 3).
3.3.3 Origin of the CO Emission
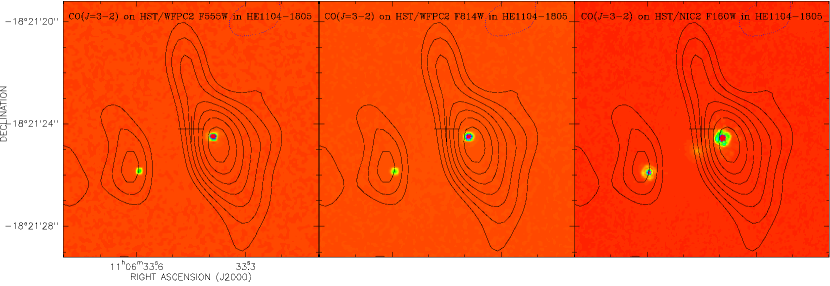
In Figure 9, overlays of the CO(=32) emission on top of observed-frame 555 nm, 814 nm, and 1.6 m continuum emission in HE 1104–1805 are shown (HST images from Remy et al. 1998; Léhar et al. 2000). The CO emission is clearly associated with the two (pointlike) images of the AGN. The emission peaks are slightly spatially offset. This may indicate that the AGN does not reside in the center of the molecular gas reservoir. However, this small offset may as well be due to smaller-scale dynamics of the molecular gas that are averaged over in the CO emission line map. The CO images are consistent with being resolved along the Einstein radius, but observations at higher spatial resolution and sensitivity are desirable to study the structure and dynamics of the lensed gas reservoir in more detail.
3.4. B1359+154
3.4.1 Previous Results
B1359+154 is a rare, sextuply lensed, radio-loud quasar at an optical
redshift of
=3.2350.002, with a maximum image
separation of 1.71′′ (Myers et al. 1999). It was
selected in the radio, but in contrast to B1938+666, is an optically
bright quasar. It is lensed by a compact group at 1
with three primary lensing galaxies of similar luminosities, which are
situated on the vertices of a triangle, separated by 0.7′′
(photometric/lensing redshifts are =1.350.16, =0.880.06, and =0.940.07; Rusin et al. 2001). Very compact (3–9 mas lensed sizes along their major
axes), flat spectrum (–0.3 from 1.7 to
5 GHz) radio cores are associated with all six images, and the
brightest three images show radio jets extending out to tens of mas
(lensed) scales (Rusin et al. 2001). B1359+154 has a
luminous dust bump, with =3910 mJy and
=11.51.9 mJy. It is magnified by a factor
of =118 (Barvainis & Ivison 2002).
3.4.2 New Results: Line Emission
We detect luminous CO(=32) and CO(=43) emission toward B1359+154 (Fig. 7). From Gaussian fitting to the line profiles, we find =5.61.7 and 10.01.6 mJy, and =19892 and 23747 km s-1 for the CO(=32) and CO(=43) lines, respectively. The line widths are consistent within the errors. This corresponds to =1.20.4 and 2.50.4 Jy km s-1 (see Tab. 2) . The CO line emission yields a median host galaxy redshift of =3.23990.0003, which is close to the optical redshift of the quasar (d=–0.005). The line brightness temperature ratio of =1.20.5 is consistent with optically thick, thermalized emission within the errors.
Assuming a 6% correction for subthermal excitation of the (higher
signal-to-noise ratio) CO(=43) line, we derive =6.5108 (/118)-1 K km s-1 pc2,
and
=5.2108 (/118)-1 (/0.8) (see Tab. 3),
comparable to what is found in the lensed Ly-break galaxy
MS 1512-cB58 (Riechers et al. 2010b). Under the
assumption of =20, and would
be 6 higher, but still at the low end of observed
values at high .
3.4.3 New Results: Continuum Emission
As shown in Fig. 7, we detect continuum emission toward B1359+154 under the CO lines. Simultaneous fits to the line and continuum emission suggest continuum strengths of 3.970.35 and 2.110.32 mJy below the CO(=32) and CO(=43) lines. The strength and slope of the emission is consistent with synchrotron emission from the radio-loud AGN. By averaging the line-free channels over the observed frequency range (LSB+USB for both lines) and fitting a 2-dimensional Gaussian to the data, we find a 3.1 mm continuum flux of 3.610.18 mJy. In Fig. 4, a map of the averaged continuum emission is shown. From the fit, we also find a continuum size of (3.14′′2.48′′)(0.88′′0.72′′) at a position angle of 289∘19∘, suggesting that the continuum emission is marginally resolved at best. Accounting for interferometric seeing (which is not part of the above errors), this is consistent with the 1.7′′ maximum image separation, and the continuum emission to be dominated by the radio-loud AGN.
3.4.4 Origin of the CO/Continuum Emission
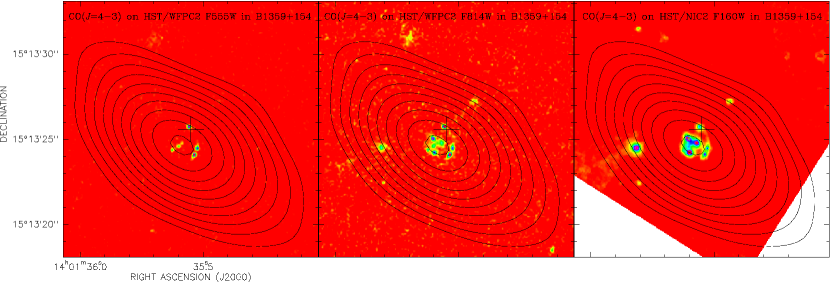
In Figure 10, overlays of the CO(=43) and underlying continuum emission on top of observed-frame 555 nm, 814 nm, and 1.6 m continuum emission in B1359+154 are shown (HST images from Munoz et al. 1998). The peak of the CO/continuum emission is consistent with the centroid of the six lensed images of the source. Observations at (at least) 5 higher resolution are desirable to study the distribution and dynamics of the molecular gas in this complex system.
4. Discussion
4.1. The ‘Star Formation Law’ for AGN Host Galaxies
Due to high lensing magnification factors, our targets are among the intrinsically faintest high– sources observed to date. Their / ratios lie at the low end of the distribution of high- quasars, but are consistent with the observed range.
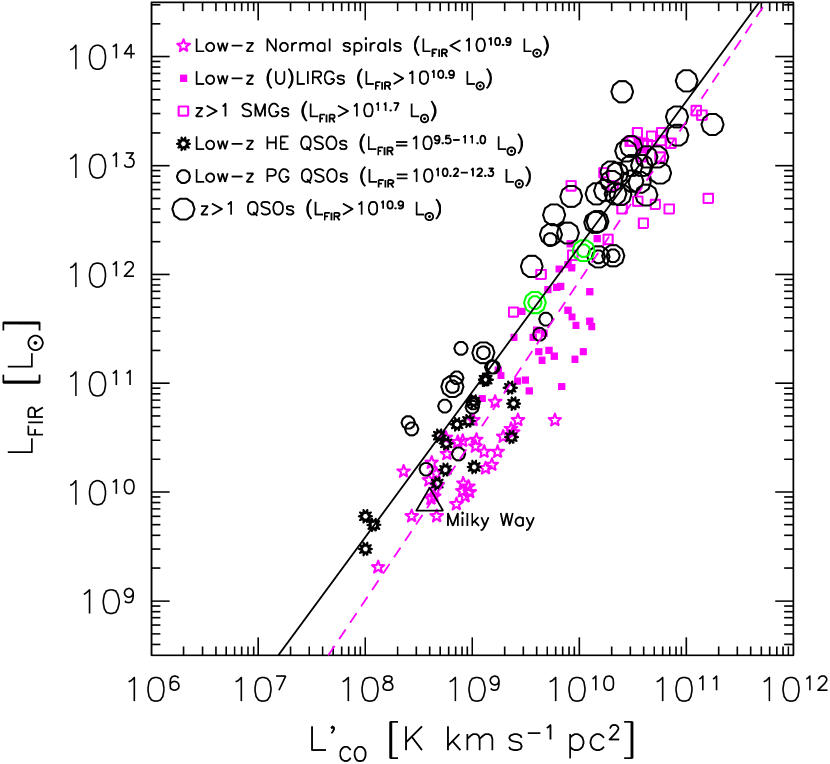
To investigate the properties of our targets in more detail, we here compare their and to other CO-detected quasars at low and high redshift, and low and high redshift galaxies without luminous AGN see Fig. 11). The – relation is a variant of the spatially integrated ‘star formation law’ (e.g., Kennicutt 1998a; 1998b) that only relies on observed quantities, as it is independent of quantities like the conversion factor and the assumed stellar initial mass function (see, e.g., Daddi et al. 2010a; Genzel et al. 2010, for recent investigations of the –SFR relation). At high redshift, we restrict the analysis to a comparison of quasars (summarized in Table 4.1) and submillimeter galaxies (SMGs), as these samples cover a comparable range in .666The high- massive, gas-rich star-forming galaxies identified by Daddi et al. (2008, 2010b) and Tacconi et al. (2010) have comparable , but substantially lower /, than these more extreme systems. Many SMGs are known to host AGN, but these AGN are substantially less luminous than those found in quasars. At low , the galaxies without luminous AGN are represented by a revised version of the Gao & Solomon (2004) sample, including luminous and ultra-luminous infrared galaxies ((U)LIRGs). This currently is the best-studied, best calibrated low- galaxy sample for the spatially integrated galaxy properties studied here. We corrected all high- CO line-based luminosities for excitation, based on models for high- quasars with well-sampled CO line ladders (Riechers et al. 2006; 2009b), corresponding to corrections of 0%, 2%, 6%, 12%, and 25% for the CO =21, 32, 43, 54, and 65 lines. A fit to all data yields = (1.400.04) log –(1.920.42), yielding the canonical power law slope of 1.4 (e.g., Kennicutt 1998a; see also Riechers et al. 2006). Fitting all quasar samples yields log = (1.330.05) log –(1.090.50), i.e., a slightly lower power law slope. A fit to the low- galaxy sample and the SMGs yields log = (1.470.06) log –(2.730.54), i.e., a slightly higher power law slope.
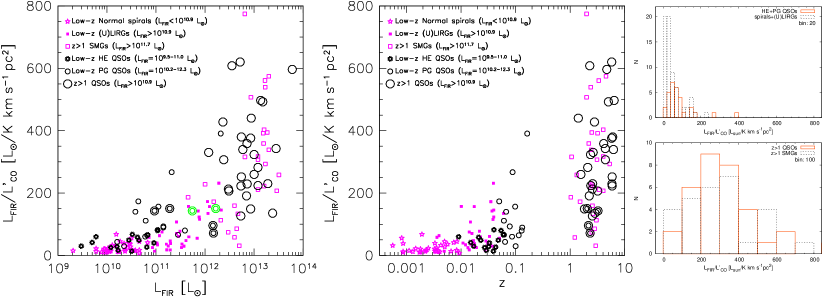
The high- quasars and SMG samples show comparable / ratios and span a comparable range (see also Fig. 12, where the ratio of both quantitites is shown on a linear scale to emphasize the scatter of individual sources). On average, SMGs have somewhat higher ratios (by 28% at =1013 ), which is likely due to the fact that the typically CO(=32)based are under-corrected with the 2% correction factor for quasars. Recent studies of CO(=10) and CO(=21) emission in SMGs suggest that a correction factor of 30%–40% may be more appropriate for a substantial fraction of SMGs (e.g., Ivison et al. 2010; Carilli et al. 2010; Riechers et al. 2010a; Harris et al. 2010; Frayer et al. 2010), which would make the / ratios for quasars and SMGs even more similar on average. However, studies of the CO excitation in SMGs also show that the emission seen in low- lines may be partially associated with a low-excitation gas component, i.e., material that likely is not concentrated in the regions where the massive starbursts take place (Carilli et al. 2010; Riechers et al. 2010a). This is not the case in quasars, which can typically be modeled with a single, highly excited gas component down to the low- CO lines (e.g., Riechers et al. 2006; Weiß et al. 2007). Studies of CO(=10) emission in larger samples of high- quasars and SMGs are required to investigate these differences, which directly affect the physical interpretation of the – relation. In fact, observations of CO line ladders down to CO(=10) may be a powerful tool to distinguish different high- galaxy populations based on their gas properties alone (e.g., Dannerbauer et al. 2009; Aravena et al. 2010; Riechers et al. 2010b).
Another important aspect is that we here study (i.e., rest-frame 42.5–122.5 m emission), not (8–1000 m). This has a relatively small impact for galaxies without luminous AGN, but it makes substantial difference for quasars. Quasars typically show both a warm dust bump with temperatures of =30–60 K (i.e., comparable to ULIRGs and SMGs), and a hot dust bump with 100 K (likely associated with the AGN, e.g., Weiß et al. 2003; Beelen et al. 2006). This yields a / ratio of typically a factor of a few. Thus, a – relation for quasars would likely be biased toward the AGN properties. On the other hand, our findings for the – relation appear to suggest that, indeed, the FIR luminosity in high- quasars is dominated by dust-reprocessed emission from young stars in the host galaxy, rather than the AGN.
One caveat to the present interpretation of the – relation at high is the possibility of differential gravitational lensing effects between the CO and FIR emission for the lensed galaxies in both samples. Given the overall agreement between lensed and unlensed sources within the samples and the fact that they follow the – relation, such effects appear to be minor, but only few lensed systems have been studied at sufficient spatial resolution in molecular gas and FIR continum emission to quanitfy this in more detail.
The difference in / ratios between low- quasar samples and low- galaxies without luminous AGN appear to be larger than those between high- quasars and SMGs. With the current sample sizes, these differences are only moderately statistically significant. Given the less massive dust and gas reservoirs in the lower luminosity systems, such a trend may however not be surprising. In such systems, the AGN may be substantially more efficient in heating larger fractions of the warm dust than in the typically very gas-rich high- systems, yielding elevated / ratios. High spatial resolution observations of the CO and FIR continuum in nearby quasar host galaxies are key to investigate this issue in more detail. An alternative interpretation would be that the AGN fraction rises with toward ULIRGs and SMGs, which could decrease the difference between FIR-luminous quasars and other FIR-luminous galaxy populations. We consider this explanation less compelling, as there is no clear relation between AGN luminosity and FIR luminosity for galaxies of comparable masses.
| Source | CO line | log10()aaCorrected for gravitational lensing.,bbCorrected for line excitation where applicable. Corrections applied: 0% for CO(=21), 2% for CO(=32), 6% for CO(=43), 12% for CO(=54), and 25% for CO(=65). | log10()aaCorrected for gravitational lensing. | ref. | comments | |||
|---|---|---|---|---|---|---|---|---|
| [Jy km s-1] | [K km s-1pc2] | [] | ||||||
| Q0957+561 | 1.4141 | 1.6 | 21 | 1.20.1 | 10.30 | 12.94 | 1 | double lens |
| 3C318 | 1.571 | 21 | 1.190.22 | 10.59 | 13.00 | 2 | ||
| COSBO11 | 1.8275 | 21 | 1.33 | 10.76 | 12.93 | 3 | ||
| B1938+666 | 2.0590 | 173 | 32 | 9.11.1 | 9.10 | 11.28 | 4 | Einstein ring |
| HS 1002+4400 | 2.1015 | 32 | 1.70.3 | 10.63 | 13.08 | 5 | ||
| HE 0230–2130 | 2.1664 | 14.5 | 32 | 8.31.2 | 10.18 | 12.16 | 4 | quadruple lens |
| RX J1249–0559 | 2.2470 | 32 | 1.30.4 | 10.56 | 12.85 | 5 | ||
| F10214+4724 | 2.2858 | 17 | 32 | 3.400.19 | 9.76 | 12.55 | 6 | arc lens |
| HE 1104–1805 | 2.3221 | 10.8 | 32 | 7.51.2 | 10.32 | 12.17 | 4 | double lens |
| J1543+5359 | 2.3698 | 32 | 1.00.2 | 10.49 | 13.00 | 5 | ||
| HS 1611+4719 | 2.3961 | 32 | 1.70.3 | 10.73 | 13.08 | 5 | ||
| J13122+12381 | 2.5564 | 32 | 0.40.1 | 10.15 | 12.48 | 5 | ||
| Cloverleaf | 2.55784 | 11 | 32 | 13.20.2 | 10.63 | 12.73 | 7 | quadruple lens |
| J1409+5628 | 2.5832 | 32 | 2.30.2 | 10.92 | 13.28 | 8 | ||
| MG 0414+0534 | 2.639 | 27 | 32 | 2.6 | 9.55 | 12.07 | 9 | quadruple lens |
| RX J0911+0551 | 2.796 | 22 | 32 | 2.91.1 | 9.73 | 12.37 | 10 | quadruple lens |
| J04135+10277 | 2.846 | 1.3 | 32 | 5.41.3 | 11.25 | 13.38 | 10 | cluster lens |
| MG 0751+2716 | 3.1999 | 16 | 32 | 4.60.5 | 10.17 | 12.49 | 11 | quadruple lens |
| B1359+154 | 3.2399 | 118 | 43 | 2.50.4 | 8.81 | 10.97 | 4 | sextuple lens |
| APM 08279+5255 | 3.9118 | 4.2 | 10 | 0.1680.015 | 10.40 | 13.68 | 12 | triple lens |
| PSS J2322+1944 | 4.1192 | 5.3 | 10 | 0.1550.013 | 10.30 | 12.86 | 13 | Einstein ring |
| BRI 1335–0417 | 4.4074 | 21 | 0.430.02 | 10.91 | 13.45 | 14 | ||
| BRI 0952–0115 | 4.4337 | 4 | 54 | 0.910.11 | 9.89 | 12.38 | 15 | double lens |
| BR 1202–0725 | 4.6949 | 10 | 0.1200.010 | 11.00 | 13.78 | 13 | two sources | |
| J0338+0021 | 5.0267 | 54 | 0.730.09 | 10.48 | 13.18 | 16 | ||
| J0927+2001 | 5.7722 | 54 | 0.440.07 | 10.35 | 12.93 | 17 | ||
| J1044–0125 | 5.7824 | 65 | 0.210.04 | 9.92 | 12.72 | 18 | ||
| J0840+5624 | 5.8437 | 54 | 0.600.07 | 10.50 | 12.86 | 18 | ||
| J1425+3254 | 5.8918 | 65 | 0.590.11 | 10.38 | 12.73 | 18 | ||
| J1335+3533 | 5.9012 | 65 | 0.530.07 | 10.34 | 12.74 | 18 | ||
| J2054–0005 | 6.0379 | 65 | 0.340.07 | 10.16 | 12.74 | 18 | ||
| J1048+4637 | 6.2274 | 65 | 0.390.08 | 10.24 | 12.77 | 18 | ||
| J1148+5251 | 6.4189 | 32 | 0.200.02 | 10.48 | 13.13 | 19 |
References. — [1] Krips et al. 2005; [2] Willott et al. 2007; [3] Aravena et al. 2008; [4] this work; [5] Coppin et al. 2008; [6] Ao et al. 2008; [7] Weiß et al. 2003; [8] Beelen et al. 2004; [9] Barvainis et al. 1998; [10] Hainline et al. 2004; [11] Alloin et al. 2007; [12] Riechers et al. 2009a; [13] Riechers et al. 2006; [14] Riechers et al. 2008; [15] Guilloteau et al. 1999; [16] Maiolino et al. 2007; [17] Carilli et al. 2007; [18] Wang et al. 2010; [19] Walter et al. 2003.
Note. — Estimates are typically based on the lowest- CO line observed, if applicable.
4.2. Star Formation Rates and Gas Depletion Timescales
If the in our targets are indeed dominated by star formation, we can derive their star-formation rates (SFRs). Assuming SFR[ yr-1]=1.510-10 [] (e.g., Kennicutt 1998a; 1998b), we find SFRs of 30 (/173)-1 yr-1, 220 (/14.5)-1 yr-1, 220 (/10.8)-1 yr-1, and 14 (/118)-1 yr-1 for B1938+666, HE 0230–2130, HE 1104–1805, and B1359+154, respectively (Tab. 3).
The minimum times for which the starbursts can be maintained at their current rates are given by the gas depletion timescales. We find =/SFR=35, 55, 75, and 40 Myr for B1938+666, HE 0230–2130, HE 1104–1805, and B1359+154, respectively. This is comparable to what is found in SMGs and other high- QSOs (e.g., Greve et al. 2005; Riechers et al. 2008; 2010a).
4.3. Systemic Redshifts
We find that the CO redshifts of the three sources with spectroscopic redshifts from optical observations are close to . However, in all cases, the CO emission is redshifted relative to broad Ly and high ionization (typically CIV1549) optical emission lines from the AGN. The median redshift difference of the three sources with is d=0.00450.0015, or 360116 km s-1.777For consistency, we here adopt =2.3172 for HE 1104–1805 as measured by Smette et al. (1995) instead of the H+[OIII](5007) redshift used above. For a large sample of Sloan Digital Sky Survey (SDSS) quasars, Richards et al. (2002) have found that low-ionization lines such as MgII(2798) are commonly redshifted relative to high-ionization broad lines such as CIV(1549) (median of 824511 km s-1), which they interpret to be due to orientation effects related to the AGN accretion disk (or disk wind). Even though the orientation of the accretion disk and host galaxy need not be aligned, referencing the redshifts of broad AGN lines to the systemic redshifts provided by CO observations of the host galaxies may help to better disentangle orientation effects and dynamics of high redshift galaxies.
5. Summary
We have detected CO(=21), CO(=32), and CO(=43) emission in four lensed quasar host galaxies at redshifts of 2 with CARMA (a total of six lines). To date, these are the highest redshift CO detections reported with CARMA. From our analysis, we obtain the following key results:
Facilitating the large, 7.4 GHz bandwidth (LSB+USB) of the new CARMA correlator, we have executed the first successful ‘blind’ CO redshift search with an interferometer, demonstrating the feasibility of such investigations with only few frequency setups. Based on the CO redshift, we also used the broad frequency range covered by these observations to search for emission from dense molecular gas tracers (HCN, HCO+, HNC, C2H, and CN), which yielded only a statistical detection after stacking – as expected at the depth of this search. We also searched for HCN, HCO+, and HNC absorption toward foreground sources, but no lines are detected along the line of sight.
We spatially resolve the CO emission in the two radio-quiet quasars in the sample. In the wide separation double lens HE 1104–1805 (=2.322), we individually detect the emission toward both images. In all cases the CO emission is consistent with the brightest emission regions detected at rest-frame optical wavelengths.
We detect strong continuum emission toward the two radio-loud sources in the sample. The spectral slope of the emission is consistent with synchrotron emission associated with the AGN in both cases.
We derive lensing- and excitation-corrected CO line luminosities of 0.65–21109 K km s-1 pc2. From the CO luminosities, we determine molecular gas masses of 0.52–17109 . These values are at the lower end of those observed in other high- quasars, showing the advantage of observing lensed distant galaxies to probe down to lower gas masses.
Combining our targets with literature samples, we find no significant
difference in the / ratios between high-
quasars and SMGs. We find tentative evidence that nearby quasars with
low show an excess in /
relative to systems without a luminous AGN at similar redshift and
with comparable . This may indicate that AGN heating of
the warm dust is more efficient than in the more gas-rich and massive
FIR-luminous quasars detected at high , where the dust heating in
the FIR appears to be largely dominated by young stars.
The observations presented herein lay the foundation for future studies with the Atacama Large (sub-) Millimeter Array (ALMA), which will routinely observe unlensed galaxies at comparable and fainter intrinsic CO luminosities. The ‘blind’ CO redshift search technique presented here will be particularly valuable for so-called ‘Deep Field’ investigations with ALMA, which will allow, for the first time, to construct an unbiased CO luminosity function out to high by directly selecting galaxies through their CO content. This is an important step toward constraining the gas mass history of the universe, a critical piece in our understanding of galaxy evolution throughout cosmic times.
References
- Alloin et al. (2007) Alloin, D., Kneib, J.-P., Guilloteau, S., & Bremer, M. 2007, A&A, 470, 53
- Anguita et al. (2008) Anguita, T., Faure, C., Yonehara, A., Wambsganss, J., Kneib, J.-P., Covone, G., & Alloin, D. 2008, A&A, 481, 615
- Ao et al. (2008) Ao, Y., Weiß, A., Downes, D., Walter, F., Henkel, C., & Menten, K. M. 2008, A&A, 491, 747
- Aravena et al. (2008) Aravena, M., et al. 2008, A&A, 491, 173
- Aravena et al. (2010) Aravena, M., et al. 2010, ApJ, 718, 177
- Barvainis & Ivison (2002) Barvainis, R., & Ivison, R. J. 2002, ApJ, 571, 712
- Barvainis et al. (1998) Barvainis, R., Alloin, D., Guilloteau, S., & Antonucci, R. 1998, ApJ, 492, L13
- Beelen et al. (2004) Beelen, A., Cox, P., Pety, J., Carilli, C. L., Bertoldi, F., Momjian, E., Omont, A., Petitjean, P., & Petric, A. O. 2004, A&A, 423, 441
- Beelen et al. (2006) Beelen, A., Cox, P., Benford, D. J., Dowell, C. D., Kovács, A., Bertoldi, F., Omont, A., & Carilli, C. L. 2006, ApJ, 642, 694
- Bertram et al. (2007) Bertram, T., Eckart, A., Fischer, S., Zuther, J., Straubmeier, C., Wisotzki, L., & Krips, M. 2007, A&A, 470, 571
- Bothwell et al. (2010) Bothwell, M. S., et al. 2010, MNRAS, 405, 219
- Carilli et al. (2007) Carilli, C. L., et al. 2007, ApJ, 666, L9
- Carilli et al. (2010) Carilli, C. L., et al. 2010, ApJ, 714, 1407
- Coppin et al. (2008) Coppin ,K. E. K., et al. 2008, MNRAS, 389, 45
- Daddi et al. (2008) Daddi, E., Dannerbauer, H., Elbaz, D., Dickinson, M., Morrison, G., Stern, D., & Ravindranath, S. 2008, ApJ, 673, L21
- Daddi et al. (2009a) Daddi, E., et al. 2009a, ApJ, 694, 1517
- Daddi et al. (2009b) Daddi, E., et al. 2009b, ApJ, 695, L176
- Daddi et al. (2010a) Daddi, E., et al. 2010a, ApJ, 714, L118
- Daddi et al. (2010b) Daddi, E., et al. 2010b, ApJ, 713, 686
- Dannerbauer et al. (2009) Dannerbauer, H., Daddi, E., Riechers, D. A., Walter, F., Carilli, C. L., Dickinson, M., Elbaz, D., & Morrison, G. E. 2009, ApJ, 698, L178
- Downes & Solomon (1998) Downes, D., & Solomon, P. M. 1998, ApJ, 507, 615
- Eigenbrod et al. (2006) Eigenbrod, A., Courbin, F., Meylan, G., Vuissoz, C., & Magain, P. 2006, A&A, 451, 759
- Evans et al. (2001) Evans, A. S., Frayer, D. T., Surace, J. A., & Sanders, D. B. 2001, AJ, 121, 1893
- Evans et al. (2006) Evans, A. S., Solomon, P. M., Tacconi, L. J., Vavilkin, T., & Downes, D. 2006, AJ, 132, 2398
- Frayer et al. (2008) Frayer, D. T., et al. 2008, ApJ, 680, L21
- Frayer et al. (2010) Frayer, D. T., et al. 2010, ApJL, in press (arXiv:1009.2194)
- Gao & Solomon (2004) Gao, Y., & Solomon, P. M. 2004, ApJ, 606, 271
- Gao et al. (2007) Gao, Y., Carilli, C. L., Solomon, P. M., & Vanden Bout, P. A. 2007, ApJ, 660, L93
- Genzel et al. (2010) Genzel, R., et al. 2010, MNRAS, 407, 2091
- Greve et al. (2005) Greve, T. R., et al. 2005, MNRAS, 359, 1165
- Guilloteau et al. (1999) Guilloteau, S., Omont, A., Cox, P., McMahon, R. G., & Petitjean, P. 1999, A&A, 349, 363
- Hainline et al. (2004) Hainline, L. J., Scoville, N. Z., Yun, M. S., Hawkins, D. W., Frayer, D. T., & Isaak, K. G. 2004, ApJ, 609, 61
- Harris et al. (2010) Harris, A. I., Baker, A. J., Zonak, S. G., Sharon, C. E., Genzel, R., Rauch, K., Watts, G., & Creager, R. 2010, ApJ, 723, 1139
- Iono et al. (2006) Iono, D., Tamura, Y., Nakanishi, K., Kawabe, R., Kohno, K., Okuda, T., Yamada, K., Hatsukade, B., & Sameshima, M. 2006, PASJ, 58, 957
- Ivison et al. (2010) Ivison, R. J., Smail, I., Papadopoulos, P. P., Wold, I., Richard, J., Swinbank, A. M., Kneib, J.-P., & Owen, F. N. 2010, MNRAS, 404, 198
- Kennicutt (1998a) Kennicutt, R. C. 1998a, ApJ, 498, 541
- Kennicutt (1998b) Kennicutt, R. C. 1998b, ARA&A, 36, 189
- King et al. (1997) King, L. J., Browne, I. W. A., Muxlow, T. W. B., Narasimha, D., Patnaik, A. R., Porcas, R. W., & Wilkinson, P. N. 1997, MNRAS, 289, 450
- King et al. (1998) King, L. J., et al. 1998, MNRAS, 295, L41
- Knudsen et al. (2009) Knudsen, K. K., Neri, R., Kneib, J.-P., & van der Werf, P. P. 2009, A&A, 496, 45
- Krips et al. (2005) Krips, M., Neri, R., Eckart, A., Downes, D., Martín-Pintado, J., & Planesas, P. 2005, A&A, 431, 879
- Lehar et al. (2000) Lehár, J., Falco, E. E., Kochanek, C. S., McLeod, B. A., Munoz, J. A., Impey, C. D., Rix, H.-W., Keeton, C. R., & Peng, C. Y. 2000, ApJ, 536, 584
- Lidman et al. (2000) Lidman, C., Courbin, F., Kneib, J.-P., Golse, G., Castander, F., & Soucail, G. 2000, A&A, 364, L62
- Lutz et al. (2008) Lutz, D., et al. 2008, ApJ, 684, 853
- Magain et al. (1988) Magain, P., Surdej, J., Swings, J.-P., Borgeest, U., & Kayser, R. 1988, Nature, 334, 325
- Maiolino et al. (2007) Maiolino, R., et al. 2007, A&A, 472, L33
- Munoz et al. (1998) Munoz, J. A., Falco, E. E., Kochanek, C. S., Lehár, J., McLeod, B. A., Impey, C. D., Rix, H.-W. & Peng, C. Y. 1998, Ap&SS, 263, 51
- Myers et al. (1999) Myers, S. T., et al. 1999, AJ, 117, 2565
- Omont et al. (2001) Omont, A., Cox, P., Bertoldi, F., McMahon, R. G., Carilli, C., & Isaak, K. G. 2001, A&A, 374, 371
- Omont et al. (2003) Omont, A., Beelen, A., Bertoldi, F., Cox, P., Carilli, C. L., Priddey, R. S., McMahon, R. G., & Isaak, K. G. 2003, A&A, 398, 857
- Patnaik et al. (1992) Patnaik, A. R., Browne, I. W. A., Wilkinson, P. N., & Wrobel, J. M. 1992, MNRAS, 254, 655
- Peng et al. (2006) Peng, C. Y., Impey, C. D., Rix, H.-W., Kochanek, C. S., Keeton, C. R., Falco, E. E., Lehár, J., & McLeod, B. A. 2006, ApJ, 649, 616
- Remy et al. (1998) Remy, M., Claeskens, J.-F., Surdej, J., Hjorth, J., Refsdal, S., Wucknitz, O., Sorensen, A. N., & Grundahl, F. 1998, New Astronomy, 3, 379
- Richards et al. (2002) Richards, G. T., Vanden Berk, D. E., Reichard, T. A., Hall, P. B., Schneider, D. P., SubbaRao, M., Thakar, A. R., & York, D. G. 2002, AJ, 124, 1
- Riechers et al. (2006) Riechers, D. A., et al. 2006, ApJ, 650, 604
- Riechers et al. (2007a) Riechers, D. A., Walter, F., Cox, P., Carilli, C. L., Weiss, A., Bertoldi, F., & Neri, R. 2007a, ApJ, 666, 778
- Riechers et al. (2007b) Riechers, D. A., Walter, F., Carilli, C. L., & Bertoldi, F. 2007b, ApJ, 671, L13
- Riechers et al. (2008) Riechers, D. A., Walter, F., Carilli, C. L., Bertoldi, F., & Momjian, E. 2008, ApJ, 686, L9
- Riechers et al. (2009a) Riechers, D. A., Walter, F., Carilli, C. L., & Lewis, G. F. 2009a, ApJ, 690, 463
- Riechers et al. (2009b) Riechers, D. A., et al. 2009b, ApJ, 703, 1338
- Riechers et al. (2010a) Riechers, D. A., Capak, P. L., Carilli, C. L., Cox, P., Neri, R., Scoville, N. Z., Schinnerer, E., Bertoldi, F., & Yan, L. 2010a, ApJ, 720, L131
- Riechers et al. (2010b) Riechers, D. A., Carilli, C. L., Walter, F., & Momjian, E. 2010, ApJ, 724, L153
- Rusin et al. (2001) Rusin, D., et al. 2001, ApJ, 557, 594
- Sanders et al. (1991) Sanders, D. B., Scoville, N. Z., & Soifer, B. T. 1991, ApJ, 370, 158
- Schinnerer et al. (2008) Schinnerer, E., et al. 2008, ApJ, 689, L5
- Scoville et al. (2003) Scoville, N. Z., Frayer, D. T., Schinnerer, E., & Christopher, M. 2003, ApJ, 585, L105
- Smette et al. (1995) Smette, A., Robertson, J. G., Shaver, P. A., Reimers, D., Wisotzki, L., & Koehler, T. 1995, A&AS, 113, 199
- Solomon & Vanden Bout (2005) Solomon, P. M., & Vanden Bout, P. A. 2005, ARA&A, 43, 677
- Spergel et al. (2003) Spergel, D. N., Verde, L., Peiris, H. V., et al. 2003, ApJS, 148, 175
- Spergel et al. (2007) Spergel, D. N., Bean, R., Doré, O., et al. 2007, ApJS, 170, 377
- Sulentic et al. (2006) Sulentic, J. W., Repetto, P., Stirpe, G. M., Marziani, P., Dultzin-Hacyan, D., & Calvani, M. 2006, A&A, 456, 929
- Tacconi et al. (2006) Tacconi, L. J., et al. 2006, ApJ, 640, 228
- Tacconi et al. (2010) Tacconi, L. J., et al. 2010, Nature, 463, 781
- Tonry & Kochanek (2000) Tonry, J. L., & Kochanek, C. S. 2000, AJ, 119, 1078
- Venturini & Solomon (2003) Venturini, S., & Solomon, P. M. 2003, ApJ, 590, 740
- Walter et al. (2003) Walter, F., et al. 2003, Nature, 424, 406
- Wang et al. (2008) Wang, R., et al. 2008, ApJ, 687, 848
- Wang et al. (2010) Wang, R., et al. 2010, ApJ, 714, 699
- Weiß et al. (2003) Weiß, A., Henkel, C., Downes, D., & Walter, F. 2003, A&A, 409, L41
- Weiß et al. (2007) Weiß, A., et al. 2007, A&A, 467, 955
- Weiß et al. (2009) Weiß, A., Ivison, R. J., Downes, D., Walter, F., Cirasuolo, M., & Menten, K. M. 2009, ApJ, 705, L45
- Wiklind & Combes (1995) Wiklind, T., & Combes, F. 1995, A&A, 299, 382
- Wiklind & Combes (1996) Wiklind, T., & Combes, F. 1996, Nature, 379, 139
- Willott et al. (2007) Willott, C. J., Martínez-Sansigre, A., & Rawlings, S. 2007, AJ, 133, 564
- Wisotzki et al. (1995) Wisotzki, L., Koehler, T., Ikonomou, M., & Reimers, D. 1995, A&A, 297, L59
- Wisotzki et al. (1999) Wisotzki, L., Christlieb, N., Liu, M. C., Maza, J., Morgan, N. D., & Schechter, P. L. 1999, A&A, 348, L41