Vesicle deformations by clusters of transmembrane proteins
Abstract
We carry out a coarse-grained molecular dynamics simulation of phospholipid vesicles with transmembrane proteins. We measure the mean and Gaussian curvatures of our protein-embedded vesicles and quantitatively show how protein clusters change the shapes of their host vesicles. The effects of depletion force and vesiculation on protein clustering are also investigated. By increasing the protein concentration, clusters are fragmented to smaller bundles, which are then redistributed to form more symmetric structures corresponding to lower bending energies. Big clusters and highly aspherical vesicles cannot be formed when the fraction of protein to lipid molecules is large.
I Introduction
Biological membranes are found in various complex shapes Lip95 ; Sei97 which are closely related to membrane functions such as biconcave shape of erythrocytes or corkscrew shape of spirochetes. Shape variety depends mainly on protein concentration, operation of external forces on membranes in cellular environments Zim06 , membrane movement, fusion and budding processes, variations in lipid composition, and vesicle trafficking Mc05 . Membrane local curvature is representative for its shape, and proteins are believed to play an important role in membrane conformation. Proteins behave as both generating Zim06 ; Mc05 and sensing Vog06 elements for the membrane curvature Mc05 ; Phi09 . While protein aggregation induces shape transformation, membrane curvature may also generate feedback on protein aggregation and yield attractive Phi09 ; Rey07 or repulsive Phi09 ; Kim98 curvature-mediated interactions between them. It has also been shown that bending rigidity and membrane thickness affect protein functioning And07 ; Jen04 .
Proteins affect membrane curvature through various ways such as scaffold and local curvature mechanisms, and by their integration (as transmembrane proteins) with the membrane Zim06 ; Mc05 ; Phi09 ; Koz10 . However, the experimental measurements of variations in the membrane curvature are not easy. The role of proteins on the membrane deformations has been studied using continuum elastic modeling Phi09 ; Kim98 ; Wei98 , particle-based Cha08 and mesoscopic Ven05 simulations, and hybrid elastic-discrete particle models Naj09 . In all these studies, lipid bilayers represent a liquid environment with freely diffusing lipid chains that dissolve topological deformations. The aggregation of somewhat rigid proteins remarkably reduces the diffusion of lipid chains and causes shape variations.
In this study, we use a coarse-grained model Ven06 and generalize the method of Markvoort et al. Mar05 to generate phospholipid vesicles from initially rectangular and flat bilayers with different concentrations of transmembrane proteins. We discuss our simulation method in section II and model the vesicle surface using spherical harmonics. In section III, we present a method for computing the mean and Gaussian curvatures at the locations of hydrophilic heads of lipid chains and proteins. The local curvature information together with the sizes of protein clusters help us to investigate the deformations of host vesicles in section IV. We also study the size distribution, formation and fragmentation of protein clusters. We summarize our fundamental results in section V.
II Model Description
Mesoscopic models have been widely used to study the physics of membranes Ven06 . Lipids can spontaneously aggregate and form various membranes Goe98 ; Goe99 . When lipid chains are assembled in the form of a closed 3D surface and trap water molecules, a vesicle is generated. Entropy is the main driving mechanism of this process Mar05 . To construct vesicles, we insert initially flat rectangular lipid bilayers (which may contain proteins) inside a box of water molecules. Such a configuration is unstable because the tails of boundary lipids are repelled by water molecules and the bilayer is compressed by in-plane forces. Consequently, the bilayer buckles and closes itself to acquire a minimum potential energy state. Vesicles formed through this bilayer vesicle transition process, with the progenitor bilayer being surrounded by solvent particles (without touching simulation boundaries), have a more relaxed pressure distribution. Furthermore, using bilayer vesicle transition process we obtain vesicles of different sizes in a more controllable process.
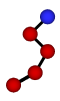
Our simulation box has dimensions of with the -axis being normal to the initial bilayer mid plane. We use periodic boundary conditions, and choose a sufficiently large box so that the bilayer does not reach to the boundaries before vesiculation. The number of protein and lipid molecules are denoted by and , respectively. The particles that constitute the elements of our setups either are water particles (type 1), or have hydrophobic (type 2) and hydrophilic (type 3) natures. We follow reference [19], and model each lipid chain by one hydrophilic head and four hydrophobic tail particles (Fig. 1a).
a)
 b)
b)
(
(
All particles interact through Lennard-Jones (LJ) potential Allen87 with a cut off radius .
We use the integer subscripts and for particle types, and index a particle in a molecule by the subscript . For the pairs and (2,3) the interaction potential is , and for other pairs we use where =1 Goe98 . A harmonic bond potential of the form is applied between neighboring particles inside a lipid chain, and we have set where . With these assumptions, less than 10% of bond lengthes fluctuate more than 2% around [19]. In some case studies, to include bending rigidity in our lipid and protein chains, we use the potential
| (1) | |||||
| (2) |
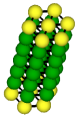
where is the bending coefficient of non-flexible chains Goe98 . defines the bending angle between adjacent bonds in a single chain. Protein molecules (Fig. 1b) are composed of seven strands in a hexagonal arrangement Ven05 . A particle in each strand interacts with all of its neighbors, within the same protein, through the potentials and defined above. In this way, lipid-protein interactions are the same as lipid-lipid interactions.
In this study, we work with simple proteins whose lengths are adjusted in a way that the hydrophobic mismatch effect is minimum, and such that a single protein does not affect the membrane conformation considerably. Shape variations that we report, are thus caused only by clustering. Both flexible and rigid chains can be used in lipid and protein molecules. The experiments of section IV show that adding bending rigidity does not induce remarkable qualitative or quantitative changes in the protein tilting angle or in the aggregation products. In fact, the strong harmonic bond potentials assumed between neighboring strands (in a protein molecule) provide enough bending rigidity for our relatively short protein molecules.
We implement equilibrium molecular dynamics simulation of an NVT ensemble Allen87 with velocity Verlet algorithm for integration in the time domain. We use the integration time step with
| (3) |
and set the number density of particlesGoe98 to . All Particles have equal masses of , and all lengths are scaled by . The parameters used in our models produce correct physical properties of bilayers, including diffusion coefficients, density profiles and mechanical properties like surface tension and stress distribution Goe98 ; Mar05 . After vesicle formation, the position vectors of particles are measured with respect to the vesicle center, and the lipid or protein heads exposed to water molecules outside the vesicle are tagged as surface particles. We assign an integer number to each surface particle, and denote the total number of surface particles by . It is remarked that there is not a meaningful correlation between the physical location of each particle and its number . The identifier is used only for statistical purposes. Furthermore, a single number is assigned to each surface particle, i.e., there are, respectively, one and seven particle identifiers corresponding to each lipid chain and protein molecule.
III Local mean and Gaussian curvatures
To measure the local curvature of vesicles, with and without proteins, we express the radial distance of surface particles from the vesicle center in terms of spherical harmonics Arf85 as
| (4) |
where
| (5) | |||||
| (6) |
Here are associated Legendre functions and . We find the coordinates of surface particles , define
| (8) |
and collect all constants coefficients and in single column vectors a and b, respectively. The superscript T means transpose. We also define the matrices A and B whose elements are and , respectively. The discrete form of equation (4) thus becomes
| (9) |
which in practice, has more equations than unknowns.
We calculate x using the singular value decomposition of Y, and obtain the position of any surface particle from (4) and
| (10) |
where are the unit vectors in Cartesian coordinates. Let us define and as the first order, and , , and as the second order partial derivatives of r in (10) with respect to and . The coefficients of the first fundamental form of the surface are thus determined as
| (11) |
Defining the unit vector normal to the vesicle surface as , one finds the coefficients of the second fundamental form:
| (12) |
The mean curvature and the Gaussian curvature at the location of each surface particle can thus be computed using Saf94
| (13) |
The principal curvatures () are related to and through and Saf94 . In our numerical experiments we have truncated the series (4) at . Including terms had improvement in fractional errors. To perform a global shape classification of vesicles, we compute the average curvatures
| (18) |
and their corresponding standard deviations and for particles living on the surface of model vesicles.
IV Simulation Results
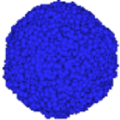
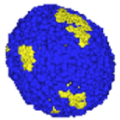
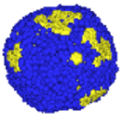
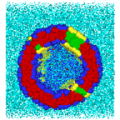
We first consider the case of lipid and protein chains with no bending rigidity. Our first model, which is called , is a vesicle without proteins and it is composed of similar lipid chains. The initial flat bilayer is bent inside the water (solvent) particles and gradually forms an almost spherical vesicle shown in the left panels of Fig. 2. To measure the sphericity of this vesicle quantitatively, we use a spherical harmonics expansion with , and fit a 3D surface to the surface particles. The mean local curvature is computed from (13) and used in (18) to find and . The small value of compared to confirms the spherical nature of vesicle .
IV.1 Protein-embedded vesicles
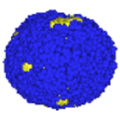
We replace some lipid chains of our initially flat bilayer by protein molecules while keeping the area of generating bilayer almost constant. We randomly distribute proteins in the bilayer sheet, but observe that they form small clusters after the bending of membrane and during vesicle formation. The vesiculation process takes from for model to for protein-embedded vesicles. That is because proteins (or clusters of proteins) resist against buckling by decreasing the fluidity of the progenitor membrane. After vesicle formation, we have waited for about time steps to ensure that vesicles have reached to an equilibrium condition so that the number and area of protein clusters remain constant.
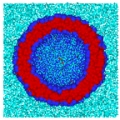
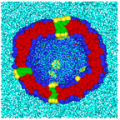
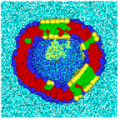
We have constructed three vesicles with initial bilayers of approximately equal surface areas and different protein concentrations. We name these vesicles , and , which have been formed inside water molecules. The numbers of lipid and protein molecules in our models have been given in Table 1. Fig. 2 demonstrates three dimensional views of these vesicles and their cross sections with the largest diameter so that the majority of clusters are visualized. We have also shown some water particles inside and outside vesicles. It is seen that larger protein clusters have induced lower curvatures in their neighborhood, and consequently, prominent deformations in their host vesicles.
| 2300 | 2120 | 1940 | 1760 | |
| 0 | 20 | 40 | 60 | |
| - | 0.0460 | 0.0381 | 0.0418 | |
| 0.0564 | 0.0549 | 0.0582 | 0.0567 | |
| 0.0564 | 0.0541 | 0.0544 | 0.0527 | |
| 0.0068 | 0.0135 | 0.0155 | 0.0158 | |
| 0.0030 | 0.0029 | 0.0029 | 0.0027 | |
| 0.0014 | 0.0015 | 0.0015 | 0.0015 | |
| - | 1.66 | 5 | 4.61 | |
| - | 1.53 | 2.66 | 3.52 | |
| 0 | 3 | 5 | 8 | |
| 0 | 9 | 3 | 5 | |
| - | 6 | 14 | 13 | |
| - | 3 | 11 | 11 | |
| - | 2 | 5 | 11 | |
| - | - | 5 | 6 | |
| - | - | 2 | 6 | |
| - | - | - | 4 | |
| - | - | - | 2 | |
| - | - | - | 2 |

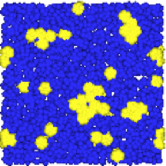
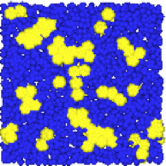
We also investigate several protein-embedded flat bilayers where the aggregation of proteins is caused mainly by the depletion force. Comparing the sizes and population of clusters formed in bilayers and vesicles helps us to better understand the roles of entropy- and curvature-driven aggregation of proteins during vesiculation. We simulate three flat bilayers, which extend to the sides of the simulation box. The surface areas of these bilayers and the population of their proteins match those of the vesicles –. We label these bilayers as , and . They remain in a flat equilibrium state because of periodic boundary conditions that keep them in touch with the sides of the simulation box. Fig. 3 displays the snapshots of and .
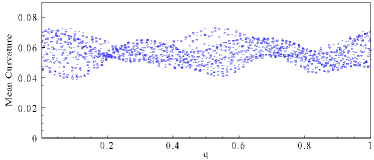
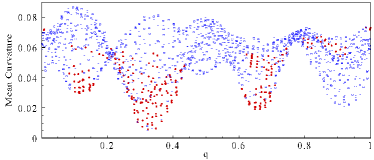
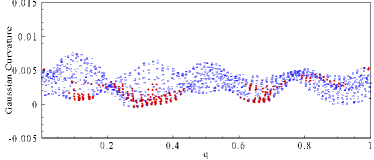
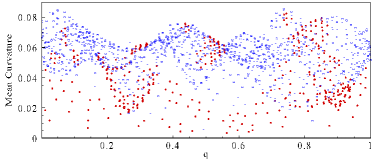
We split the molecules of the outer layer of vesicles into two groups of lipids and proteins, and denote by and the mean curvatures at the locations of lipid and protein heads, respectively. We track only initially tagged particles living on the outer surface of vesicle (because the probability of flip-flop motions is low) and compute the local curvature having their coordinates for . We have plotted and () in Fig. 4 for models –. The curvatures at different surface points have been marked by different symbols and colors. The scattered plots provide a quantitative insight to the effect of proteins on the vesicle shape. It is seen that the fluctuations of are higher in models with proteins. As we mentioned before, there is no correlation between the location of particles and their corresponding identifier . Therefore, in Fig. 4, points with close values of are not close physically. The oscillatory behavior of the graphs could change by renumbering the surface points but the major minima always coincide with protein clusters, which flatten their host vesicles locally.
We define and as the averages of mean curvatures (taken over the particles of the same kind) corresponding to lipid and protein heads, respectively. The average mean curvature for all surface particles (protein and lipid heads) and its corresponding standard deviation have been given in Table 1 together with and . Lower values of for models – confirm that transmembrane proteins reduce the averaged mean curvature through creating low-curvature clusters. During vesiculation, protein molecules aggregate and form clusters. The number of clusters and the population of proteins in each cluster are determined by (i) the random arrangement of proteins in the generating bilayer membrane (ii) the interplay between depletion force and curvature induced interactions (iii) system temperature and the concentration of protein molecules. If protein molecules are scattered in a vesicle, the membrane will maintain its sphericity. However, if the same number of proteins build a single cluster, the highest variation in vesicle shape will be observed. In our simulations we have not seen these two extreme cases. Several clusters with different populations of proteins are usually formed in our vesicles.
IV.2 Curvature-mediated clustering
Let us denote the number of scattered free proteins of a model by , and the number of its clusters by . Moreover, we indicate by the number of proteins in the th cluster. For models , and , we have reported the values of , and in Table 1. It is seen that the biggest cluster have been formed in vesicle and not in , which has more proteins. Consequently, is lower in vesicle than . The standard deviation is of for the near-spherical vesicle , but it increases remarkably for protein-embedded vesicles. As clusters grow, the curvature associated with the ensemble of lipids increases, and the vesicle becomes more aspherical. This can be understood from the larger value of in vesicle . A reverse phenomenon is also possible: if during the vesicle formation the curvature decreases in certain regions, proteins will migrate there and form low-curvature clusters. To show the correlation between the number of proteins in clusters and , we have computed the quantity
| (19) |
and given its magnitude in Table 1. We also define using a formula similar to (19), but for our model bilayers that correspond to vesicles (). The computed values of are given in Table 1.
Since bilayers remain flat during simulation, the effect of membrane curvature on the aggregation process is ignorable and indicates the contribution of the depletion force to cluster formation. Comparing the values of and clearly shows that curvature induced interactions, during vesiculation, facilitate the cluster growth and we get . Moreover, is a monotonic function of while is not. The reason is the lack of an effective fragmentation mechanism in flat bilayers: larger protein concentrations always lead to bigger clusters. In vesicles, however, the tendency to form a structure with minimum bending energy leads to the fragmentation of big clusters at the turning (maximum) point of the function .
| 4.61 | 4.61 | 4.61 | |
|---|---|---|---|
| 8 | 9 | 9 | |
| 5 | 4 | 4 | |
| 13 | 14 | 14 | |
| 11 | 11 | 9 | |
| 11 | 8 | 8 | |
| 6 | 7 | 7 | |
| 6 | 6 | 6 | |
| 4 | 3 | 5 | |
| 2 | 3 | 3 | |
| 2 | 2 | 2 | |
| - | 2 | 2 |
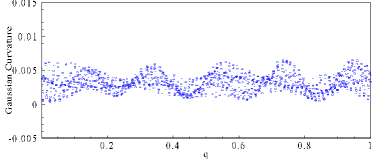
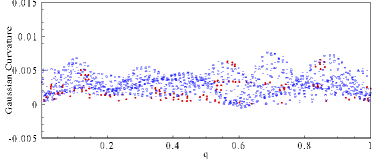
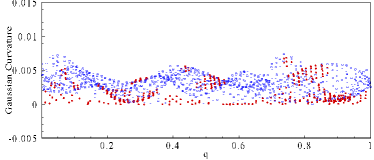
For all surface points including lipid and protein heads, we have also calculated (see Table 1) the average Gaussian curvature and its standard deviation using (13) and (18). Right panels of Fig. 4 show the distribution of for lipid and protein heads. Based on the Gauss-Bonnet theorem, any compact manifold without boundary, is topologically equivalent to a sphere and the surface integral of Gaussian curvature will be invariant. Since our vesicles become aspherical through the shape transformations induced by protein clustering, Gauss-Bonnet theorem applies and all models – must be topologically equivalent. Given that the head groups of proteins and lipids are identical in our simulations and the areas of generating bilayers are almost the same, the surface integral will be approximately equal to . Data in Table 1 show that both and remain invariant (from one vesicle to another) within a reasonable error threshold. This confirms the self-consistency of our models and the results obtained from spherical harmonic expansions.
IV.3 Convergence tests
We have continued our simulations until the size and number of clusters become constant in a relaxed equilibrium state. To assure that simulated vesicles are in equilibrium, we have carried out various experiments. In the first experiment we generated two vesicles from the same progenitor bilayer of , but using two different sets of randomly distributed proteins. We have given the properties of new vesicles and in Table 2. Although the vesicles , and start from different initial conditions, there are minor differences between the properties of their clusters. Notably, they posses the same shape indicator =.
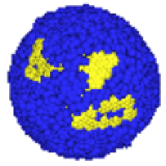
To demonstrate that we usually reach a physical equilibrium and not a kinetically trapped state, we designed a second experiment and produced a vesicle from an initial bilayer where = proteins (similar to vesicle ) had formed an initial big cluster. In the resulting vesicle , the proteins of the initial single cluster are dissociated into three smaller separate clusters as shown in Fig. 5. This result is, again, consistent with the general features of , which had been obtained from a completely different initial condition. It is worth noting that we have observed a transient interplay between clustering and fragmentation well before reaching the equilibrium state.
We have repeated our simulations with and with non-flexible lipid and protein chains. Using a bending stiffness in lipids and in protein strands, the bilayer vesicle transition is slowed down but we do not observe considerable change, either quantitative or qualitative, in the clustering phenomenon and the shape transformation of vesicles: the numbers and sizes of final clusters and the shape parameter are similar in all models. By making stiffer molecular chains and increasing the density, lipid diffusion is decreased, which in turn, yields a longer relaxation time.
V Conclusions
We have studied the phenomena of protein clustering and membrane shape transformation during membrane vesiculation and afterwards. Comparing relaxed vesicles and bilayers shows that protein clustering during vesiculation occurs due to both entropy-driven depletion force and the curvature-mediated interactions. The latter effect enhances the generation of larger protein clusters and determines bilayer’s bending rigidity. Once the vesicle is formed, protein clusters locally flatten their host vesicles and increase the bending energy as and increase. The system, however, cannot tolerate the increase in the bending energy for protein concentrations beyond a critical value. By increasing the protein concentration, bigger protein clusters are not formed in our simulations, or they break apart. We anticipate a uniform distribution of fragmented clusters, like the shape of a soccer ball. Our observations show that low protein concentrations do not lead to efficient cluster formation.
Acknowledgements.
This work was partially supported by the research vice-presidency at Sharif University of Technology. We thank the referees for their constructive comments, which substantially improved the paper.References
- (1) R. Lipowsky, Curr. Opin. Struct. Biol., 5, 531 (1995).
- (2) U. Seifert, Advances in Physics, 46(1), 13 (1997).
- (3) J. Zimmerberg, and M.M. Kozlov, Nature Rev. Mol. Cell Biol., 7, 9 (2006).
- (4) H.T. McMahon, and J.L. Gallop, Nature, 438, 590(2005).
- (5) V. Vogel, M. Sheetz, Nature Rev. Mol. Cell Biol. 7, 265 (2006).
- (6) R. Phillips, T. Ursell, P. Wiggins, and P. Sens, Nature, 459, 379 (2009).
- (7) B.J. Reynwar, G. Illya, V.A. Harmandaris, M.M. Müller, K. Kremer, and M. Deserno, Nature, 447, 461 (2007).
- (8) K.S. Kim, J. Neu, and G. Oster, Biophys. J., 75, 2274 (1998).
- (9) O.S. Andersen, and R.E. Koeppe, Annu. Rev. Biophys. Biomol. Struct., 36, 107 (2007).
- (10) M.O. Jensen, and O.G. Mouritsen, Biochim. Biophys. Acta, 1666, 205 (2004).
- (11) M. Kozlov, Nature, 463, 439 (2010).
- (12) T.R. Weikl, M.M. Kozlov, and W. Helfrich, Phys. Rev. E, 57, 6988 (1998).
- (13) D.E. Chandler, et. al., Biophys. J., 95, 2822 (2008).
- (14) M. Venturoli, B. Smit, M.M. Sperotto, Biophys. J., 88, 1778 (2005).
- (15) A. Naji, P.J. Atzberger, and F.L.H. Brown, Phys. Rev. Lett., 102, 138102 (2009).
- (16) M. Venturoli, M.M. Sperotto,M. Kranenburg, B. Smit, Phys. Rep., 437, 1 (2006).
- (17) M.P. Allen and D.J. Tildesley, Computer Simulation of Liquids (Clarendon Press, Oxford, 1987).
- (18) A.J. Markvoort, K. Pieterse, M.N. Steijaert, P. Spijker, and P.A.J. Hilbers, J. Phys. Chem. B, , 109, 22649 (2005).
- (19) R. Goetz, R. Lipowsky, J. Chem. Phys., 108(17), 7397 (1998).
- (20) R. Goetz, G. Gompper, R. Lipowsky, Phys. Rev. Lett., 82(1), 221 (1999).
- (21) G.B. Arfken, Mathematical Methods for Physicists (Academic Press, New York, 1985).
- (22) S.A. Safran, Statistical Thermodynamics of Surfaces, Interfaces, and Membranes (Addison-Wesley Publishing Company, 1994).