An Infrared Nebula Associated with Cephei:
Evidence of Mass Loss?
Abstract
We present the discovery of an infrared nebula around the Cepheid prototype Cephei and its hot companion HD 213307. Large scale ( AU) nebulosity is detected at 5.8, 8.0, 24 and 70 µm. Surrounding the two stars, the 5.8 and 8.0 µm emission is largely attributable to Polycyclic Aromatic Hydrocarbon (PAH) emission swept from the ISM by a wind originating from Cephei and/or its companion. Stochastically heated small dust grains are the most likely source of the 24 and 70 µm extended emission. The 70 µm emission, in particular, resembles a bow shock aligned in the direction of the proper motion of Cephei. This discovery supports the hypothesis that Cephei may be currently losing mass, at a rate in the range to M⊙ yr-1.
1 Introduction
Cephei is a remarkable star. After John Goodricke recognized its variability in 1784 (Goodricke & Staatsoper, 1786), Cephei has lent its name to one of the most important classes of variable stars: Cepheids. Since the discovery of the period–luminosity (PL) relation (or “Leavitt law”, Leavitt 1908), Cepheids and their prototype Cephei have assumed a fundamental role as the “first rung” of the extragalactic distance scale. Cepheids are also a crucial benchmark for evolutionary models of intermediate-mass stars in the He-burning phase. Despite their importance, however, there are still a number of outstanding puzzles in the theoretical understanding of the stars pulsating like Cephei.
The most important issue is the discrepancy between the theoretical and dynamical mass of Cepheids. First noted by Christy (1968), Stobie (1969) and later by Fricke et al. (1972), this issue has been partially solved (Moskalik et al., 1992) with the adoption of modern sets of radiative opacities (Seaton et al., 1994; Rogers & Iglesias, 1992). However, several recent investigations focused on Galactic and Magellanic Clouds Cepheids (Bono et al., 2001, 2002; Beaulieu et al., 2001; Caputo et al., 2005; Keller & Wood, 2006; Evans et al., 2008) suggest that such a discrepancy still amounts to 10–15%. For example, according to Caputo et al. (2005) the pulsational mass of Cephei is M⊙, while the evolutionary mass of the star, based on the period-color-luminosity relations derived by the same authors, can be as high as M⊙. One possible solution for this problem is mass loss over the lifetime of these stars. Even though commonly used semi-empirical relations (Reimers et al., 1975; DeJager & Nieuwenhuijzen, 1997) do not predict enough mass loss to account for the Cepheids’ missing mass, these same relations are clearly inadequate to describe the mass loss in red giants (see e.g. Willson 2000) and in globular cluster stars on the Horizontal Branch (Yong et al., 2000; Castellani et al., 2006). These relations may similarly underestimate the mass loss rates in intermediate-mass stars like Cepheids.
Searches for evidence of current or past mass loss by Cepheids and their progenitors have been conducted at different ends of the electromagnetic spectrum. In the ultraviolet, Deasy (1988) observed a large sample of Cepheids with the International Ultraviolet Explorer (IUE) satellite, finding mass loss rates ranging from to yr-1. In the far-IR, McAlary & Welch (1986) found evidence in the IRAS photometry (Beichman et al., 1988) of very cool dust ( K) around two classical Cepheids (RS Pup and SU Cas) associated with reflection nebulosity. More recently, Neilson et al. (2009) measured mass loss rates of – yr-1 in a sample of Large Magellanic Cloud Cepheids in the mid-IR. In the near-IR, band interferometric observations detected circumstellar shells around nearby classical Cepheids (Mérand et al., 2006, 2007; Kervella et al., 2006, 2008, 2009), including Cephei. A difference in the absolute distance of Cephei when moving from V, I to V, K bands was also found by (Natale et al., 2008) by performing a detailed fit between predicted and observed light, radius, and radial velocity curves.
These detections offer tantalizing evidence in favor of Cepheid mass loss, but are not conclusive. In the case of the far-IR excess, the large beam of IRAS (′) does not allow separation of local dust emission from background “Galactic cirrus”. The near-IR shells detected with interferometers have radii as small as stellar radii (Mérand et al., 2006), and their origin is not well understood. To resolve these issues, we have obtained Spitzer Space Telescope (Werner et al., 2004a; Gehrz et al., 2007) observations of 29 Galactic Classical Cepheids with the Infrared Array Camera (IRAC, Fazio et al. 2004) and the Multiband Infrared Photometer for Spitzer (MIPS, Rieke et al. 2004). The results of this investigation are presented in Marengo et al. (2010) (PL and search for mid-IR color excess) and in Barmby et al. 2011 (search for extended emission).
In this paper we want to focus on Cephei. With a distance of 0.2730.011 kpc (Benedict et al., 2002) and a fundamental mode period of 5.37 d, Cephei is the second nearest Cepheid to the Solar System (only Polaris, a first overtone Cepheid, is closer). Cephei is also known to be part of a multiple star system. The B7-B8 III-V main sequence star HD 213307 (catalog HD 213317), long suspected to be a companion of Cephei (Fernie, 1966; Worley, 1966; Vitrichenko & Tsarevskii, 1969) shares proper motion with the Cepheid (Hoffleit & Jaschek, 1982; Benedict et al., 2002). Located 40″ ( AU) south of Cephei, HD 213307 may itself be a binary star (Benedict et al., 2002), with a low mass companion ( , F0 V) on a circular orbit with a radius of approximately 7 mas (1.9 AU). The three stars are part of the moving group Cep OB6 (de Zeeuw et al., 1999), together with another 18 members that are possibly part of an old OB association. The earliest spectral type (B5 III) among the stars in the association suggests an age of Myr, consistent with the estimated age of Cephei ( Myr according to the period-age-color relation derived by Bono et al. 2005, and using Cephei colors from Storm et al. 2004). The proximity of Cephei to the Sun, and the presence of a hot companion which can serve as a “probe” of the circumstellar environment of the system, make Cephei the ideal test case to search for evidence of Cepheids mass loss.
We report on the discovery of extended circumstellar emission around Cephei and its companions, detected at IRAC and MIPS wavelengths. This emission appears to be physically associated with Cephei, and may be evidence of active mass loss from this star. We detect a 70 µm arched structure with its axis aligned with the relative proper motion of Cephei with respect to the interstellar medium (ISM), and diffuse and filamentary emission at 5.8, 8.0 and 24 µm. In section 2 we present our Spitzer observations, while in section 3, 4 and 5 we discuss a possible explanation for the origin and the morphology of the observed structures, and estimate the mass loss rate required for their formation. In section 6 we summarize our results and conclusions.
2 Observations and Data Reduction
Cephei was observed with IRAC and MIPS in Cycle-3, as part of our General Observer program with PID 30666, and in Cycle-5 (IRAC only) as part of our Guarantee Time Observer program PID 50350. The GTO observations were meant to provide a second photometric epoch, and deeper observations aimed at being sensitive to faint circumstellar emission. The observations were executed on 2006 August 10 (JD = 2453957.601) and 2008 September 23 (JD = 2454732.832), using the IRAC full frame mode. The 2006 observations were obtained with a 5 point Gaussian dither pattern in IRAC “stellar mode”, with total integration times of 1.0 sec (3.6 and 4.5 µm) and 6.0 sec (5.8 and 8.0 µm). The 2008 data were instead acquired with a 36 point Reuleaux dither pattern with individual exposures of 1.6 sec integration time each, for a total exposure of 43.2 sec in each band. The MIPS observations were obtained on 2007 July 19 (JD = 2453935.518) in the 24 and 70 µm bands with the Photometry Astronomical Observation Template. The total on-source time was 48.2 sec and 37.7 sec at 24 µm and 70 µm respectively.
2.1 IRAC images and photometry
The IRAC data were reduced starting from the Basic Calibrated Data (BCDs) generated by the Spitzer pipeline versions S14.4.0 and S18.7.0 (2006 and 2008 datasets respectively). Mosaic images with a pixel scale of 0.8627″/pix were created using the IRACproc post-BCD software (Schuster et al., 2006).
In all IRAC images Cephei is saturated and we have determined its photometry using the PSF-fitting technique described in Marengo et al. (2010). The same technique was used to estimate the photometry of HD 213307 in the 2008 dataset, because of column pulldown (3.6 and 4.5 µm) and banding (5.8 and 8.0 µm) from the primary star overlapping with the position of the companion, making it impossible to derive accurate aperture photometry. For the 2006 data the HD 213307 brightness was determined with standard aperture photometry. The IRAC magnitudes so derived are listed in Table 1.
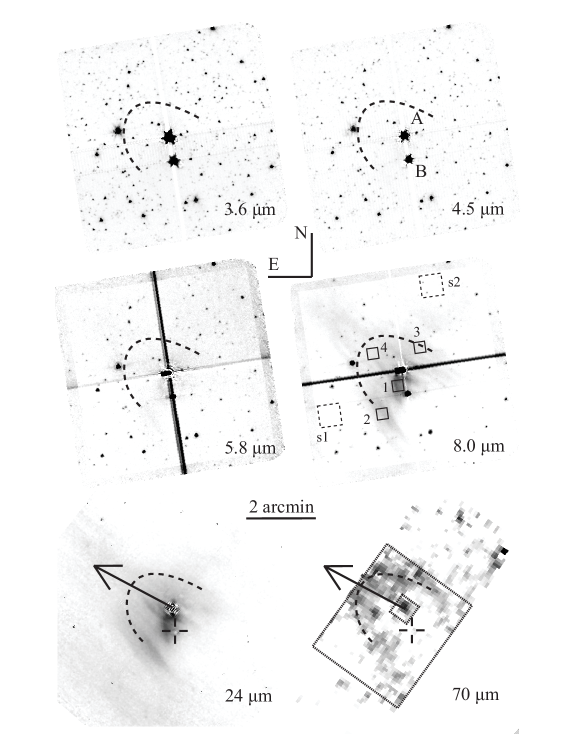
The IRAC images are shown in Figure 1, with Cephei and HD 213307 PSF-subtracted. For the first time, these stars are found to be surrounded by extended infrared emission, brightest at 8.0 µm and marginally detected at 5.8 µm. The emission is diffuse, mostly contained within the dashed arc plotted in the figure, and brighter in the region between the two stars. The extended infrared emission is on much larger spatial scale (up to ′, or AU at the Cephei distance) than the circumstellar near-infrared shell detected in the interferometric observations by Mérand et al. (2006) with a R∗ AU radius.
The surface brightness of the extended emission, measured in the deeper second epoch in the four boxes shown in Figure 1, is listed in Table 2. The sky background level has been measured in the two dashed boxes also shown in Figure 1. To take into account the background offset induced by array muxstriping, we have used sky box s1 for apertures 1 and 2, and sky box s2 for apertures 3 and 4. We have corrected the IRAC surface brightness with their extended source aperture corrections of 0.91, 0.94, 0.70 and 0.74 at 3.6, 4.5, 5.8 and 8.0 µm respectively. Where no extended emission was detected, we listed the 3 limits.
2.2 MIPS images and photometry
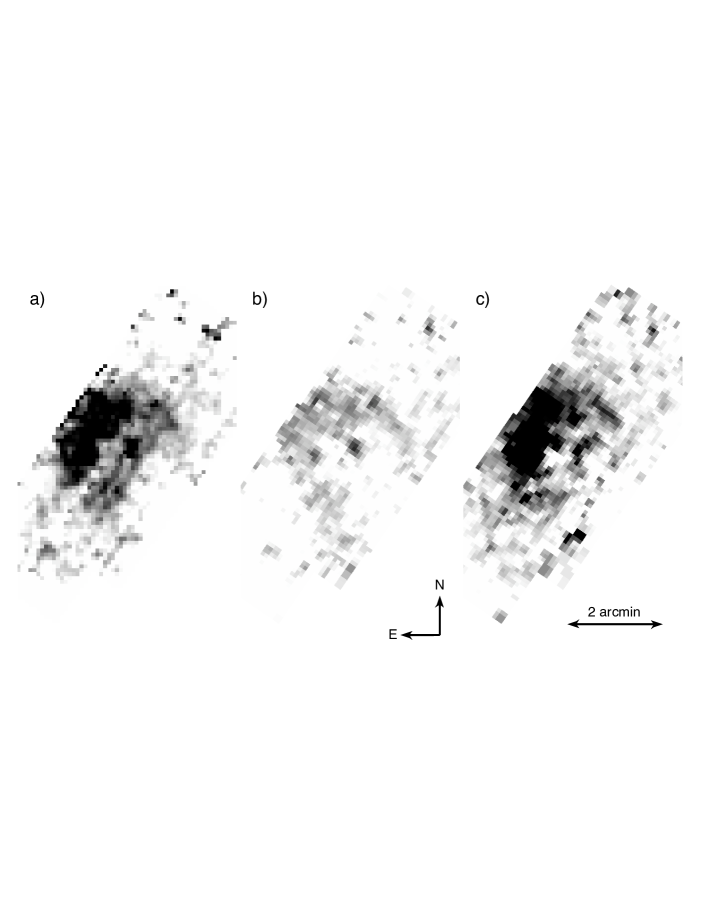
We reduced the MIPS data using the MIPS instrument team Data Analysis Tool (Gordon et al., 2005). The processing of the 24 µm data was straightforward, and the final image is shown in Figure 1. To remove column-like instrument artifacts, the 70 µm data needs to be time filtered with the source region excluded: this operation is complicated in our images because of the narrow field of view, and extended luminosity covering a substantial fraction of the detector. In Figure 2 we show the resulting filtered images using three different filtering choices. Panel a shows the mosaic without any filtering applied (leaving the strip pattern noise). The center and right panels show instead the result of excluding the default source point region size (b, similar to the default region chosen by the Spitzer Science Center post-BCD pipeline) and excluding the whole nebulosity area (panel c).
The 24 µm nebulosity is morphologically similar to the one in the IRAC 8.0 µm map, and is also mostly contained within the arched envelope plotted in Figure 1, even though there are faint extended lanes at larger spatial scales. It is also brightest close to Cephei and its companion, showing the same structures detected at 8.0 µm.
The 70 µm image shows strong extended emission on the N-E side of Cephei, stronger along the arched envelope marked in Figure 1. The detailed morphology of this structure depends on the choice for the filtering exclusion region. The default choice highlights the high spatial frequencies allowing us to follow the arched structure through the whole width of the array. The larger exclusion region instead enhances the low spatial frequencies, showing better the faint nebulosity in between the star and the cusps of the arc. The actual shape of the nebulosity is most likely a combination of the two, but a 70 µm image with larger field of view would be required to properly filter the map and assess its background emission level.
The 24 µm and 70 µm magnitudes of Cephei and its companion, derived with standard aperture photometry as described in Marengo et al. (2010), are listed in Table 1. At 70 µm Cephei is detected with less than 3 significance ( mJy, from the default filtered image, which best preserves the point source). Within the uncertainty, the color of the star (with respect to the simultaneous 24 µm band) is zero, indicating absence of significant amount of warm and cold dust near the star (confirming the results given in Marengo et al. 2010).
We have estimated the 24 and 70 µm surface brightness of the extended emission in the same four boxes shown in Figure 1. The background level was estimated by averaging the surface brightness values in the two sky boxes, also marked in Figure 1. The surface brightness is listed in Table 2. For the 70 µm emission, we list the two values corresponding to the different filtering options described above.
3 The Cephei Nebula
With a Galactic latitude of , Cephei is directly projected against the outer Galactic plane, in an area with diffuse infrared-emitting background “cirrus”. Inspection of wide field 24 and 70 µm part of the “Spitzer Mapping of the Outer Galaxy” survey (SMOG), from the Spitzer archive, shows that the diffuse emission centered around Cephei is contiguous to a system of larger Galactic structures. Understanding if the nebulosity around Cephei is physically associated with the star, rather than a chance superposition with background interstellar clouds, is critical to investigate the mass loss history of the star. As part of the Spitzer Cycle-5 program PID 50346, we proposed to obtain a Infrared Spectrograph (IRS, Houck et al. 2004) spectral energy distribution of the Cephei extended emission in key areas around the star, to investigate the presence of diagnostic features within the IRAC and MIPS bands, and thus identify the nature of the circumstellar matter. The exhaustion of the spacecraft LHe refrigerant at the end of the cryogenic mission, however, prevented this part of the program from being executed. Program PID 40968 on 2007 December 10 obtained an IRS high resolution spectrum centered on Cephei. The data however do not show other emission than the strong photospheric flux.
In absence of spectra for the extended emission, we compared our Cephei IRAC and MIPS images with the observations of a similar source, for which IRS spectra are available. Following Kervella et al. (2009), we adopted the dusty reflection nebula NGC 7023 as an “analog” for a Cepheid precursor surrounded by circumstellar nebulosity. The central source in this system, the binary star HD 200775, has a B2Ve composite spectral type, similar to the Cephei B7-8 companion HD 213307. With masses of 11 and 9 (Alecian et al., 2008), the two stars at the center of NGC 7023 may become Cepheids themselves within a few tens of million years. Studying the diffuse emission in NGC 7023 thus offers the chance to probe a system both representative of an early version of Cephei, and powered by a central stellar engine similar to the Cephei companion.
NGC 7023 was observed with all Spitzer instruments as part of the Early Release Observation programs 717 and 1093. The central stars are embedded in a reflection nebula characterized by bright filaments surrounding an hourglass-shaped cavity (filled with CO emission) probably formed by outflow activity in the HD 200775 past. The IRS spectral energy distribution in a location along one of the bright filaments has been presented and discussed in Werner et al. (2004b). We have derived the surface brightness of the filaments in all IRAC and MIPS images in the same filament location (position “A” in Figure 2 of Werner et al. 2004b), and listed them in Table 2. This location is situated at a distance of AU from the central stars (using a distance of 430 pc for NGC 7023, according to van den Ancker 1997), similar to the radius of the bright 70 µm arc in the Cephei system. The availability of the complete infrared spectrum at this location allows us to determine the prevalent mechanisms of emission responsible for the NGC 7023 diffuse luminosity in the IRAC and MIPS bands and, by extension, provide diagnostic tools for the unknown emission around Cephei.
Werner et al. (2004b) showed that the bulk of the flux in the IRAC bands at 5.8 and 8.0 µm is due to strong PAH and other aromatic emission features. Fainter emission detected at 3.6 and 4.5 µm is likely related to weaker H2 lines. The stronger flux in the MIPS bands, in contrast, is associated with thermal emission from Very Small dust Grains (VSGs) that are stochastically heated by single UV photons generated by the central B stars. This interpretation is confirmed by comparing the and surface brightness ratio of the filament with models of interstellar dust computed by Draine & Li (2007). These models cannot be strictly applied because of the different assumption in the spectrum of the input energy field: two B stars in the case of the NGC 7023 nebula and a scaled interstellar radiation field derived for the solar neighborhood by Mathis et al. (1983) for the Draine & Li (2007) models. It is nevertheless instructive to note that the flux ratios in the NGC 7023 filament can be reproduced by assuming an irradiation of the nebular material by a field equal to times the interstellar radiation field in the solar neighborhood, and a PAH dust fraction %.
The surface brightness ratios of the NGC 7023 filament, and of the four locations in the Cephei nebula listed in Table 2 are plotted in Figure 3. The figure shows that the Cephei emission has a significantly smaller than NGC 7023, suggesting a PAH content % (based on Draine & Li 2007). The Cephei nebula ratio along the 70 µm arc is as high as times the corresponding ratio for the NGC 7023 filament, suggesting a temperature distribution of the dust grains around the Cepheid peaked at higher values. It is worth noting that the flux ratio (and hence the dust temperature) appears to be loosely correlated with the distance of each box from the two stars in the Cephei system. In particular, the flux ratio in box 1, located on the bright filament in between the two stars, is more than 4 times larger than in the other three boxes: this is strong evidence supporting the hypothesis that the main energy input for the Cephei nebula is the two central stars, and thus that the nebula itself is local, and not a background cloud in a chance alignment. We do not detect any emission at 3.6 and 4.5 µm. Nevertheless, we cannot exclude the presence of shocked H2 molecules around Cephei, since H2 line emission would be undetected in our images if its and ratios were similar to what we have measured in the NGC 7023 filament.
4 A far-IR Bow Shock?
The envelope of the 70 µm emission is shaped like a paraboloid centered on Cephei and its companion. Structures of this kind are often associated with bow shocks that form due to the interaction of a stellar wind with the surrounding ISM (see e.g. Wareing et al. 2006). Bow shocks can be bright in the thermal infrared, when the accumulated interstellar material, or the stellar wind itself, is rich in dust. Examples of these structures around evolved stars abound, including the case of the Asymptotic Giant Branch (AGB) star R Hya (Ueta et al., 2006; Wareing et al., 2006) and the supergiant Ori (Ueta et al., 2008a). The Mira variable class prototype Ceti also shows a complex infrared bow shock structure, associated with a UV and infrared-bright “cometary tail” that is generated as the star plows at high velocity through its local ISM (Ueta, 2008b). If the far-IR structure surrounding Cephei is indeed a bow shock, its axis is expected to be aligned with the direction of the star’s motion through the ISM.
Following the prescription of Johnson & Soderblom (1987), we have computed the components of the Galactic peculiar space motion of the two stars, . For these calculations we assumed the following parameters for Cephei (HD 213307): heliocentric radial velocity km s-1 ( km s-1) from Wilson (1953); proper motion in right ascension 16.47 mas yr-1 (16.48 mas yr-1) and proper motion in declination 3.55 mas yr-1 (4.70 mas yr-1) from the Hipparcos database (Perryman et al., 1997). We used the parallax of 3.66 mas (3.65 mas) from Benedict et al. (2002). With the exception of the radial velocity, the values for the two stars are all consistent to within uncertainties. Correction for the solar motion using the constants of Dehnen & Binney (1998) yields km s-1 for Cephei and km s-1 for HD 213307. Projecting back into an equatorial reference frame then gives km s-1 and km s-1, respectively. This implies a space velocity for Cephei of km s-1 along a position angle of 59∘ and a space velocity for HD 213307 of km s-1 along a position angle of 52∘.
Figure 1 shows that the velocity vector of Cephei with respect to the motion of its local ISM, is roughly aligned with the symmetry axis of the 70 µm paraboloid emission. While this is not a proof that the shape is indeed the result of a bow shock, it strongly suggests that this may be the case. If a bow shock forms in front of Cephei, conservation of momentum implies that the star must be losing mass, in the form of a wind interacting with the ISM.
How much dust mass is associated with the 70 µm emission? If we assume that the dust is optically thin, we can estimate the total mass of the dust responsible for the 70 µm emission, following Evans et al. (2003):
| (1) |
where is the total flux of the extended emission at 70 µm in Jy, is the distance in kpc, cm2 g-1 is the dust opacity from Ossenkopf & Henning (1994) for a Mathis-Rumpl-Nordsieck dust distribution (Mathis et al., 1977), is the Planck function in c.g.s units and is the temperature of the dust.
Even though, as noted in Section 3, the small dust grains responsible for the far-IR emission are most likely stochastically heated, we can still estimate the mode of the grain temperature distribution as the color temperature of the flux ratio. Boxes 2, 3 and 4, lying on the 70 µm bright arc, have color temperature in the range of 85 – 110 K, comparable with the color temperature of the NGC 7023 filament ( K). The color temperature of the dust in box 1, placed in between Cephei and HD 213307, is however much higher ( K), as expected if heated by the radiation from the two close-by stars.
The total 70 µm flux density of the arched emission, measured in the dotted rectangular annulus in Figure 1 is between 1.0 and 2.8 Jy, depending on which data reduction product is used. We used a rectangular aperture to exclude the flux from the marginally detected star. From Equation 1, using the average color temperature K along the arched structure, and Jy, we have M⊙. If we assume a gas to dust mass ratio of , typical of ISM and circumstellar dust, we obtain a total mass of gas and dust of M⊙. A minimum age of this structure is given by the time required by a stellar wind to reach the arc from Cephei (or its companion). In the case of Cephei, the wind speed is expected to be comparable to the escape velocity ( km s-1; e.g. Welch & Duric 1988), i.e. several times higher than is typical for AGB stars. This implies a minimum age of yr for the structure, and a maximum mass loss rate of M⊙ yr-1. These value is at the upper end of the Cepheids mass loss rates proposed by Deasy (1988).
We can also derive a minimum mass loss rate required to produce the observed bow shock structure using the standard stellar wind/ram pressure balance condition (e.g., Raga & Cantó 2008):
| (2) |
Here is the standoff distance of the bow shock, is the ambient ISM density, is the space velocity of the star relative to the ambient medium, and is the wind outflow velocity. From our Spitzer images we measure arcmin (0.103 pc). We assume that the surrounding medium is pure atomic hydrogen and, from Dickey & Lockman (1990), a typical particle density in the Galactic plane is cm-3, implying g cm-3. Finally, adopting an expected outflow velocity for the Cepheid wind of km s-1 (see above), we find M⊙ yr-1. While this value can be considered only approximate given the uncertainties in the wind speed for the star and the local ISM density, it is nonetheless consistent with the predictions of Deasy (1988) for Cepheid mass-loss rates (albeit significantly higher than the M⊙ yr-1 predicted by Neilson & Lester 2008 for this star). In particular, if Cephei sits in a over-dense area of the Galactic plane, as the SMOG and IRAS maps imply, the ISM density (and thus the minimum ) could be higher.
The fact that the mass-loss rate derived using this approach is one magnitude lower than the estimate computed above, using the observed properties of the dust emission, suggests that part of the bow shock may be comprised of swept up interstellar material rather than entirely shed from the star. Our images in fact do not allow us to determine how much of the detected mass is coming from the star, rather than being swept from the ISM by the stellar wind (see also discussion below on why at least the PAH emission detected at 8.0 µm is likely of interstellar origin). The presence of a bow-shock structure, however, argues in favor of a stellar wind pushing against the ISM, and thus at least part of this mass ought to come from the star, with a mass loss rate of at least M⊙ yr-1 and up to M⊙ yr-1.
Given the high luminosity of the Cepheid and its companion, it is fair to ask if the observed dust-free bubble around the stars may be generated by effect of radiation pressure alone, without the need of invoking a Cepheid winds. The radiation pressure has an inverse square law variation and therefore acts like a repulsive “Coulomb” force. If an interstellar grain of mass has speed km s-1 relative to the star, then the distance of closest approach is given by:
| (3) |
where is the luminosity of the Cepheid ( L⊙), is the speed of light, is the radius of a grain and is a dimensionless number to express the effective momentum coupling to the geometric cross section. For a spherical grain of radius and density g cm-3 (typical value of astronomical silicates):
| (4) |
Given that dust grains are opaque at optical and near-IR radiation, we can assume . According to equation 4 a distance of closest approach pc is obtained for dust grains with radius µm.
However, based on the discussion in Section 3, the 24 and 70 µm emission is most likely due to stochastically heated VSGs, that have a typical radius of µm. Such grains would be blown out by radiation pressure at a distance two order of magnitudes larger than the observed pc. Furthermore, the opening angle of a dust-free bubble created by radiation pressure would be much larger than the one observed: for the direction orthogonal to the space velocity of the star with respect to the ISM, the dust grains will have a zero radial component velocity, and will be blown out at a distance much larger than derived from Equation 4, in contrast to the narrow arc observed in Figure 1. The small size of the emitting grains, and the shape of the arched structure, imply that gas drag is likely to play a strong role in preventing the dust grains from being blown out by the radiation pressure. While radiation pressure is likely to play some role in the dynamic of the system, we thus still favor the hypothesis that the arched structure is due to a mechanical force acting on both interstellar gas and dust, due to a wind originating from the stars in the system.
Detection of emission lines from the shocked material along the arc would confirm that the structure is indeed a bow shock generated by a stellar wind pushing on the ISM. The power in the stellar wind is given by . With km s-1 and a mass loss rate in the range of to M⊙ yr-1, to L⊙. This energy will likely be dissipated in a radiative shock, and emission lines (among which H2 or CO) could be observable. This was one of the main motivations for our Spitzer/IRS cycle-5 program, that was unfortunately not executed before the end of the cryogenic mission. We have plans to attempt the detection of these lines with ground-based near-IR observations (searching for the µm H2 lines) and possibly with the Herschel Space Telescope as a follow-up of our OT-1 imaging proposal. L Band VLA 21 cm observations could also be attempted in search of HI assuming that any structured emission around the star can be successfully disentangled from Galactic foreground and background emission.
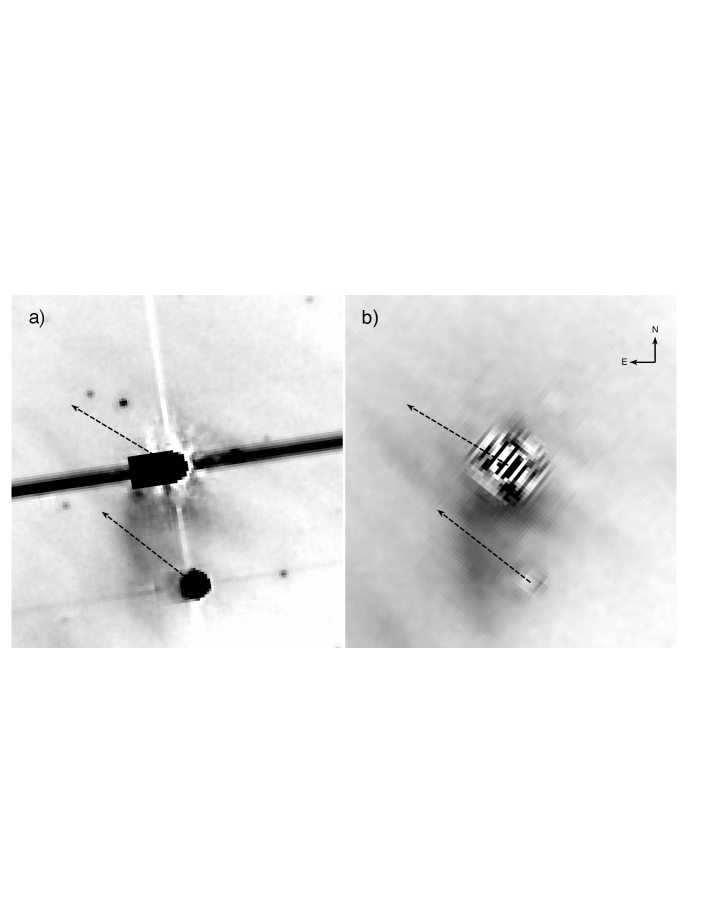
5 The Nebulosity Near the Two Stars
Figure 4 shows the 8.0 and 24 µm emission in the region immediately around Cephei and HD 213307. This is the area where the diffuse circumstellar emission is stronger at these two wavelength (box 1 in Figure 1), and lowest at 70 µm, corresponding to a color temperature of K. The figure shows the rather complex morphology of this emission, with a small arched structure that seems to be connecting the two stars, and other filaments arching away from Cephei. Can the morphology of this emission be explained in context of the Cephei mass loss hypothesis? In absence of a complete geometry of the region (in particular, the relative position of the two stars along the line of sight) and kinematic data for the nebulosity, we can only speculate about the origin of these structures.
One possibility is that the arched structure is in fact a second bow shock, this time associated to HD 213307. While the structure is not perfectly aligned with the relative motion of HD 213307 with respect to the ISM (but still within the uncertainties), it is instructive to evaluate what would be the mass loss rate required for its creation. The standoff distance of the arc from HD 213307 is in this case arcsec (0.034 pc), and the escape velocity from HD 213307 (a B7-B8 main sequence star) is km s-1. Using equation 2, one obtains a required mass loss rate of M⊙ yr-1, more than one order of magnitude smaller than the minimum mass loss rate that we have estimated for Cephei. This is in agreement with the expectation that a late-B star like HD 213307 should not have a strong wind (see e.g. Hempel & Holweger 2003), as winds drop off strongly in late B stars (Kudritzki & Puls 2000; see also eq. 25 in Vink et al. 2001 predicting for a B7 main sequence star with K, L⊙, M⊙, solar metallicity and a galactic value of ). The imperfect alignment of the arc with respect to the HD 213307 motion, and the brightening of the arc near Cephei could be explained by the interaction of the two stellar winds and with the irradiation of the HD 213307 bow shock from the Cepheid photons. This explanation requires that the distance of the two stars along the line of sight is significantly larger than their distance on the plane of the sky, outside the 3-dimensional paraboloid partially evacuated by the Cephei wind. Conversely, if the two stars were on the same plane, a bow shock from HD 213307 would be blown away by a stronger wind from Cephei. The uncertainly in the parallax of the two stars is large enough to allow this geometry. If this hypothesis is correct, then the possibility that Cephei is the origin of a wind responsible for the large, 70 µm bright, arc is strongly supported, as the weak wind from HD 213307 would not be sufficient to generate a bow shock at the standoff distance of 0.103 pc.
Another possibility involves wind mass transfer between Cephei and HD 213307, similar to the structures observed between Ceti and its compact companion in the UV (Karovska et al., 1997) but also in the thermal infrared (Marengo et al., 2001). The much larger separation of Cephei from HD 213307, with respect to the separation of Ceti from its companion, makes however this interpretation very unlikely. An asymmetric mass ejection from Cephei, in the chance direction of HD 213307 is also very unlikely because it would require non-radial oscillations with such strength that has never been observed in a Cepheid, or strong irradiation of the Cephei atmosphere by the HD 213307 photons which is however negligible. The possibility that the arched structure is in fact originating from the F0 V companion of HD 213307, being irradiated by the nearby B star, is also to be discounted. While the flux from HD 213307 contributes to as much as % to the photospheric flux of the F0 V companion, a plume from this star (orbiting HD 213307 with a period of yr, see Benedict et al. 2002) would generate a tightly wound spiral. Assuming again a wind from HD 213307 as fast as its escape velocity, the spacing in the plume spiral would be AU, much smaller than the wide arc observed in the images.
The exact nature of the structures seen in proximity of the two stars is difficult to assess with the available data. However, the presence of enhanced nebulosity nearest to the two stars is strongly supportive of the hypothesis that the overall structures that we have detected around Cephei and its companion are local, rather than a chance alignement with ISM background cirrus.
6 Discussion and conclusions
Our Cephei Spitzer data provides a new and unique view of the recent and current mass loss history of a Classical Cepheid star. This system is special, in that the presence of a B spectral type companion provides enough UV photons to excite the circumstellar molecules, making it possible to map them at infrared wavelengths. In the sample of 29 Cepheids observed with Spitzer (Marengo et al., 2010), 8 have hot companions, but HD 213307 is significantly hotter than all of the others, with the exception of S Mus that also shows signs of extended emission (Barmby et al., 2011). The question arises as to whether Cephei may be unique in having mass loss as the result of the presence of HD 213307. The answer is most likely negative, given that the wide separation of the companion is probably too large to affect the mass loss properties of the Cepheid. None of the Cephei properties as Cepheid (period, luminosity, or amplitude) suggest it is unusually likely to have a mass loss episode. We can then expect the mass-loss properties of Cephei to be representative of Classical Cepheids in general, with the only difference that the presence of HD 213307 and the peculiar motion of Cephei with respect to the ISM makes any stellar ejecta easier to detect.
The presence of local (i.e. circumstellar) structures resembling a bow shock is strong evidence that one or both stars in the system are currently losing mass. The 70 µm emission is better aligned with respect to the Cephei position and relative proper motion vector (with respect to the ISM), although the low resolution and sensitivity at this wavelength is not good enough to rule out alignment with the companion HD 213307. While the wind responsible for this structure may be arising from either star (or both), the circumstellar shell found by near-IR interferometers (Mérand et al., 2006) around Cephei strongly supports the possibility that the Cepheid star is the origin of the wind. The weak wind expected by a late B star like HD 213307 is also unlikely to be able to form a bow shock with the observed standoff distance of the 70 µm structure. An independent confirmation of this expectation could be obtained by showing that the arched filament near the two stars is indeed a secondary bow shock generated by a weak wind coming from HD 213307.
Kervella et al. (2009) found extensive ( to AU) “warm” ( K) emission in Spitzer and ground-based mid-IR images of RS Pup and Car, which they attributed to dusty mass loss from these stars (as opposed to cold dust emission, K, in the large massive nebula around RS Pup, attributed to ISM material compressed by the Cepheid wind). Our images suggest that part of the material responsible for the extended emission around Cephei is of interstellar origin. Dust grains at K (the color temperature of the arc) are too cold to explain the observed ratio. On the other hand, PAH emission as described by Draine & Li (2007) provides a reasonable fit of the data. Given the typical abundances of Cepheid atmospheres (where C/O 1), if dust were to form, its composition would largely be characterized by O-rich silicates and not by carbon-based PAH. Furthermore, if indeed Cephei ( K) is currently losing mass, the wind is likely to be atomic and dust free, at least in proximity of the stellar photosphere (e.g. Glassgold & Huggins 1983). This is in agreement with the absence of significant infrared excess we measured close to the star (see Marengo et al. 2010), and the fact that the circumstellar shell found by Mérand et al. (2006) would have an equilibrium temperature too high for astrophysical dust survival.
We can conclude that the structures we detect with Spitzer are likely the consequence of the interaction of a Cephei wind with the local ISM. The low dust content of this wind near the star implies a different driving mechanism than the dust-driven wind commonly associated to evolved stars. As suggested by Mérand et al. (2006), as an explanation for the shell structures observed with interferometry, it is conceivable that this “dustless” wind from Cephei is perhaps triggered by the pulsation and shocks crossing the atmosphere. As it expands, this wind interacts with the ISM, leading to the formation of the bow-shock oriented with the proper motion of the Cepheid. The dilution of the ISM by the Cepheid wind is in agreement with the observed low abundance of PAH (less than one third of the abundance in the NCG 7023 nebula). Without detailed dynamical data it is however difficult to accurately determine which fraction of the dust responsible for the strong 24 and 70 µm emission is of interstellar origin, and how much is condensed in the outflow as it expands and cools.
A star with the evolutionary mass of Cephei will stay in the instability strip for a total time Myr (second and third crossing of the strip during the star’s blue loop, see Bono et al. 2000). If mass loss with a rate at the upper limit of our measured range ( M⊙ yr-1) is sustained through all the Cepheid phase, the total mass that could be ejected would be as high as M⊙. This is % of the total current pulsational mass of Cephei. While not enough to completely account for the Cepheid mass discrepancy, this value may represent a significant portion of it, with possibly more mass lost at the onset of central He-burning (RG) phase, before the star crossed the Cepheid instability strip. A mass loss rate closer to our lower limit ( M⊙ yr-1), however, would only result in the ejection of a more modest M⊙, or % of the current pulsational mass of Cephei. Firm constraints on the Cepheid mass loss rate will also have a significant impact on the plausibility of the predicted Mass-Luminosity relation of intermediate-mass stars during central helium burning phases.
Far-IR images with higher angular resolution, larger field of view and better sensitivity are required to provide a better estimate of the current Cephei mass loss rate, and the contribution of mass loss to solve the Cepheids mass discrepancy. Targeted observations with the Herschel space telescope, and high sensitivity radio maps in atomic and molecular H and CO, may be capable of characterizing the morphology and thermal structure of the large scale emission around this star, thus probing its mass loss history before and during the onset of the Cepheid phase.
In summary, our Spitzer images have detected strong extended nebulosity around Cephei and its companion HD 213307. This nebulosity is likely to be local, due to mass loss processes from one or both stars. A large scale far-IR arc, in particular, may be associated with a bow shock generated by the wind of Cephei as it moves through the ISM. This is one of the strongest direct evidence to date of Cepheid mass loss, and the best available direct measurement of the mass loss rate for a Classical Cepheid, which we estimate to be in the range of to M⊙ yr-1.
References
- Alecian et al. (2008) Alecian, E. et al. 2008, MNRAS, 385, 391
- Barmby et al. (2011) Barmby, P., Marengo, M., Evans, N. R., Bono, G., Huelsman, D., Su, K. Y. L., Welch, D. L. & Fazio, G., G. 2011, AJ, 141, 42
- Beaulieu et al. (2001) Beaulieu, J. P., Buchler, J. R. & Kollath, Z. 2001, A&A, 373, 164
- Beichman et al. (1988) Beichman, C. A., Neugerbauer, G., Habing, H. J., Clegg, P. E. & Chester, T. J., eds. 1988, IRAS Catalogs and Atlases., Vol. 1: Explanatory Supplement (Pasadena, CA: JPL)
- Benedict et al. (2002) Benedict, G. F. et al. 2002, AJ, 124, 1695
- Bono et al. (2000) Bono, G., Caputo, F., Cassisi, S., Marconi, M., Piersanti, L. & Tornambè, A. 2000, ApJ, 543, 955
- Bono et al. (2001) Bono, G., Gieren, W. Marconi, M., Fouqué & P. Caputo, F. 2001, ApJ, 563, 319
- Bono et al. (2002) Bono, G., Castellani, V. & Marconi, M. 2002, ApJ, 565, L83
- Bono et al. (2005) Bono, G., Marconi, M., Cassisi, S., Caputo, F., Gieren, W. & Pietrzynski, G. 2005, ApJ, 621, 966
- Caputo et al. (2005) Caputo, F., Bono, G., Fiorentino, G., Marconi, M. & Musella, I. 2005, ApJ, 629, 1021
- Castellani et al. (2006) Castellani, V., Iannicola, G., Bono, G., Zoccali, M., Cassisi, S. & Buonanno, R. 2006, A&A, 446, 569
- Christy (1968) Christy, R. F. 1968, Quart. J. Roy. Astron. Soc, 9, 13
- Deasy (1988) Deasy, H. P. 1988, MNRAS, 231, 673
- DeJager & Nieuwenhuijzen (1997) de Jager C. & Nieuwenhuijzen, H. 1997, MNRAS, 290, L50
- Dehnen & Binney (1998) Dehnen, W. & Binney, J. 1998, MNRAS, 298, 387
- de Zeeuw et al. (1999) de Zeeuw, P. T., Hoogerwerf, R., de Bruijne, J. H. J., Brown, A. G. A. & Blaauw, A. 1999, AJ, 117, 354
- Dickey & Lockman (1990) Dickey, J. M. & Lockman, F. J. 1990, ARA&A, 28, 215
- Draine & Li (2007) Draine, B.T. & Li, A. 2007, ApJ, 657, 810
- Evans et al. (2003) Evans, A. Stickel, M., van Loon, J. Th., Eyres, S. P. S., Hopwood, M., E., L. & Penny, A. J. 2003, A&A, 408, L9
- Evans et al. (2008) Evans, N. R., Schaefer, G. H., Bond, H. E., Bono, G., Karovska, M., Nelan, E., Sasselov, D. & Mason, B. 2008, AJ, 136, 1137
- Fazio et al. (2004) Fazio, G. G. et al. 2004, ApJS, 154, 10
- Fernie (1966) Fernie, J. D. 1966, AJ, 71, 119
- Fricke et al. (1972) Fricke, K., Stobie, R. S. & Strittmatter, P. A. 1972, ApJ, 171, 593
- Gehrz et al. (2007) Gehrz, R. D. et al. 2007, Rev. Sci. Instrum., 78, 011302
- Glassgold & Huggins (1983) Glassgold, A. E. & Huggins, P. J. 1983, MNRAS, 203, 517
- Goodricke & Staatsoper (1786) Goodricke, J. B. & Staatsoper,Bayerische 1786, Phil. Trans. of the Royal Astronomical Soc., 76, 48
- Gordon et al. (2005) Gordon, K. D. et al. 2005, PASP, 117, 503
- Hempel & Holweger (2003) Hempel, M. & Holweger, H. 2003, A&A, 408, 1065
- Hoffleit & Jaschek (1982) Hoffleit, D. & Jaschek, C. 1982, The Bright Star Catalogue (4th ed.; New Haven: Yale Univ. Obs.)
- Houck et al. (2004) Houck, J. R. et al. 2004, ApJS, 154, 18
- Johnson & Soderblom (1987) Johnson, D. R. H. & Soderblom, D. R. 1987, AJ, 93, 864
- Karovska et al. (1997) Karovska, M., Hack, W., Raymond, J. & Guinan, E. 1997, ApJ, 482, L175
- Keller & Wood (2006) Keller, S. C. & Wood, P. R. 2006, ApJ, 642, 834
- Kervella et al. (2006) Kervella, P., Mérand, A., Perrin, G. & Coudé Du Foresto, V. 2006, A&A, 448, 623
- Kervella et al. (2008) Kervella, P., Mérand, A., Szabados, L., Fouqué, P., Bersier, D., Pompei, E. & Perrin, G. 2008, A&A, 480, 167
- Kervella et al. (2009) Kervella, P., Mérand, A. & Gallenne, A. 2009, A&A, 498, 425
- Kudritzki & Puls (2000) Kudritzki, R-P. & Puls, J. 2000, ARA&A, 38, 613
- Leavitt (1908) Leavitt, H.S. 1908, Ann. Harvard Coll. Obs. 60, 87
- Marengo et al. (2001) Marengo, M., Karovska, M. Fazio, G. G., Hora, J. L., Hoffmann, W. F.,Dayal, A. & Deutsch, L. K. 2001, ApJ, 556, L47
- Marengo et al. (2010) Marengo, M., Evans, N. R., Barmby, P., Bono, G., Welch, D. & Romaniello, M. 2010, ApJ, 709, 120
- Mathis et al. (1977) Mathis, J. S., Rumpl, W. & Nordsieck, K. H. 1977, ApJ, 217, 425
- Mathis et al. (1983) Mathis, J. S., Mezger, P. G. & Panagia, N. 1983, A&A, 128, 212
- McAlary & Welch (1986) McAlary, C. W. & Welch, D. L. 1986, AJ, 91, 1209
- Mérand et al. (2006) Mérand, A. et al. 2006, A&A, 453, 155
- Mérand et al. (2007) Mérand, A. et al. 2007, ApJ, 664, 1093
- Moskalik et al. (1992) Moskalik, P. Buchler, J.R. & Marom, A. 1992, ApJ, 385, 685
- Natale et al. (2008) Natale, G., Marconi, M., Bono, G. 2008, ApJ, 674, L93
- Neilson & Lester (2008) Neilson, H. R. & Lester, J. B. 2008, ApJ, 684, 569
- Neilson et al. (2009) Neilson, H. R., Ngeow, C.-C., Kanbur, S. M. & Lester, J. B. 2009, ApJ, 692, 81
- Ossenkopf & Henning (1994) Ossenkopf, V. & Henning, T. 1994, A&A, 291, 943
- Perryman et al. (1997) Perryman, M. A. C. et al. 1997, A&A, 323, 49
- Raga & Cantó (2008) Raga, A. C. & Cantó, J. 2008, ApJ, 685, L141
- Rieke et al. (2004) Rieke, G. et al. 2004, ApJS, 154, 25
- Reimers et al. (1975) Reimers, D., 1975, Mem. Soc. Roy. Sci. Liege, 8, 369
- Rogers & Iglesias (1992) Rogers, F. J. & Iglesias, C. A. 1992, ApJ, 401, 316
- Seaton et al. (1994) Seaton, M.J., Yan, Y. Mihalas, D. & Pradhan, A. K. 1994, MNRAS, 266, 805
- Schuster et al. (2006) Schuster, M. T., Marengo, M. & Patten, B. M. 2006, in Proc. SPIE 6270, Observatory Operations: Strategies, Processes, and Systems, ed. D. R. Silva & R. E. Doxsey (Bellingham, WA: SPIE), 65
- Stobie (1969) Stobie, R. S. 1969, MNRAS, 144, 511
- Storm et al. (2004) Storm, J., Carney, B. W., Gieren, W. P., Fouqué, P., Latham, D. W. & Fry, A. M. 2004, A&A, 415, 531
- Ueta et al. (2006) Ueta, T. et al. 2006, ApJ, 648, L39
- Ueta et al. (2008a) Ueta, T. et al. 2008a, PASJ, 60, 407
- Ueta (2008b) Ueta, T. 2008b, ApJ, 687, L33
- van den Ancker (1997) van den Ancker, M. E., Thé, P. S., Tjin A. Djie, H. R. E., Catala, C. de Winter, D., Blondel, P. F. C. & Waters, L. B. F. M. 1997, A&A, 324, L33
- Vink et al. (2001) Vink, J. S., de Koter, A. & Lamers, H. J. G. L. M. 2001, A&A, 369, 574
- Vitrichenko & Tsarevskii (1969) Vitrichenko, É. A. & Tsarevskii, G. S. 1969, Soviet Astronomy, 13, 159
- Wareing et al. (2006) Wareing, C. J. et al. 2006, MNRAS, 372, L63
- Welch & Duric (1988) Welch, D. L. & Duric, N. 1988, AJ, 95, 1794
- Werner et al. (2004a) Werner, M. W. et al. 2004a, ApJS, 154, 1
- Werner et al. (2004b) Werner, M. W., Uchida, K. I., Sellgren, K., Marengo, M., Gordon, K. D., Morriss, P. W., Houck, J. R. & Stansberry, J. A. 2004b, ApJS, 154, 309
- Willson (2000) Willson, L. A. 2000, ARA&A, 38, 573
- Wilson (1953) Wilson, R. E. 1953, General Catalog of Stellar Radial Velocities, Washington (Carnegie Institute of Washington)
- Worley (1966) Worley, C. E. 1966, PASP, 78, 485
- Yong et al. (2000) Yong, H., Demarque, P. & Sukyoung, Y. 2000, ApJ, 539, 928
| JD-2,400,000 | [3.6] | [4.5] | [5.8] | [8.0] | [24] | [70] |
|---|---|---|---|---|---|---|
| Cephei | ||||||
| 53935.018aafootnotemark: | 2.1200.001 | 2.300.59 | ||||
| 53957.101bbfootnotemark: | 2.1740.044 | 2.1830.037 | 2.1660.032 | 2.1500.039 | ||
| 54732.332bbfootnotemark: | 2.3720.014 | 2.3920.015 | 2.3580.019 | 2.3450.033 | ||
| HD 213307 | ||||||
| 53935.018ddfootnotemark: | 6.1390.087 | |||||
| 53957.101ccfootnotemark: | 6.3910.010 | 6.3990.010 | 6.4130.006 | 6.4060.005 | ||
| 54732.332bbfootnotemark: | 6.2370.137 | 6.3830.117 | 6.4020.304 | 6.3630.376 | ||
| Box | (DAT default)bbfootnotemark: | (DAT custom)ccfootnotemark: | |||||
|---|---|---|---|---|---|---|---|
| [MJy sr-1] | [MJy sr-1] | [MJy sr-1] | [MJy sr-1] | [MJy sr-1] | [MJy sr-1] | [MJy sr-1] | |
| 1 | |||||||
| 2 | |||||||
| 3 | |||||||
| 4 | |||||||
| NGC 7023 |