Insights into the mechanisms of electromediated gene delivery and application to the loading of giant vesicles with negatively charged macromolecules†
Thomas Portet, Cyril Favard,c Justin Teissié,a David S. Dean,b and Marie-Pierre Rolsa∗
Received Xth XXXXXXXXXX 20XX, Accepted Xth
XXXXXXXXX 20XX
First published on the web Xth XXXXXXXXXX 200X
DOI: 10.1039/b000000x
We present experimental results regarding the electrotransfer of plasmid DNA into phosphatidylcholine giant unilamellar vesicles (GUVs). Our observations indicate that a direct entry is the predominant mechanism of electrotransfer. A quantitative analysis of the DNA concentration increments inside the GUVs is also performed, and we find that our experimental data are very well described by a simple theoretical model in which DNA entry is mostly driven by electrophoresis. Our theoretical framework allows for the prediction of the amount of transfered DNA as a function of the electric field parameters, and thus paves the way towards a novel method for encapsulating with high efficiency not only DNA, but any negatively charged macromolecule into GUVs.
1 Introduction
00footnotetext: † Electronic Supplementary Information (ESI) available: one movie and associated legend. See DOI: 10.1039/b000000x/00footnotetext: a Institut de Pharmacologie et de Biologie Structurale, CNRS UMR 5089, Université Paul Sabatier, Toulouse, France. 00footnotetext: b Laboratoire de Physique Théorique, CNRS UMR 5152, Université Paul Sabatier, Toulouse, France. 00footnotetext: c Institut Fresnel, CNRS UMR 6133, Universités Aix-Marseille, Marseille, France. 00footnotetext: ∗ Tel: +33 5 61 17 58 11; E-mail: rols@ipbs.fr.Lipid membranes are essential constituents of living organisms, especially because of their impermeability to ions and hydrophilic molecules. This impermeability allows for the crucial compartmentalization necessary for life to develop 1. However, the barrier presented by the membrane turns out to be a hurdle in many biotechnological applications such as gene delivery or encapsulation of charged compounds into giant liposomes, i.e. when one needs to force the way of a charged molecule through a lipid bilayer.
As far as the loading of giant unilamellar vesicles (GUVs) is concerned, the most common procedure is to directly prepare the liposomes in a medium containing the desired compound. Fabrication of vesicles trapping salt-containing solutions can be achieved e.g. by hydration of a hybrid film of lipids and agarose 2. Also, natural swelling of GUVs encapsulating high molecular mass DNA was shown to be possible in presence of moderate concentrations of magnesium ions 3. Unfortunately, these techniques still suffer from the drawbacks inherent to the gentle hydration method: the resulting vesicles exhibit a wide size heterogeneity and their unilamellarity can not be guaranteed. The well known electroformation protocol 4 has a higher yield of unilamellar vesicles 5 . This protocol was recently refined in order to make electroformation possible with solutions containing various compounds, and in particular significant amounts of ions. Performing the electroformation in a flow chamber allows the encapsulation of high ionic strength solutions or large dextrans in the so formed GUVs 6. However, this technique requires the use of a sophisticated setup and does not seem easy to implement. Recently proposed modifications of the electroformation protocol enabled the formation of GUVs under physiological conditions 7, 8. Nevertheless, these methods have not been tested with large compounds of several tens of kDa, nor with highly charged molecules. Another solution was proposed by Stachowiak et al., who designed a GUV formation procedure using a pulsed microfluidic jet that deforms a planar bilayer into a vesicle 9. This technique does produce unilamellar vesicles of homogeneous radii, and any solution could in principle be trapped in the GUVs. Nevertheless, implementing the microfluidic setup is not a trivial task.
For the purpose of gene delivery to living cells, viral based methods are available; these are quite efficient but their safety has been questioned 10. Chemical methods relying on the formation of DNA complexes with positively charged molecules are also a topic of active research 11; such methods, although safer, are less efficient than the viral methods. Among physical methods, electropermeabilization is one of the most widely used. Indeed, the cell membrane can be safely and transiently permeabilized in a very elegant manner by applying electric pulses 12. Providing that the pulses are of sufficient duration 13 and amplitude 14, otherwise non permeant molecules of therapeutic interest can enter the cytoplasm of mammalian cells. This fact has led to two clinical applications: electrochemotherapy 15 and electrogenetherapy 16. The former involves small molecules such as cisplatin or bleomycin, and the latter larger molecules such as plasmid DNA.
As was described in 17, the mechanisms of molecular uptake under electropermeabilization, although poorly understood for the moment, depend strongly on whether the transfered objects have molecular or macro-molecular sizes. Whereas smaller ones seem to be able to freely cross electropermeabilized cell membranes, macromolecules exhibit an intermediate interaction with the membrane, the degree of this interaction being correlated with the ultimate transfection efficacy. A precise description of the electropermeabilized membrane would help to design safer and more efficient protocols; this is a major motivation for investigating the behaviour of simpler model systems. To our knowledge, DNA electrotransfer into liposomes was first studied by Chernomordik et al. 18. They found that high molecular mass DNA could enter DPPC/cholesterol (7:3, mol:mol) LUVs, via endocytosis-like vesicles which shielded the electrotransferred DNA from the internal medium. The internalization mechanism they proposed was based on their observation of the characteristic fluorescence of DNA/ethidium bromide (EB) complexes after sonication of EB-loaded vesicles which were pulsed in the presence of DNA. However, they could not directly observe the liposomes because of their small size. The conclusions of 18 were subsequently questionned by Lurquin and Athanasiou 19, who observed that giant (m) EB-loaded DPPC liposomes pulsed with DNA did actually show the bright fluorescence of DNA/EB complexes before (or even without) sonication. These results support a mechanism involving electropores and a direct entrance of DNA into the liposomes. No endocytosis-like vesicles occur during this mechanism, and this direct entrance allows the DNA to be immediately in contact with the medium inside the liposomes. Although electropores could not be unequivocally observed, these results are at variance with the findings of 18.
In this paper we describe high molecular mass DNA electrotransfer experiments performed on egg phosphatidylcholine (EggPC) GUVs. We present qualitative observations regarding the pathway of electromediated DNA entry into the liposomes, and quantitative results concerning the evolution of the inner DNA concentration as a function of the number, amplitude and duration of the applied electric pulses. By comparing our experimental data to a simple theoretical model, we are able to address the two following key questions: (i) what is the mechanism of DNA electrotransfer across pure lipid membranes? and (ii) is it possible to control/predict the amount of electrotransfered DNA? As well as being of interest for its comparison with the uptake of DNA by living cells, this study presents a method for loading vesicles with negatively charged macromolecules which may have a number of academic and practical applications.
2 Materials and methods
2.1 GUVs
Egg yolk L--phosphatidylcholine (EggPC) and L--phosphatidylethanolamine-N-(lissamine rhodamine B sulfonyl) (Rhodamine PE) were purchased from Avanti Polar Lipids (Alabaster, AL). Lipids were diluted in chloroform, at a mass concentration of 0.5 mg/mL, and stored at -20˚C. Rhodamine PE dye was added at a concentration of 1 mol %.
The vesicles were prepared at room temperature using the electroformation protocol 4, in an aqueous solution of 240 mM sucrose (internal solution) and subsequently diluted in an aqueous solution of 260 mM glucose and 1 mM sodium chloride (external solution). The pH of the external solution was adjusted to 7 using a 1 mM phosphate buffer (KH2PO4/K2HPO4, Merck, Darmstadt, Germany). The pH of the internal solution was measured to be 6.6. This slight initial pH asymmetry did not have any effect on our experiments: non-pulsed vesicles were stable for several tens of minutes, and no increase in DNA concentration inside a non-pulsed GUV could be detected. Furthermore, this initial pH difference will vanish after a few permeabilizing pulses because of the mixing of inner and outer solutions. The conductivities of the internal and external solutions were measured with conductivitymeter HI 8820 (Hanna Instruments, Lingolsheim, France), and had values of approximately S/m and S/m, respectively. The osmolarities, measured with Osmomat 030 osmometer (Gonotec, Berlin, Germany), were approximately 280 mOsm/kg and 300 mOsm/kg, respectively. These solutions are typically used when working with GUVs for several reasons. The similar osmolarities ensure that the GUVs have very little initial membrane tension, and the low conductivities prevent Joule heating in the pulsation chamber. The sugar asymmetry yields a density difference that allows sedimentation of the vesicles to the bottom of the chamber and facilitates their localization.
Electroformation was performed as follows. A small volume (15 L) of the lipid solution in chloroform was deposited on the conducting sides of glass slides coated with indium tin oxide. The glasses were then kept for two hours under vacuum in a desiccator to remove all traces of the organic solvent. Afterwards, the plates, spaced by a 1 mm thick silicon frame (Electron Microscopy Sciences, Hatfield, PA) were assembled into a chamber. The chamber was filled with the sucrose solution (internal medium). The slides were connected to an AC field function generator (AC Exact, model 128; Hillsboro, OR) and sinusoidal voltage of 25 mV peak to peak at 10 Hz was applied. The voltage was increased by 100 mV steps every 5 minutes, up to a value of 1225 mV and maintained under these conditions overnight. Finally, square-wave AC field of the same amplitude was applied at 5 Hz for one hour in order to detach the GUVs from the slides.
2.2 DNA
A 4.7 kbp plasmid (MW Da) pEGFP-C1 (Clontech, Mountain View, CA) carrying the green fluorescent protein gene controlled by the cytomegalovirus promoter was stained stoichiometrically with the DNA intercalating dye TOTO-1 (Molecular Probes, Eugene, OR). Staining was carried out at a DNA concentration of 1 g/L for 60 minutes on ice, at a basepair to dye ratio of 20. Plasmids were prepared from Escherichia coli transfected cells by using Maxiprep DNA purification system (Qiagen, Chatsworth, CA). The plasmid was then diluted in the pulsation buffer at a mass concentration of 1 g per 100 L, a value typically used in cell electrotransfection experiments. This plasmid was chosen because of its large size similar to those of the DNAs used in 18, 19, and also because it is classically used in gene electrotransfer studies where it was observed to form discrete interaction sites at the cell surface during electropermeabilization experiments 17.
2.3 Electropulsation
Pulsation chambers were similar to those used in 20. Two parallel copper strips (3M, Cergy-Pontoise, France) were stuck on a glass slide 0.5 cm apart. A glass coverslip was then stuck onto the glass slide with heated parafilm. The cavity between the slide and the coverslip was filled with 30 L of the buffered glucose solution and 2 L of the GUV solution. Electropulsation was performed directly on the microscope stage, by applying a series of 10, 20 or 40 pulses of 0.5, 1 or 5 ms duration at 0.33 Hz repetition frequency with a -Tech pulse generator (-Tech, L’Union, France). Field amplitudes were adjusted according to the initial vesicle radius in order to impose initial induced transmembrane voltages 21 ranging between 0.5 and 2 V, and as a consequence varied between 20 and 80 kV/m from one experiment to another.
2.4 Confocal microscopy
All experiments were performed under an inverted confocal microscope (Zeiss LSM510; Carl Zeiss, Jena, Germany) equipped with a 63 Zeiss objective for fluorescence imaging. For the red channel (membrane labeled with Rhodamine), excitation at 543 nm was provided by a HeNe laser, and emission filter was a 560 nm long pass. For the green channel (DNA labeled with TOTO-1), excitation at 488 nm was provided by a Ar laser, and emission filter was a 500-530 nm band pass. Images were acquired sequentially. Acquisition time was 2 s (1 s for each channel), thus one image on each channel could be acquired between every two consecutive pulses, separated by 3 s. The characteristic time for homogenizing the concentration of a molecule of diffusion coefficient within an object of size is on the order of . For plasmid DNA of diffusion coefficient m2s-122 and regions of inhomogeneous DNA concentration with sizes in the micrometer range, this yields characteristic times on the order of a few seconds. Thus in our experiments, DNA concentrations had enough time to homogenize between consecutive pulses. The use of confocal microscopy for these experiments is crucial, as it ensures that the measured fluorescence intensities are simply proportional to the local concentration of the fluorescent molecules 23.
2.5 Image and data processing
We were interested in two different quantities, both measurable via confocal fluorescence microscopy: the vesicle radius and the ratio of the DNA concentrations inside and outside the vesicle, . As we work in a dilute water solutions with similar physicochemical properties, the concentration of a fluorescently-labeled molecule is simply proportional to the mean fluorescence intensity due to this molecule, thus the quantity is equal to , the ratio of the mean fluorescence intensities inside and outside the vesicle, which is easily measurable in our experiments.
Our images were composed of two channels: a red one for Rhodamine PE (lipid membrane) and a green one for TOTO-1 (DNA). GUVs size measurements were performed on the red channel in a semi-automatic manner via custom-written programs, and relative DNA amount quantification was performed on the green channel automatically, by computing the mean fluorescence intensity inside the vesicle within a disk whose radius was chosen at a value of 80 % of the measured radius of the vesicle (we checked that no significant differences were seen for disk size values ranging from 60 to 90 % of the GUV size). This procedure was repeated for each image, so we were able to plot the vesicle size and the DNA quantity trapped in the vesicle as a function of time. We also computed the mean fluorescence intensity outside the vesicle. It was checked that this value did not change significantly after each pulse, and thus we used the value computed from the first image.
All images had non-zero mean fluorescence intensity values, even inside a non-pulsed vesicle where no DNA was present, or in pictures of pulsation chambers filled with pure water. This was due to the bias level of the confocal microscope sensors. In order to properly quantify DNA concentrations, we estimated this bias fluorescence level inside a non-permeabilized GUV containing no DNA, and substracted this quantity from the measured internal and external DNA fluorescence intensities to obtain the fluorescence intensity ratio equal to the concentration ratio .
Data for exhibited rather strong fluctuations and were smoothed using a moving average technique. Error bars in Fig. 2 were obtained by computing the standard deviation of the fluctuations around the constant value of after the application of pulses, for each experiment. Image and data processing tasks were performed with Matlab (The Mathworks, Natick, MA) and ImageJ (National Institute of Health, Bethesda, MD).
2.6 Numerical computation of the electric field near a permeabilized vesicle
As described in the theoretical section of this paper, we were interested in flow of DNA into a permeabilized vesicle. In the limit where the electrophoretic force on a DNA molecule dominates the osmotic force (due to concentration gradients), which we argue is the case in our experiments, the entry of DNA into the cell can be computed from the flux of the electric field across the cathode-facing permeabilized region of the GUV. The permeabilized region is defined as a spherical cap of angle facing the cathode, and we also assume that an identical region, similarly permeabilized to ionic currents, exists on the anode-facing side.
We computed numerically this flux as a function of using the finite element calculus software Comsol Multiphysics (Comsol, Burlington, MA).
The GUV was modeled as a spherical shell of radius and internal electrical conductivity , embedded in an aqueous solution of electrical conductivity . Laplace’s equation for the electric potential 24
| (1) |
was solved numerically in a cylindrical box of radius and heigth , taking advantage of the axial symmetry of this problem. An electric field of amplitude was applied in the z-direction parallel to the cylinder axis, by imposing the Dirichlet boundary conditions and on the top and the bottom faces of the cylinder, hence their names of anode and cathode, respectively. The membrane was modeled using thin layer boundary condition with a thickness nm and a membrane conductivity S/m 25. For representing the permeabilized regions of the vesicle facing the cathode and anode, we replaced the membrane conductivity by the external conductivity on a spherical cap of angle . Numerical integration of on that surface thus gave us the value of the flux as a function of .
2.7 Determination of the relative concentration increments
The amount of DNA transfered into a GUV per pulse can be considered in terms of a relative concentration increment , i.e. the difference between the value of the DNA concentration inside a liposome after a pulse and its value before the pulse, normalized by the outer DNA concentration. This quantity was measured experimentally by substracting the value of the mean fluorescence intensity ratio before the pulse to the value of after the pulse.
Within the framework of our model, can also be predicted using Eq. 10, where the electric pulse parameters and are chosen by the experimenter, the vesicle size is easily measured, and the DNA electrophoretic mobility is m2V-1s-1 26. The value of the flux factor is estimated to be on the order of 0.2 (see section 4 and Fig. 4).
3 Experimental results
We performed DNA electrotransfer experiments with 21 EggPC liposomes. Either 10, 20 or 40 pulses were applied at 0.33 Hz. The durations of the applied pulses were 0.5, 1 or 5 ms, and correspond to those commonly used for electromediated gene transfer 13. The longest pulse duration was observed to maximize the amount of transfered DNA, so most of the experiments were done at this value of 5 ms. Depending on the experiment, the pulse amplitude varied from 20 to 80 kV/m. The applied field magnitude was tuned in order to obtain initial induced transmembrane voltages (at the poles facing the cathode and the anode) ranging between 0.5 and 2 V. This was estimated from the formula for the voltage drop at a point on the membrane whose radial vector (of magnitude ) makes an angle with the direction of the applied field21:
| (2) |
This formula is valid when the conductivity of the membrane is much smaller than those of the internal and external solutions and when the thickness of the membrane is small compared to the vesicle size , which is true here. In some cases we were able to keep several vesicles in the optical field, thus we could gather data from several liposomes during the same experiment. Typically, we tuned the field magnitude according to the size of the largest GUV we could see. In 20 it was established for EggPC and DOPC liposomes that there was a critical value of the absolute value of the transmembrane voltage below which vesicles were not permeabilized and showed no change under the application of the electric field. Sufficiently large vesicles were seen to eject lipid material in the form of small vesicles and tubules, however this lipid ejection caused the vesicle radius to diminish and at constant field, when the radius fell below a threshold value the vesicle was no longer visibly affected by the field. In agreement with the results of 20 it was found that the smallest liposomes were not permeabilized and no DNA fluorescence could be detected inside them. For vesicles of intermediate sizes, the permeabilized area is smaller than that of the largest GUV on which the field of view was centered. Consequently these vesicles of intermediate sizes should be expected to exhibit relatively low amounts of DNA uptake. However, we kept such vesicles in our analysis, and coherent results for the increments of the internal DNA concentration were also obtained with them (section 4).
As can be seen in Fig. 1, it is possible to optically detect DNA entering the vesicle - a movie is also provided as ESI† on the journal website. The images show vesicles exhibiting lipid loss via formation of tubular structures. These structures were created on the anode facing side of the GUV and appeared to remain attached to the vesicle and stable over a few minutes, as previously reported in 20 for DOPC liposomes.
Darker zones denoting a local depletion of DNA from the outer region of the vesicle facing the cathode were observed in a small number of experiments, as shown in Figs. 1B and C. This phenomenon was quite rare, and could only be detected following the first few electric pulses. It may be due to hydrodynamic flows resulting from the leakage of the inner sucrose solution or from osmotic effects. However, this local depletion did not have any appreciable influence on the subsequent behavior of the vesicle around which it was seen.

We confirm the results of Lurquin and Athanasiou 19, namely the free entrance of DNA through pores formed by the electric field. Indeed if an uptake via endocytosis-like vesicles was the predominant mechanism, we would detect the presence of such objects in most of our experiments. Even though presumably quite small (some tens or hundreds of nm), some of these endocytosis-like vesicles should be created in the focal plane where the transmembrane voltage induced by the electric field is maximal, and should thus appear in our images. This was not the case. Therefore our pictures clearly speak in favour of an entrance via pores. We mention that we sometimes noticed endocytosis events, but they were very rare, and these phenomena always took place after application of the electric pulses. A detailed explanation of this rare uptake via vesicles is beyond the scope of the present work. However, we stress that an explanation based on the mechanism described in 27 where long DNA fragments of a few kbp absorb on a patch of the GUV membrane before it bends and pinches off toward the interior of the GUV would not be satisfactory because in that study the authors reported no DNA internalization within liposomes made just of zwitterionic lipids, as our EggPC GUVs.
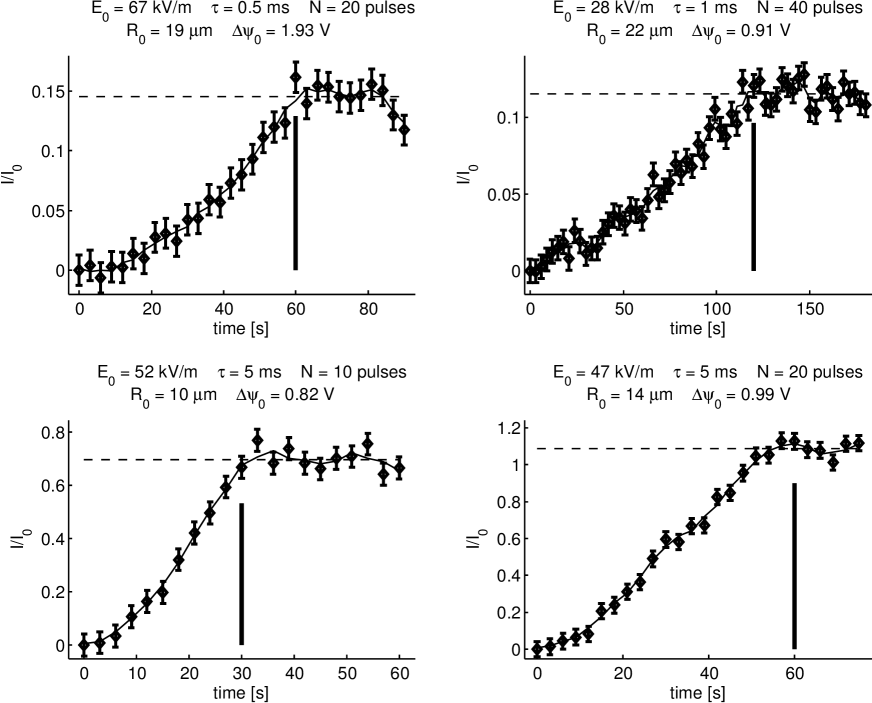
Typical examples of fluorescence experimental data, obtained as described in the Materials and Methods section, are shown in Fig. 2 (diamond marks). These data for are the ratio of the mean fluorescence inside and outside the GUV, and are equivalent to the relative DNA concentration , where is the DNA concentration inside the liposome and the DNA concentration outside the liposome. A ratio equal to 1 thus means that the DNA concentrations inside and outside the vesicle are the same. The field amplitude , the pulse duration , the number of pulses , the initial vesicle radius and the initial transmembrane voltage induced by the electric field are given in each panel. For each experiment, we observe an increase of the amount of DNA inside the vesicle during the train of pulses, along with a stabilization after the end of the pulse sequence. This clearly shows that DNA can enter GUVs and remain trapped in a stable manner, without significant leakage. We draw the reader’s attention to the different scales used on each panel: the final DNA concentrations inside the liposomes presented in the two top panels were much lower than those inside the liposomes subjected to electric pulses of the longest duration, which are presented in the bottom panels.
A number of control experiments were performed. First, we checked that fluorescence intensities inside the liposomes did not change if we did not apply pulses. This verification was performed on long timescales (several minutes). As a second control experiment, we applied a series of ten pulses and checked that the fluorescence level, after having increased, remained stable until the application of another train consisting of ten pulses of slightly higher amplitude, which induced a subsequent augmentation of the relative fluorescence intensity. This is important as it proves that the DNA uptake is induced directly by the electric field, ruling out the possibility that the vesicle remains permeable to DNA for some time after the field is cut and emphasizing the importance of the electrophoretic force on the DNA as well as the permeabilizing effect of the electric field on the membrane. We also carried out control experiments with TOTO-1 but with no DNA, in order to check that it was not unbounded dye we observed. The quantum yield of TOTO-1 is dramatically increased when bound to DNA. As a consequence, images acquired with same microscope settings and in the absence of DNA should be much less fluorescent than those with DNA. This was indeed the case (in fact the signal from TOTO-1 alone was too weak to be detected), thus proving that it was indeed fluorescently labeled DNA we were monitoring.
Interestingly, we found that sometimes the final DNA concentration inside the GUV could exceed the outer DNA concentration (). That can be seen for example on the bottom right panel of Fig. 2. This is quite surprising, and means that if the DNA enters the vesicle from the cathode facing pole driven by the electric field, it is not able to freely leak out the vesicle from the other pole. Indeed, if the permeabilization structures were the same on each hemisphere of the liposome, the maximal DNA concentration ratio possible should be . This is not the case in our experiments. This observation, along with the asymmetric formation of tubules, highlights the different membrane reorganization and symmetry breaking between the two hemispheres. The possibility of exceeding the external concentration of DNA within the vesicle also implies that the electrophoretic force due to the applied field overcomes the osmotic force due to the difference in the concentrations between the inside and outside of the vesicle, this will be discussed in the theory section which follows. We were also able to monitor the size decrease of the GUVs during the experiments. Applying the method previously described in 20, we obtained the fraction of permeabilized area lost per pulse and the critical transmembrane potential difference required to observe the size decrease of the GUVs. For the pulses of 5 ms duration (the same duration as used in 20), we find by averaging on all our experiments: and V. The value found for agrees well with the previously reported value of 0.31, which means that the GUVs still lose 30 % of their permeabilized area (area where is exceeded) per pulse 20. However, the value of 0.50 V found here is much smaller than the value 0.89 V found for vesicles pulsed in the absence of DNA. This suggests that the presence of DNA in the external medium, and/or inside the vesicle after a few permeabilizing pulses, tends to destabilize the vesicle membrane and makes it easier to electropermeabilize, but does not affect the fraction of permeabilized area expelled from the liposome.
4 Theoretical analysis of the relative DNA concentration increments
The theoretical interpretation of our experimental results is rather difficult as we do not have explicit access to the way in which the vesicles are permeabilized.
In this section we will present a simple model describing the relative DNA concentration increment inside a vesicle of radius R, caused by an electric pulse of amplitude and duration . The DNA concentration increment inside the vesicle, per pulse, is denoted by , and the constant outside concentration by . We will assume that the major contribution to is due to the pulling of the DNA molecules by the electric field, and we will see that our 360 experimental data points agree with this hypothesis.
The DNA concentration is governed by an electrodiffusion equation
| (3) |
where is the thermodynamic current . The first term is a diffusion term that depends on the molecule diffusion coefficient . The second term is an electrophoretic term depending on the local field and the electrophoretic mobility of the molecule (the steady state velocity of the molecule in a field is given by ). The DNA concentration increment inside an object of volume during a time is given by
| (4) |
which can be written using Gauss’ theorem:
| (5) |
We easily estimate the relative importance of electrophoretic forces and DNA diffusion by comparing the diffusive or osmotic part of the current per concentration and the electrophoretic part . We use the following values of DNA in solution: m2V-1s-1 26 and m2s-1 22. We use the estimations (where is the average DNA concentration in the vesicle and the vesicle radius) and , this gives
| (6) |
for the lower range of permeabilizing applied voltages ( V, cf subsection 2.6). We thus see that the effects of diffusion are negligible except for perhaps the first pulse when .
As far as the ionic currents are concerned we assume that the vesicle is permeablized in a symmetric way at both the cathode and anode facing sides. The permeabilized region subtends an angle in the direction of the applied field. As mentioned in the Material and methods section we model the permeabilized region by replacing the membrane conductivity by that of the external solution; this is clearly a simplification. As far as the transport of DNA is concerned the fact that macropores are only ever seen at the cathode facing pole suggests that although the conductive properties of the permeabilized regions at the anode and cathode facing poles are the same (i.e. the transport properties of these regions to small ions is the same), DNA can pass more freely at the cathode facing side than the anode facing side. Thus in our analysis we posit that DNA can be freely electrophoretically conducted through the cathode facing permeabilized region. In our model this is equivalent to saying that electrophoretic mobility of DNA in the membrane region is zero except in the permeabilized region facing the cathode, where it takes its free solution value. The concentration increment is simply related to the integral over time of the flux of the thermodynamic current across the surface . Let us now consider a spherical object with fixed volume and let us compute the concentration increment from the onset of one pulse to the onset of the subsequent pulse. Using a constant volume is a reasonable approximation because in our experiments the average volume decrease caused by a single pulse is still small compared to the initial volume of the vesicle.
We will base the analysis of our experimental results on the following assumptions (a) the dominant transport process is electrophoretic and we neglect DNA diffusion (b) we assume that over the period of the pulse a conducting hole is created at both poles of membrane each having radius . Concretely this means that the average radius of the conducting hole in the membrane averaged over the time of the pulse application is . Beyond the time averaging, this is a crude simplification, as the surface permeable to ions may be larger than the one permeable to DNA, this is because we cannot be sure that there is really a single macropore in the lipid bilayer, instead of several smaller pores, or other types of defects. Nevertheless, we expect the electroconvected flux of DNA into the vesicle to be of the same order. Furthermore we will assume that DNA is not able to exit the vesicle at the conducting region facing the cathode. Adopting the hypotheses above, upon a pulse of duration the increase in concentration is given by
| (7) |
i.e. concentration increment is just proportional to the flux of the local electric field across the permeabilized surface , the hole of radius . In terms of the relative concentration increments , which are exactly the differences between every two consecutive points of our experimental data for , this can be written
| (8) |
In order to be able to evaluate , we should be able to evaluate . Recall we assume that the permeabilized area is a spherical cap of angle facing the cathode, that both DNA and ions can cross. Despite this simplification of the transport problem no analytical solution to this problem exists. However, on purely dimensional grounds (assuming the limit of zero membrane thickness), we can write
| (9) |
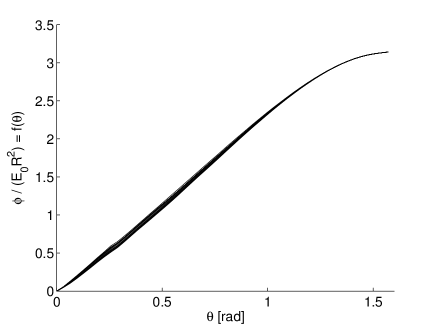
where is the pore radius such that , and an unknown function of the ratio , or in other words a function of the permeabilized angle . Note that in the limit where the pore length is much greater than the pore radius, which is the case for nanopores, Eq. 9 will not be valid 28 and will depend explicitly on the pore length. To check the validity of Eq. 9, we computed numerically for different field intensities , different vesicles radii R, and different angles , as described in the Materials and methods section. These results are presented in Fig. 3, where one can see that all the flux values superpose. These plots are in fact plots of the function , and show that Eq. 9 is valid. For a small angle , we can make the linear approximation that , where is the slope of the straight line giving . We finally obtain for the relative concentration increments
| (10) |
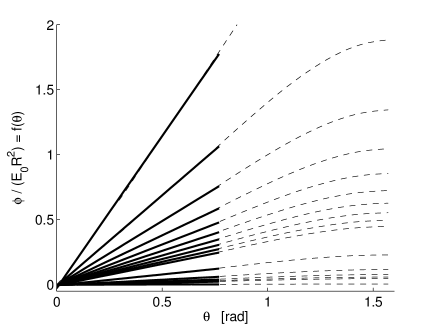
We checked the approximation by fitting straight lines to the numerically computed . As shows Fig. 4, the fits are in very good agreement with numerical data. The different plots correspond to different internal to external conductivitiy ratios , as indicated in the legend. One can see that the slopes depend on these conductivity ratios, and increase for increasing ratios. This makes sense, as one would not expect any flux of the electric field for a perfectly non conductive object. This is also interesting because it gives another reason why the relative DNA concentration increments seems to increase during one experiment. This is because the solution inside the GUV being initially less conductive than the external medium, the electropermeabilization leads to the mixing of the internal and external solutions, and thus to an increase of towards . This increase of the conductivity ratio causes in turn an increase of the flux , and hence an increase of . One can also see on Fig. 4 that for conductivity ratio values between 1 and 10 corresponding to our experiments, the flux factor should be, for moderate angles, on the order of 0.1–0.5. Its value should of course be varying from one data point to another, mostly because of the difference between the permeabilized areas, but our analysis nevertheless states that if our assumptions are valid, the values of obtained with our experimental data should be distributed around 0.1–0.5. We have gathered in Fig. 5 all our experimental values of , using the value of given above. This histogram contains more than 300 individual data points, corresponding to various vesicle sizes , field amplitudes , and pulse durations . The narrow shape of the distribution around the expected values thus supports our hypothesis that DNA entry in the GUVs mostly happens via electrophoretic effects.
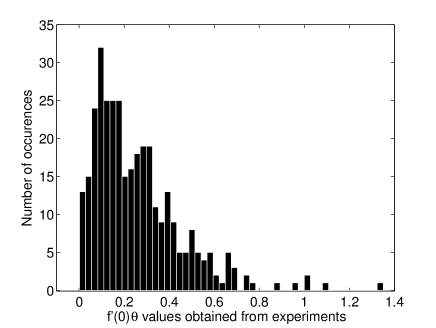
The value of the flux factor averaged on all experiments is . If we take the value of 2.34 rad-1 for , corresponding to a conductivity ratio equal to 1 (this has to be true after a few permeabilizing pulses, once the internal and external solutions have mixed), we obtain for the average value of the permeabilization angle : . This angle value seems reasonable, but should not be interpreted as the most frequent permeabilization angle in our experiments. Indeed, this quantity is extracted from an averaging process on many experiments performed with various electrical parameters and on GUVs of different sizes. Given the fact that the vesicles shrank during an experiment, one would expect that decreases too. Let us recall that in similar systems, single macropores could not be detected during the pulse application 29. The result of this analysis is that the experimentally observed DNA transfer into vesicles can be interpreted as, on average, that which would be given by electrophoresis through an aqueous pore subtending an average angle of about in the direction of the applied field. We see that this conclusion has the merit of being consistent with the assumptions of our model, the effective region across which DNA is transfered is macroscopic but does not represent a large fraction of the vesicle surface.
5 Discussion
Before answering the questions (i) and (ii) introduced in section 1, about the mechanism of DNA electrotransfer into GUVs and the ability to control the amounts transfered, respectively, we shall briefly discuss our results regarding the decrease in size of the GUVs during electropulsation. As observed in 20 the application of electropulses leads to a reduction in the size of the vesicles. This reduction in size eventually stops when the vesicles have a size such that the permeabilization threshold is no longer exceeded. Our estimation of the critical membrane permeabilization potential necessary to induce permeabilization turns out to be smaller than that estimated for the same vesicle system (EggPC GUVs) in the absence of DNA. This suggests the possibility that negatively charged macromolecules may help to induce the permeabilization process via some interaction with the membrane, which was also concluded from chemical relaxation spectrometry experiments on small unilamellar vesicles subjected to an electric pulse in presence of DNA 30. It is possible that DNA may flow into the defects that eventually lead to macropores and prevent their closing. The presence of DNA in blocked defects could be related to the endocytosis based electrotransfer mechanism seen in 18.
(i) Our qualitative observations and the quantitative agreement of our theory with our experimental results support a direct uptake mechanism, as described in 19, which is mainly driven by electrophoretic effects. However there are some differences between our system and protocol and those used by Chernomordik et al. 18 which should be highlighted. For example, in 18 just one pulse was applied whereas we used a train of at least ten pulses. As can be seen in the top left panel of Fig. 2, the amount of DNA transferred after a single pulse could sometimes be very small. We could infer that in fact no DNA penetrated the vesicle during the pulse and that the endocytosis-like mechanism, as we observed in some rare cases, occured after the electrical treatment. The intensities of the field applied in 18 induced transmembrane voltages of the order of at most 450 mV whereas ours, and those used by Lurquin and Athanasiou, caused initial potential drops of more than 1 V. This could be an explanation for why so little DNA has been taken up by the liposomes in the experiments of 18. Another origin for the difference of the reported behaviours could lie in the nature of the systems themselves. The liposomes used in 18 were much smaller (LUVs of nm diameter) and contained 70 % DPPC and 30 % cholesterol, whereas the DPPC GUVs of 19, and ours made of EggPC, did not contain cholesterol. DNA interaction with the membrane of CHO cells during electrotransfection experiments appears to be more complex than that inferred here. In 17 the initial interaction between DNA and the CHO cell membrane leads to the formation of spots on the cell surface, again facing the cathode, where DNA aggregates are formed. The fact that this spot formation is not seen in GUVs has many possible explanations. For DNA and cells it is possible that there is a physical or chemical interaction which tends to trap DNA near the surface or it could be that the reduced mobility of DNA in the cell interior causes a traffic jam like phenomenon where the DNA is locally blocked 31. It is worth mentioning that the asymmetric transport phenomena discussed below also occurs in real cells 32. The asymmetric transport pattern found by the authors led them to suggest that pores were created on both sides of the membrane, but with a larger size (and also lower number) on the cathode-facing hemisphere.
(ii) The agreement of our experimental results with our model for DNA uptake corroborates our quantitative observations. It means that we can indeed control and predict the quantity of electrotransfered DNA per pulse . Even if we can not accurately monitor the size, shape, number and nature of the membrane defects allowing DNA entrance, we have seen that assuming an entry through a macropore of angle (or equivalently a flux factor in Eq. 10 on the order of 0.2) provides a satisfactory prediction of the transfered amounts. Although no macropore could be detected during the pulse application 29, this simplification turns out to be a useful and convenient assumption for estimating . Furthermore, as was observed in living cells in vitro 33, 34 and in skeletal muscle in vivo 35, DNA uptake by the GUVs indeed appears to be dominated by the integrated effect of the electrophoretic force resulting from the electric field application, i.e. the term in Eq. 10. The effect of the electric pulses is thus twofold: they both permeabilize the lipid bilayer, and push the charged compounds inside the liposome, making the electrotransfer of highly negatively charged macromolecules very efficient. This importance of the electrophoretic effect is reminiscent of the observation that electric fields generated by salt gradients across artificial nanopores enhance the capture rate of DNA molecules into the pores 28. Another significant experimental finding is the following. As can be seen on the bottom right panel of Fig. 2, we could sometimes reach DNA concentrations inside the vesicle greater than the concentration outside (). The inverse dependence of on the vesicle radius alone cannot be responsible for a concentration build up within vesicles exceeding that of the bulk. Indeed, even if decreases during an experiment (and thus increases, see Eq. 10), one should not in principle be able to exceed the outer concentration . The build up of an excess concentration strongly suggests that DNA can not cross the membrane on the anode facing pole, and means that the permeant structures reported to be created on this side 32, 36 have sizes on the order of a few nm at most. It also means that the pore created on the other side closed relatively quickly at the end of the pulse, otherwise the inner concentration would always have time to equilibrate with the outer one (as the osmotic gradient will dominate in the absence of an applied field). Indeed, it had been reported that electropores induced by DC pulses in GUVs resealed within some tens 37, at most a few hundreds of ms 29 for similar electric pulses, fast enough to prevent significant DNA concentration changes due to diffusion. The presence on the anode facing pole of the membrane tubules reported previously in 20 and which are also observed with EggPC vesicles (see Fig. 1) could presumably also prevent the DNA from leaving the vesicle from that pole. An interesting corollary of these results would be that electromediated loading of vesicles with positively charged macromolecules should be much less efficient than that observed here. This is because positively charged macromolecules would be forced away from the side of the vesicles containing the macropores.
Besides clarifying the mechanism of DNA uptake by vesicles, our work demonstrates the efficiency of the loading method. These results should be relevant to the encapsulation of plasmid DNA into giant liposomes, for the purpose of gene transfection for example. A simple rule of thumb for choosing the electric field parameters for a loading protocol would be: use a pulse duration of ms, tune the field amplitude according to the vesicle initial size in order to obtain induced transmembrane voltages V, and then apply a sequence of pulses at 0.33 Hz repetition frequency until the required DNA concentration inside the vesicle is attained. This loading technique is also applicable to other negatively charged macromolecules, and an equivalent efficiency () could be attained provided the molecules are big enough to be unable to cross the membrane at the anode-facing side. The higher the electrophoretic mobility, the higher the electrotransfered amount, as can be understood from Eq. 10; thus this technique would be particularly efficient with highly charged molecules. The negative charge is crucial in order to reach the vesicle from the cathode-facing side; indeed, positively charged molecules would reach the GUV from the anode-facing side, which hosts the nucleation of the tubular structures shown in Fig. 1, and whose crossing is much more difficult, as shown by the fact that we oberved surconcentrations of DNA ().
6 Conclusion
In this paper we have described a quantitative method for loading GUVs with negatively charged macromolecules, and we have shown that the predominant pathway of electromediated DNA uptake into liposomes is undoubtedly the electrophoretic entrance in a free form via defects created on the cathode-facing pole of the vesicles. This spectacular symmetry breaking, first observed on GUVs in 36, is what makes electromediated DNA uptake by vesicles so efficient. Indeed, in some of our experiments, we can reach DNA concentrations inside the vesicles higher than external concentrations. This would not have been possible if large pores also opened on the anode-facing hemisphere (as DNA would flow out through these pores), and clearly shows that even if the vesicle is permeabilized to small compounds at the anode side, sufficiently large moelcules cannot cross the membrane in this region. From this we can infer that the permeant structures created opposite the positive electrode have sizes of the order of a few nanometers at most. The underlying origin of these striking differences of the membrane reorganization at the moleculer level are not yet understood, and explaining this asymmetry represents an exciting direction for further research.
Acknowledgements
This work was partially supported by the Institut Universitaire de France. We wish to thank Luc Wasungu for his help with DNA purification and also Émilie Phez for her participation in the inception of this work. TP, CF, JT and MPR are members of the CNRS consortium CellTiss; CF is also a member of the CNRS consortium Microscopie Fonctionnelle du Vivant. Imaging experiments were run at the TRI platform.
References
- Mouritsen 2005 O. G. Mouritsen, Life - As a matter of fat, Springer, The Frontiers Collection, 2005.
- Horger et al. 2009 K. Horger, D. Estes, R. Capone and M. Mayer, J. Am. Chem. Soc., 2009, 131, 1810–1819.
- Sato et al. 2003 Y. Sato, S. M. Nomura and K. Yoshikawa, Chem. Phys. Lett., 2003, 380, 279–285.
- Angelova and Dimitrov 1986 M. I. Angelova and D. S. Dimitrov, Faraday Discuss. Chem. Soc., 1986, 81, 303–311.
- Rodriguez et al. 2005 N. Rodriguez, F. Pincet and S. Cribier, Colloids Surf. B, 2005, 42, 125–130.
- Estes and Mayer 2005 D. Estes and M. Mayer, Biochim. Biophys. Acta, 2005, 1712, 152–160.
- Pott et al. 2008 T. Pott, H. Bouvrais and P. Méléard, Chem. Phys. Lip., 2008, 154, 115–119.
- Montes et al. 2007 L.-R. Montes, A. Alonso, F. Goñi and L. Bagatolli, Biophys. J., 2007, 93, 3548–3554.
- Stachowiak et al. 2008 J. Stachowiak, D. Richmond, T. Li, A. Liu, S. Parekh and D. Fletcher, Proc. Natl. Acad. Sci. USA, 2008, 105, 4697–4702.
- Marshall 1999 E. Marshall, Science, 1999, 286, 2244–2245.
- Parker et al. 2003 A. Parker, C. Newman, S. Briggs, L. Seymour and P. Sheridan, Expert Rev. Mol. Med., 2003, 5, 1–15.
- Neumann and Rosenheck 1972 E. Neumann and K. Rosenheck, J. Membr. Biol., 1972, 10, 279–90.
- Rols and Teissié 1998 M.-P. Rols and J. Teissié, Biophys. J., 1998, 75, 1415–1423.
- Teissié and Rols 1993 J. Teissié and M.-P. Rols, Biophys. J., 1993, 65, 409–413.
- Belehradek et al. 1993 M. Belehradek, C. Domenge, B. Luboinski, S. Orlowski, J. B. Jr. and L. Mir, Cancer, 1993, 72, 3694–3700.
- Escoffre et al. 2009 J.-M. Escoffre, T. Portet, L. Wasungu, J. Teissié, D. S. Dean and M.-P. Rols, Mol. Biotechnol., 2009, 41, 286–295.
- Golzio et al. 2002 M. Golzio, J. Teissié and M.-P. Rols, Proc. Natl. Acad. Sci. USA, 2002, 99, 1292–7.
- Chernomordik et al. 1990 L. V. Chernomordik, A. V. Sokolov and V. G. Budker, Biochim. Biophys. Acta, 1990, 1024, 179–183.
- Lurquin and Athanasiou 2000 P. F. Lurquin and K. Athanasiou, Biochem. Biophys. Res. Commun., 2000, 267, 838–841.
- Portet et al. 2009 T. Portet, F. Camps, J.-M. Escoffre, C. Favard, M.-P. Rols and D. S. Dean, Biophys. J., 2009, 96, 4109–4121.
- Neumann et al. 1989 E. Neumann, A. E. Sowers and C. A. Jordan, in Electroporation and electrofusion in cell biology, Plenum, New York, 1st edn., 1989, pp. 3–21.
- Lukacs et al. 2000 G. L. Lukacs, P. Haggie, O. Seksek, L. D., F. N. and V. A. S., J. Biol. Chem., 2000, 275, 1625–1629.
- Li et al. 2010 S. Li, P. Hu and N. Malmstadt, Anal. Chem., 2010, 82, 7766–7771.
- Jackson 1975 J. D. Jackson, Classical electrodynamics, John Wiley & Sons, 2nd edn., 1975.
- Pucihar et al. 2006 G. Pucihar, T. Kotnik, B. Valič and D. Miklavčič, Ann. Biomed. Eng., 2006, 34, 642–652.
- Stellwagen et al. 1997 N. C. Stellwagen, C. Gelfi and P. G. Righetti, Biopolymers, 1997, 42, 687–703.
- Angelova and Tsoneva 1999 M. I. Angelova and I. Tsoneva, Chem. Phys. Lip., 1999, 101, 123–137.
- Wanunu et al. 2010 M. Wanunu, W. Morrison, Y. Rabin, A. Grosberg and A. Meller, Nat. Nanotechnol., 2010, 5, 160–165.
- Portet and Dimova 2010 T. Portet and R. Dimova, Biophys. J., 2010, 99, 3264–3273.
- Frantescu et al. 2005 A. Frantescu, S. Kakorin, K. Toensing and E. Neumann, Phys. Chem. Chem. Phys., 2005, 7, 4126–4131.
- Escoffre et al. 2010 J.-M. Escoffre, T. Portet, C. Favard, J. Teissié, D. Dean and M.-P. Rols, Biochim. Biophys. Acta, 2010, in press, doi: 10.1016/j.bbamem.2010.10.009.
- Tekle et al. 1994 E. Tekle, R. D. Astumian and P. B. Chock, Proc. Natl. Acad. Sci. USA, 1994, 91, 11512–11516.
- Klenchin et al. 1991 V. Klenchin, S. Sukharev, S. Serov, L. Chernomordik and Y. Chizmadzhev, Biophys. J., 1991, 60, 804–811.
- Sukharev et al. 1992 S. Sukharev, V. Klenchin, S. Serov, L. Chernomordik and Y. Chizmadzhev, Biophys. J., 1992, 63, 1320–1327.
- Bureau et al. 2000 M. Bureau, J. Gehl, V. Deleuze, L. Mir and D. Scherman, Biochim. Biophys. Acta, 2000, 1474, 353–359.
- Tekle et al. 2001 E. Tekle, R. D. Astumian, W. A. Friauf and P. B. Chock, Biophys. J., 2001, 81, 960–968.
- Riske and Dimova 2005 K. A. Riske and R. Dimova, Biophys. J., 2005, 88, 1143–1155.