The Ultra-High Energy Cosmic Ray Spectrum Measured by the Telescope Array’s Middle Drum Detector
Abstract
The Telescope Array’s Middle Drum fluorescence detector was constructed using refurbished telescopes from the High Resolution Fly’s Eye (HiRes) experiment. As such, there is a direct comparison between these two experiments’ fluorescence energy spectra. An energy spectrum has been calculated based on one year of collected data by the Middle Drum site of Telescope Array and agrees well with the HiRes monocular spectra. The quality of the Middle Drum results has also been determined to show good agreement.
I Telescope Array Middle Drum
Telescope Array is a collaboration composed of institutions from the U.S., Japan, Korea, Russia, and Belgium. The experiment consists of three fluorescence telescope detectors overlooking 507 surface detectors arrayed over . The northernmost fluorescence detector, known as Middle Drum, consists of 14 telescopes refurbished from the High Resolution Fly’s Eye (HiRes) experiment. These were arranged to view in azimuthal coverage and between and in elevation. Each telescope unit uses sample-and-hold electronics with a gate with floating tube-thresholds, allowing each photomultiplier tube to have an individual firing rate of Hz. Each telescope camera consists of 256 photomultiplier tubes covered with an ultra-violet transmissive filter.
I.1 Goals of Middle Drum
The current goals of the Middle Drum spectral analysis are three-fold. Since the Middle Drum detector has been operating for over a year, the first goal of this analysis is to determine the flux of particles observed during that first year using the same analysis techniques used to produce the HiRes-1 monocular spectrum. Secondly, since the telescope units are composed of the same equipment used at HiRes, a direct comparison between Middle Drum and HiRes can be performed. This results in a direct link in the energy scale between these two experiments. Finally, by comparing events observed by Middle Drum and any of the other detectors (including other fluorescence detectors in either stereo or tandem mode as well as the ground array), the energy scale across the entire Telescope Array experiment can then be pinned down. This analysis will then produce a bridge between the HiRes and the Telescope Array experiments.
II Exposure
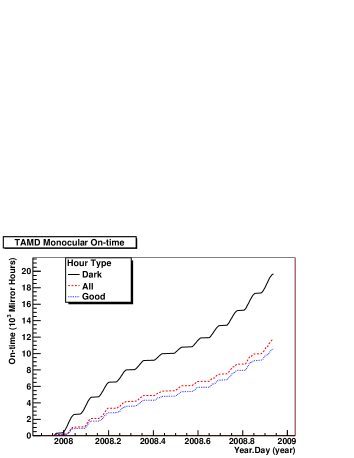
The Telescope Array Middle Drum detector was refurbished and deployed between November, 2006 and October, 2007. The first data was collected on December 16, 2007 and the first year of collected data ended on December 8, 2008. During this period, data was collected only on nights that had at least three hours of full-dark: no sunlight and no moonlight. Of this “dark time”, many hours were lost due to poor weather conditions in which the telescope bay doors were unable to be opened. The final collected time (see figure 1) consisted of hours ( of available time) of which hours ( of collected time) were considered good, i.e. minimal cloud cover in the view of the detector. This correlates to a duty cycle. This turned out to be the running time of HiRes-1.
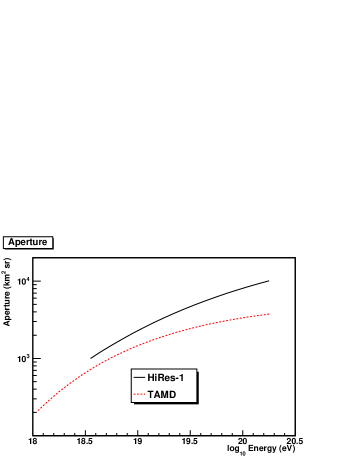
The aperture of the Middle Drum detector is determined through Monte Carlo simulations. The aperture of the Middle Drum detector has been calculated to be roughly half that of the HiRes-1 detector (see figure 2). The combination of running time and aperture is defined as the exposure of the detector. The exposure of Middle Drum is then the exposure of HiRes-1.
III The Middle Drum Year Spectrum
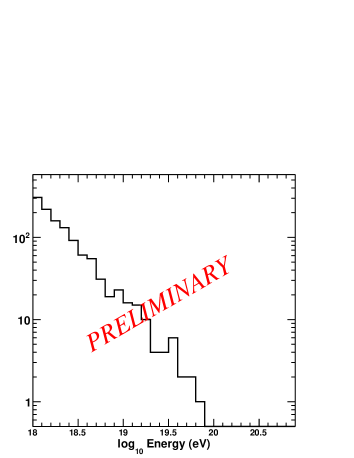
After one year of collecting data, 1156 events were observed with energy above eV (see figure 3). There have been no observed events above eV. Counting the number of events in each tenth-decadal energy bin, it has been observed that there is the number of events observed by HiRes-1 for each year the Middle Drum detector runs DCR_thesis . As such, this is consistent with the exposure for the first year of running.
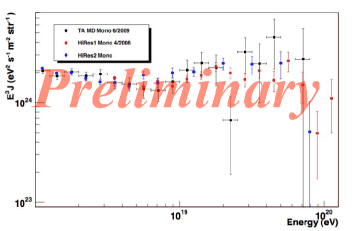
Combining the number of events and the exposure per energy bin, the flux spectrum can be calculated. This results in a spectrum that is consistent with that of the HiRes monocular spectrum (see figure 4) GZK_paper .
IV Monte Carlo
The Monte Carlo was thrown with an isotropic distribution and sent through the same processing cuts and reconstruction that was performed on the data. The Monte Carlo was thrown with a Fly’s Eye spectrum: a spectral index of 3.2 below eV and 2.8 above that same energy, between eV and eV. The Monte Carlo spectral set was thrown without the GZK cutoff PhysRevLett.16.748 SovPhysJETPL.4.78 . The HiRes-1 and Telescope Array Middle Drum Monte Carlo uses the Gaisser-Hillas parameterization to determine the number of charged particles at each slant depth into the atmosphere. The number of photo-electrons observed at each slant depth correlates to a certain energy deposited into the atmosphere, and the integration of the energy deposited is determined to be the energy of the initial cosmic ray.
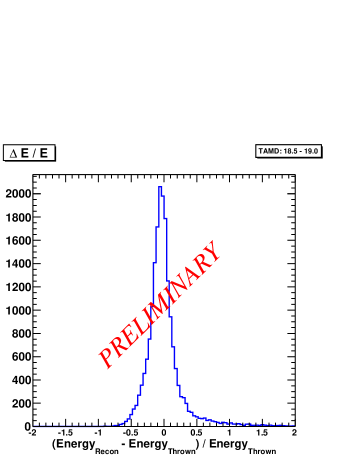
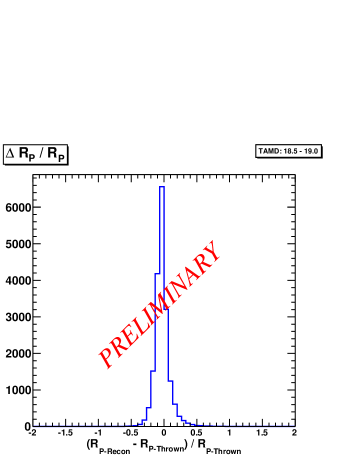
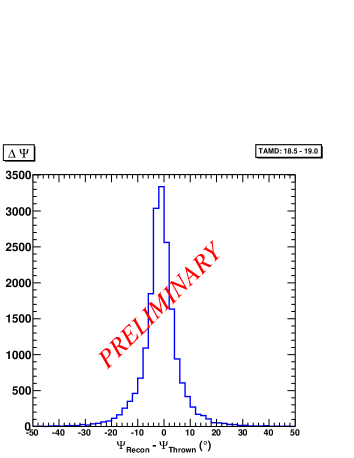
IV.1 Resolution
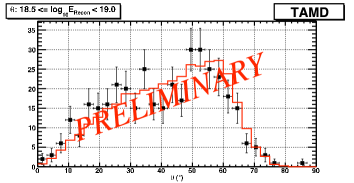
Resolution plots show how well the reconstruction programs perform by determining the difference between the thrown and the reconstructed energy and geometry in Monte Carlo simulations. The three primary parameters that show the quality of the reconstruction are the energy, the impact parameter, , and the in-plane angle, . These are determined for four energy ranges to show trends in the reconstruction: eV, eV, eV, and eV. The lowest energy range is below the spectrum limit and is not considered in the analysis and the mid-range ( eV) shows a good representation of what is happening (see figures 5, 6, and 7).
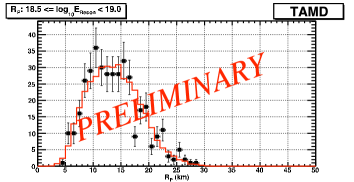
IV.2 Data-MC Comparison
The aperture is solely based on the Monte Carlo simulation of real events and how they are observed by our detector. In order to show how well we can rely upon our aperture, data-Monte Carlo comparisons are made. The same four energy ranges used in the resolution are again compared here. However, the two most reasonable reconstruction parameters to compare here are the impact parameter, , and the zenith angle, . Again, the lowest energy range is not considered since it is below the range of the spectrum and the mid-range shows a reasonable trend (see figures 8 and 9). Due to the small statistics in the actual data the error bars on the data points are quite large. Nevertheless, it can be seen that the Monte Carlo histogram lines overlay the data points very well.
V Conclusions
The first year of the Telescope Array Middle Drum detector has been analyzed using a monocular mode. The energy resolution of the Monte Carlo simulations shows good agreement between what was thrown and what was reconstructed. The data-Monte Carlo comparisons show good agreement between simulated and real data. The calculated Middle Drum energy spectrum is shown to be within statistical error of the spectra produced by the HiRes monocular analysis.
Acknowledgements.
The Telescope Array experiment is supported by the Ministry of Education, Culture, Sports, Science and Technology-Japan through Kakenhi grants on priority area (431) “Highest Energy Cosmic Rays”, basic research awards 18204020(A), 18403004(B) and 20340057(B); by the U.S. National Science Foundation awards PHY-0307098, PHY-0601915, PHY-0703893, PHY-0758342, and PHY-0848320 (Utah) and PHY-0649681 (Rutgers); by the Korea Research Foundation (KRF-2007-341-C00020); by the Korean Science and Engineering Foundation (KOSEF, R01-2007-000-21088-0); by the National Research Foundation of Korea (NRF, 2010-0028071); by the Russian Academy of Sciences, RFBR grants 07-02-00820a and 09-07-00388a (INR), the FNRS contract 1.2.335.08, IISN and Belgian Science Policy under IUAP VI/11 (ULB). The foundations of Dr. Ezekiel R. and Edna Wattis Dumke, Willard L. Eccles and the George S. and Dolores Dore Eccles all helped with generous donations. The State of Utah supported the project through its Economic Development Board, and the University of Utah through the Office of the Vice President for Research. The experimental site became available through the cooperation of the Utah School and Institutional Trust Lands Administration (SITLA), U.S. Bureau of Land Management and the U.S. Air Force. We also wish to thank the people and the officials of Millard County, Utah, for their steadfast and warm supports. We gratefully acknowledge the contributions from the technical staffs of our home institutions and the University of Utah Center for High Performance Computing (CHPC).References
- (1) D. C. Rodriguez, “The Telescope Array Middle Drum Monocular Energy Spectrum and a Search For Simultaneous Showers Using HiRes-1 Monocular Data”, University of Utah, 2010.
- (2) R. U. Abbasi et al., “First observation of the Greisen-Zatsepin-Kuzmin suppression”, Physical Review Letters (101101), 2008.
- (3) K. Greisen, “End to the Cosmic-Ray Spectrum?”, Phys. Rev. Lett. (16), p748-750, 1966.
- (4) G. T. Zatsepin and V. A. Kuz’min, “Upper limit of the cosmic-ray spectrum”, Sov. Phys. JETP Lett. 4, p78, 1966.