Carbon Isotope and Isotopomer Fractionation
in Cold Dense Cloud Cores
Abstract
We construct the gas-grain chemical network model which includes carbon isotopes (12C and 13C) with an emphasis on isotopomer-exchange reactions. Temporal variations of molecular abundances, the carbon isotope ratios (12CX/13CX) and the isotopomer ratios (12C13CX/13C12CX) of CCH and CCS in cold dense cloud cores are investigated by numerical calculations. We confirm that the isotope ratios of molecules, both in the gas phase and grain surfaces, are significantly different depending on whether the molecule is formed from the carbon atom (ion) or the CO molecule. Molecules formed from carbon atoms have the CX/13CX ratios greater than the elemental abundance ratio of [12C/13C]. On the other hand, molecules formed from CO molecules have the CX/13CX ratios smaller than the [12C/13C] ratio. We reproduce the observed C13CH/13CCH ratio in TMC-1, if the isotopomer exchange reaction, 13CCH + H C13CH + H + 8.1 K, proceeds with the forward rate coefficient 10-11 cm3 s-1. However, the C13CS/13CCS ratio is lower than that observed in TMC-1. We then assume the isotopomer exchange reaction catalyzed by the H atom, 13CCS + H C13CS + H + 17.4 K. In the model with this reaction, we reproduce the observed C13CS/13CCS, CCS/C13CS and CCS/13CCS ratio simultaneously.
1 INTRODUCTION
The elemental abundance ratio of [12C/13C] in the local ISM is 60 (e.g. Langer & Penzias (1993); Lucas & Liszt (1998)). The molecular abundance ratio of 12CX/13CX is often assumed to be the same as this elemental ratio. It has been reported, however, that the carbon-chain molecules are diluted in 13C and the ratio varies among molecules; the ratio of HC3N/H13CCCN is 79 (Takano et al. 1998), CCS/13CCS is 230 130 (Sakai et al. 2007) and CCH/13CCH is larger than 250 (Sakai et al. 2010). These ratios should reflect the production pathway of each molecule. In addition, recent observations in TMC-1 indicated that the abundances of the 13C isotopomers depend on which carbon atom in a molecule is substituted by 13C. Takano et al. (1998) observed the three 13C isotopomers of HC3N, and found that HCC13CN is more abundant than HC13CCN and H13CCCN, which indicates three carbon atoms are not equivalent in HC3N. Takano et al. (1998) suggested that the neutral-neutral reaction of C2H2 + CN is the main formation path to HC3N. Sakai et al. (2007; 2010) reported the abundance ratios of C13CS/13CCS = 4.2 2.3 and C13CH/13CCH = 1.6 0.4. Again, these results indicate two carbon atoms are not equivalent in CCS and CCH. Sakai et al. (2007; 2010) suggested that the neutral-neutral reactions of CH + CS and CH2 + C would significantly contribute to the CCS and CCH formation, respectively. These results indicate the neutral-neutral reactions might play an important role in production of such carbon-chain molecules. In this way, observations of 13C species would be useful to investigate chemistry of organic species.
Langer et al. (1984) and Langer & Graedel (1989) constructed theoretical models of the 13C chemistry in the gas phase. They showed that carbon bearing species are divided into three groups: CO, HCO+ and the ”carbon isotope pool”. CO is 13C-rich and ”carbon isotope pool” is 13C-poor. HCO+, on the other hand, can be either 13C-rich or 13C-poor. Recently Woods & Willacy (2009) revisited carbon isotope fractionation including the adsorption of gaseous molecules onto grain surfaces and grain surface reactions, but they do not distinguish 13C isotopomers. In addition, temporal evolutions in molecular clouds are not investigated in detail, because they focused on 13C species in protoplanetary disks.
In this paper, we present a detailed chemical model in cold dense cloud cores to investigate carbon isotope fractionation and isotopomer fractionation of CCH and CCS. In Section 2, we describe our fiducial model. In Section 3, we show the evolutions of molecular abundances, isotope ratios and isotopomer ratios in the fiducial model. In Section 4, we compare our results with the observations in TMC-1. We also discuss the dependence of our results on the assumptions of rate coefficients and initial condition of carbon. Since some terms are confusing, we define them here; ”carbon isotope ratio” is the abundance ratio of the 12CX/13CX, and ”carbon isotopomer ratio” is the abundance ratio of the 12C13CX/13C12CX. If a carbon isotope ratio deviates from the elemental [12C/13C] ratio, we call it ”carbon isotope fractionation”. If carbon isotopomer ratio deviates from unity, we call it ”carbon isotopomer fractionation”.
2 FIDUCIAL MODEL
2.1 Carbon isotope fractionation
There are two processes which fractionate carbon isotopes in molecular clouds: selective photodissociation and isotope-exchange reactions.
2.1.1 Selective photodissociation
Carbon monoxide is photodissociated mostly by line absorption. Because of the high abundance of CO, self-shielding is efficient especially for 12CO. Therefore the 12CO/13CO ratio is enhanced in the very thin surface region ( 1 mag) (e.g. van Dishoeck et al. 1988). In this study we consider central regions of molecular cloud cores with 10 mag, and hence we do not consider this process in the following sections.
2.1.2 Fractionation through isotope-exchange reactions
There are small zero-point vibrational energy differences among the isotopically distinct species. In a cloud of low temperature ( 10 K) the isotope fractionation occurs through isotope-exchange reactions. Watson et al. (1976) pointed out that the carbon isotope fractionation in interstellar molecules mainly occurs as a result of the reaction:
| (1) |
where , the zero-point vibrational energy difference between the reactants and products, is 35 K. The rate coefficient of this reaction was measured by Watson et al. (1976) at 300 K and by Smith & Adams (1980) at 80 - 510 K. Langer et al. (1984) extrapolated these experimental data below 80 K assuming the following relation between the forward reaction rate coefficient and the backward reaction rate coefficient :
where is Boltzmann coefficient. At 10 K, the forward rate coefficient is 1.34 10-9 cm3 s-1 and the backward rate coefficient is 4.0 10-11 cm3 s-1. Smith & Adams (1980) also measured the rate coefficient of the following proton transfer reaction at 80 - 510 K:
| (2) |
where the vibrational zero-point energy difference is = 9 K. Langer et al. (1984) estimated the reaction rate coefficient at 10 K: = 6.5 10-10 cm3 s-1 and = 2.7 10-10 cm3 s-1.
2.2 Carbon isotopomer fractionation
Sakai et al. (2007; 2010) discussed the cause of carbon isotopomer fractionation of CCS and CCH based on their observational results in TMC-1. They pointed out two possibilities: (i) the formation pathways of the species and (ii) the exchange of the 13C position after formation of molecules by isotopomer-exchange reactions. Specifically they proposed the reactions in Table 1.
2.2.1 Fractionation through formation paths
If the observed fractionation is due to the formation paths, the following neutral-neutral reaction (e.g. Turner et al. 2000) could significantly contribute to the CCH formation:
Two carbon atoms are not equivalent in this neutral-neutral reaction:
| (3) |
| (4) |
If the isotope ratios of the carbon atom and CH2 are different, the isotopomer ratio of CCH deviates from unity.
Similarly, the observed isotopomer fractionation of CCS could be due to the neutral-neutral reaction:
in which two carbon atoms are not equivalent:
| (5) |
| (6) |
In addition, the isotopomer fractionation of CCH might propagate to CCS through the following reactions (Yamada et al. 2002):
| (7) |
and
| (8a) | |||
| (8b) | |||
| (8c) |
In the reaction (7), the sulfur atom will attack the end carbon atom of CCH, which has the unpaired electron, to form the CCS structure (Yamada et al. 2002). In the case of the sulfur ion, the reaction may occur in a similar way. So C13CS is made from 13CCH, and 13CCS is made from C13CH through these processes. If these processes are efficient, the C13CS/13CCS ratio should be less than unity, given the C13CH/13CCH ratio is greater than unity. This is inconsistent with the observation: both the isotopomer ratios of CCH and CCS are greater than unity.
2.2.2 Isotopomer-exchange reactions
Fractionation by isotopomer-exchange reactions is also possible:
| (9) |
where , the zero-point vibrational energy difference of 13CCH and C13CH, is 8.1 K (R. Tarroni, private communication; Tarroni & Carter 2003). As a candidate of the isotopomer-exchange reaction of CCS, on the other hand, Sakai et al. (2010) considered the following reaction:
| (10) |
where , the zero-point vibrational energy difference of 13CCS and C13CS, is 17.4 K. According to the energy surface calculations, these exchange reactions, (9) and (10), do not have the activation barrier (Y. Osamura private communication). At low temperature ( 10 K), the isotopomer ratios of CCH and CCS can be greater than unity.
2.3 Reaction network
We construct a chemical reaction network with carbon isotopes and isotopomers. The network is based on the gas-grain model developed by the Ohio State University astrochemistry group (Garrod & Herbst 2006), and is expanded to include isotopes and isotopomers by the three procedures described below. While Garrod & Herbst model consists of 655 species and 6309 reactions, our reaction network consists of 1203 gas and grain species, and 21116 gas phase and grain surface reactions.
Firstly, we include 13C species into the reaction network statistically. For reactions involving 13C species, we assume that the total rate coefficient is the same as that of the corresponding reaction of the main isotope. We distinguish isotopomers only in species with less than three carbons to save computational time. For example, 13C12C12CH, 12C13C12CH and 12C12C13CH are different species, but 13C12C12C12CH, 12C13C12C12CH, 12C12C13C12CH and 12C12C12C13CH are treated as the same species, 12CCH. We checked molecular structures, so that symmetric molecules, such as C2H2, do not have isotopomers. We do not consider multiple 13C species for simplicity. The statistical expansion increases the number of the species and reactions by about two and three fold, respectively. For example, the reaction
with rate coefficients of is replaced by the following five reactions with rates , , , , and , respectively:
In this way, statistical expansion is the main cause of increasing the number of species and reactions. ”Statistically” means no fractionation occurs. In other words, all the isotope ratios are equal to the elemental [12C/13C] ratio and all the isotopomer ratios are unity.
Secondly, we include the gas phase reactions in Table 1 referring to the discussion in Section 2.2. The rate coefficients of these reactions are not measured in the laboratory. So we assume that the rate coefficients are 1 10-10 cm3 s-1 for neutral-neutral reactions and 1 10-9 cm3 s-1 for ion-neutral reactions. The dependence of our results on these rate coefficients is discussed in section 4.3.
Finally, we modify the branching ratios of proton transfer reactions and electron recombination reactions which break the C-H bond, such as
In the statistically expanded network, the rate coefficients of these reactions are set to , , and , respectively, where is the rate coefficient of the recombination of the 12C species. Then these reactions tend to make the isotopomer ratio of CCS unity, even if the isotopomer ratio of HCCS+ are fractionated. But it would be more likely that these reactions do not rearrange the structure of C-C-S. So we set the rate coefficient to be , , and zero, respectively.
Table 2 lists the elemental abundances in our model; it is known as ”low metal” values because of their strong depletions of species heavier than oxygen (e.g. Graedel et al. 1982). Initially the species are assumed to be atoms or atomic ions except for hydrogen, which is in molecular form. We assume the elemental isotope ratio, [12C/13C], of 60. If it is higher or lower than 60, the resultant molecular isotope ratios are scaled by [12C/13C]/60. We confirmed in the range of values, [12C/13C] = 30 - 77, the deviation from this scaling is less than 4 %.
We use the cosmic ray ionization rate of 1.3 10-17 s-1, which is commonly used for chemical model simulations for dense molecular clouds (e.g. Terzieva & Herbst 1998). We assume that the sticking probability of colliding gaseous species onto grains is unity, and the adsorbed species can diffuse on the grain surfaces by thermal hopping. We adopt the same adsorption energies and non-thermal desorption rates as Garrod & Herbst (2006). As a physical model, we assume a static cloud core. In our models, the physical parameters are set to = 10 K, = 5 104 and = 10 mag, referring to the observation of TMC-1 (Pratap et al. 1997), unless otherwise stated. In section 3, we describe the results of our fiducial model.
3 RESULT
3.1 Isotope ratios
3.1.1 Isotope ratios of gas species
In this paper, we define ’abundance’ as the fractional abundance with respect to H nuclei. Figure 1a shows the evolutions of major carbon-bearing species. Initially the carbon exists as carbon ion, which recombines to form carbon atoms in 102 yr. After a few 104 yr major form of carbon is mainly in carbon monoxide, which depletes onto the grain surfaces after 5 104 yr.
Figure 1b shows the evolutions of the isotope ratios of the carbon-bearing species. Our results agree with Langer et al. (1984); carbon bearing species are divided into three groups: CO, HCO+ and the ”carbon isotope pool”. Although we include gas-grain interactions, it does not affect the isotope ratios in the gas phase before the depletion of CO ( 105 yr). Adsorption rates are inversely proportional to square root of the mass of species, so that the rate of 12C species and 13C species are different. But this difference is small ( 4 %) and do not affect significantly. It should be noted, however, that when the CO depletion becomes significant, the reaction (1) becomes less efficient and isotope ratios of ”carbon isotope pool” species are lowered compared to the model without gas-grain interactions. Since the thermal desorption is ineffective at 10 K, grain surface reactions do not affect isotope ratios of gaseous species. Then the isotope fractionation of the gaseous species is mostly determined by the gas phase reactions and the depletion of CO. Before a few 104 yr the abundance ratio of is significantly smaller than 60 because of the reaction (1). As the abundance of CO increases with time and CO becomes the dominant carbon-bearing species, the isotope ratio gets close to the elemental abundance ratio of [12C/13C] = 60. For example, the ratio is 54 at 105 yr. In contrast, the C+/13C+ ratio is larger than 60 because of the reaction (1). Many carbon species are produced by reactions starting from C+ or C, which is produced by recombination of C+. Therefore the isotope ratios of these ”carbon isotope pool” species are similar to the C+/13C+ ratio before 103 yr and the C/13C ratio after 103 yr, although actual values vary among species depending on their production pathways. For example, the CN/13CN ratio is 83, while CS/13CS ratio is 109 at 104 yr. The evolution of the HCO+/H13CO+ ratio is similar to those of ”carbon isotope pool” at 103 yr, but the ratio is lowered by the reaction (2) after a few 103 yr; the HCO+/H13CO+ ratio is 45 at 105 yr.
To investigate the density dependence of the isotope ratios, we also performed calculations with = 5 103 and 5 105 cm-3. The evolution is in general faster at higher densities. Since we are interested in carbon-bearing species, we compare isotope ratios of these molecules at the time of peak carbon-chain abundance; 1 105, 2 104 and 4 103 yr for densities of , and cm-3, respectively. We found that the isotope ratios do not significantly depend on density. For example, the ratio at the selected time is 83, 81 and 80, and the ratio is 83, 92 and 108 for densities of , and cm-3, respectively. The isotope ratios of other species in each density model are listed in Table 3.
3.1.2 Isotope ratios of ice mantle species
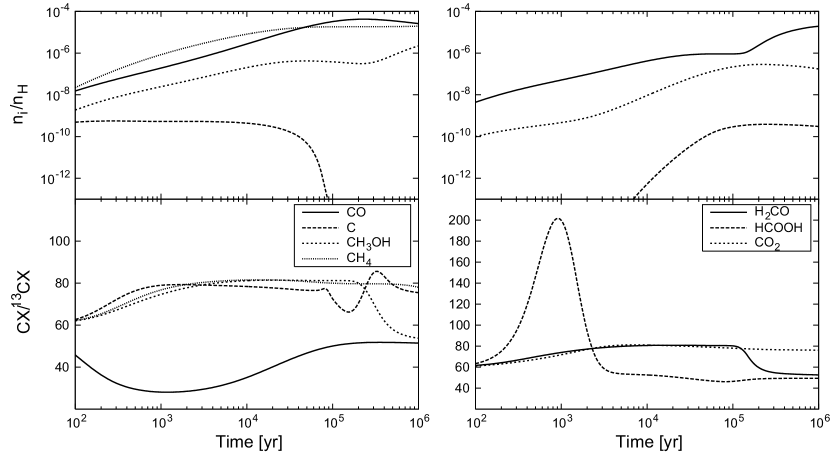
Figure 2(upper panels) shows the evolution of the major ice mantle species. H2CO and CH3OH are the most abundant organic species in ice mantles. They are formed from the carbon atom at 2 105 yr and from CO at later time.
Figure 2(lower panels) shows the evolution of the isotope ratios of the ice mantle species. Carbon atoms and carbon monoxides in the gas phase are adsorbed and form more complex species by grain surface reactions. Before 105 yr, the isotope ratio of carbon atoms on grain surfaces is almost the same as in the gas phase. Carbon monoxide, on the other hand, is directly absorbed on grain surfaces and is also formed by the grain surface reactions of the carbon-bearing species. Then the isotope ratio of CO on grain surfaces is slightly different from that in the gas phase. The isotope ratios of ice mantle species depend mainly on whether the species are formed from the carbon atom or the CO molecule; the isotope ratio is larger than 60 if the species are formed from C atom, while the ratio is smaller than 60 if the species are formed from CO. For example, CH3OH is formed from the carbon atom and its isotope ratio is 81 at = 2 105 yr. After 2 105 yr, CH3OH are formed from the CO molecule and the isotope ratio decreases to 53 at 106 yr, which is almost the same as the isotope ratio of CO. HCOOH is an exception. It is formed from HCO+ in the gas phase and adsorbed onto the grain surfaces. The isotope ratio of HCOOH is similar to that of HCO+ in the gas phase. Isotope ratios of ice species in higher ( cm-3) and lower ( cm-3) density models are listed in Table 4.
Boogert et al. (2000; 2002) found that the solid CO2/13CO2 ratio is similar to the solid CO/13CO ratio towards NGC 7538 IRS 9, and suggested that CO2 is formed from CO on grain surfaces, rather than from the carbon atom in the gas phase. In our model, CO2 is formed in the gas-phase via the reaction of an O atom with HCO, which is formed from carbon atom, and adsorbed onto grain surfaces. Then the isotope ratio of CO2 is similar to that of the carbon atom. However if we use the modified rates method (e.g. Ruffle and Herbst 2000), which artificially slows down the surface diffusion rate of the hydrogen atom, CO2 is formed from CO on grain surfaces via the reaction of HCO + O (Aikawa et al. 2005). In this case, the isotope ratio of CO2 ice at 2 yr should be closer to that of CO ice just like H2CO and CH3OH.
It should be noted that the observed isotope ratio of CO2 ice varies with lines of sight. The solid CO/13CO and CO2/13CO2 ratios towards NGC 7538 IRS 9 are actually 71 15 and 80 11, respectively (Boogert et al. 2000; 2002). The isotope ratio of CO2 is similar to or slightly higher than that of CO. On the other hand, towards NGC 2264 IRS1, Langer & Penzias (1990) found the gas C18O/13C18O ratio is 56 3, and Gibb et al (2004) found the solid CO2/13CO2 ratio is 131 21. The isotope ratio of CO2 ice is higher than that of CO gas by a factor of 2.3, assuming the carbon isotope fractionation of 18O species is similar to that of 16O species (e.g. Langer et al. 1984). In our model, in which CO2 is mainly formed in the gas phase and adsorbed onto grain surfaces, such high isotope ratios of CO2 ice relative to that of CO ice (gas) is realized at 105 yr in the model with = cm-3. These variations may suggest that interstellar CO2 ice is formed from both in the gas phase and on grain surfaces, and contributions of the two paths varies among clouds.
3.2 Isotopomer ratios
3.2.1 CCH
Figure 3a shows the temporal evolution of the assorted species relevant to the isotopomer fractionation of CCH and CCS. Figure 3b shows the C13CH/13CCH ratio. The isotopomer ratio is significantly enhanced in the fiducial model (solid line). In order to investigate whether the isotopomer fractionation of CCH is caused by (i) formation reactions or (ii) isotopomer-exchange reactions, we performed a calculation without the exchange reaction (9) (dashed line in Figure 3b). It is clear that isotopomer fractionation is mostly due to the exchange reaction.
Figure 4 shows the major formation and destruction paths of CCH isotopomers. The reactions (3) and (4) are the dominant formation reactions until 104 yr. The isotope ratio of CH2 is larger than that of carbon atoms, and hence the isotopomer ratio is lowered. After 104 yr, on the other hand, CCH is mainly produced from the destruction of larger species (e.g. C3H) by the oxygen atom and electron recombinations of symmetrical species (e.g. C2H). These reactions tend to make the isotopomer ratio of CCH unity, since they form the same amount of the CCH isotopomer: C13CH and 13CCH. Therefore, without the exchange reaction (9), the isotopomer ratio becomes almost unity in the model.
In our model, we do not distinguish isotopomers in species with more than four carbons. We checked if this simplification affects our results. We performed calculations without these large carbon chains (more than 4 carbon atom) and the exchange reaction (9), and confirmed the isotopomer ratio of CCH is as low as the dashed line in Figure 3b.
In the model with the exchange reaction, the isotopomer ratio increases with time in a few 103 yr as the electron abundance decreases. Then, the ratio gradually decreases as the H atom abundance decreases by adsorption and subsequent grain surface reactions. At several 104 yr, the ratio starts to increase again by the adsorption of oxygen atoms. After 3 105 yr, it reaches nearly the equilibrium ratio of 2.2 (/).
Since the H atom abundance is an important factor for the efficiency of the exchange reaction (9), we briefly discuss the formation and destruction of H atoms in dense cloud cores (Figure 3a). Before 104 yr, the primary sources of the H atom are the reactions of hydrocarbons, such as the recombination of CH and the reaction of CH + O, and the destruction is by adsorption on grain surfaces followed by subsequent hydrogenation reactions, such as H + OH. At yr, H atoms are mainly formed by cosmic ray induced photodissociation of hydrogen molecules. At this stage the absolute abundance of the H atom is 1 cm-3 independent of the gas density. We also checked the dependence of our results on the initial H atom abundance; if the initial abundance is lowered by an order of magnitude, the isotopomer ratio varies only slightly.
Figure 5 shows density dependence of the C13CH/13CCH ratio. As the density increases, both the abundances of electron and H atom decrease. While the electron abundance is proportional to , the H atom abundance is proportional to . Then the peak isotopomer ratio decreases with density.
The isotopomer fractionation also affects the isotope ratios, i.e. the CCH/13CCH and CCH/C13CH ratios (Figure 6). The reaction (9) enhances 13C in C13CH, while it dilutes 13C in 13CCH. For comparison, the dashed line in Figure 6 shows the isotope ratios of CCH in the model without the isotopomer fractionation: the model without the reaction (3), (4), (5), (6), (9) and (10).
3.2.2 CCS
Figure 7 shows the temporal evolution of the C13CS/13CCS ratio. The isotopomer ratio of CCS is lower than unity in the model without the exchange reaction (10) (dashed line). The reactions (5) and (6) are not the main formation reactions of C13CS and 13CCS in our model. Instead, CCS is mainly formed by the electron recombination of larger ions, such as (Figure 4). These reactions tend to make the isotopomer ratio of CCS unity. The reaction (7) and (8) decreases the isotopomer ratio of CCS, because the isotopomer ratio of CCH is larger than unity. In the fiducial model (solid line), the isotopomer ratio is lower than unity except for very limited periods. The isotopomer ratio reaches a maximum of about 1.2 by the reaction (10) at 3 104 yr. Figure 8 shows the density dependence of the C13CS/13CCS ratio. Although the peak isotopomer ratio increases with density, the maximum ratio is 1.8, which is much lower than observed. Unlike CCH, the exchange reaction (10) is inefficient, because the sulfur atom is less abundant than the hydrogen atom by three orders of magnitude.
4 DISCUSSION
4.1 Comparisons with observations of TMC-1
The gas density in TMC-1 is 104 - 105 cm-3 (Pratap et al. 1997). In the model with = 5 104 cm-3, the abundances of carbon-chain molecules, such as HC3N, reach their maxima at 2 104 yr. Since carbon-chain molecules are abundant in TMC-1, we compare the obtained molecular abundaces and isotope and isotopomer ratios in the fiducial model at 2 104 yr to the observed values in TMC-1.
Pratap et al. (1997) made maps along the TMC-1 ridge, and determine the column densities of C18O and CCH. The molecular abundance of CCH in TMC-1 is 5.7 10-10 - 4.0 10-9, assuming a C18O/H2 ratio of 1.7 10-7 (Frerking et al. 1982). In our model, we obtain the abundance of CCH to be 3.0 10-9, which is in reasonable agreement with the observed value.
In the fiducial model, we obtain the CCH/13CCH, CCH/C13CH and C13CH/13CCH ratios to be 99, 63 and 1.6, respectively, at 2 104 yr. The observed CCH/C13CH and CCH/13CCH ratios are higher than 170 and 250, respectively (Sakai et al. 2010). The average isotope ratio, which is calculated by
is higher than 200, and is three times higher than our model. Additional isotope-exchange reactions, which are currently unknown, may be needed to reproduce the observed values. On the other hand, the observed C13CH/13CCH ratio is 1.6 0.4 (Sakai et al. 2010), which is in reasonable agreement with our model. Therefore the exchange reaction (9) can account for the isotopomer fractionation of CCH.
We obtain the CCS/13CCS, CCS/C13CS and C13CS/13CCS ratios to be 84, 76 and 1.1, respectively, in the fiducial model at 2 104 yr. The observed CCS/13CCS, CCS/C13CS and C13CS/13CCS ratios are 230 130, 54 5, and 4.2 2.3, respectively (Sakai et al. 2007). The average isotope ratio is 87, which is in good agreement with our model results. But our model underestimates the isotopomer fractionation. We discuss this problem in the next section.
4.2 Exchange reactions of CCS
The isotopomer-exchange reaction (10) is not efficient enough to account for the observed isotopomer ratio of CCS, because of the low abundance of sulfur atoms. Since the reactant is not necessarily the sulfur atom for the exchange reaction, we consider a possibility of the following neutral-neutral reaction:
| (11) |
where is 17.4 K. This can be regarded as a catalytic reaction by the hydrogen atom. According to the quantum chemical calculation by Yamada et al. (2002), the reaction (11) does not have the activation barrier. It could be more effective than the reaction (10), because the hydrogen atom is more abundant than the sulfur atom. Since the rate coefficients of the reaction (11) has not been measured or calculated, we simply assume that the forward rate coefficient is 1 10-10 cm3 s-1, which is a typical collisional rate coefficient between neutral species. Figure 9a shows the temporal evolution of the isotopomer ratio of CCS in the model with the exchange reaction (11). The ratio is significantly enhanced in comparison with the model in Figures 7 and 8, and reaches nearly the equilibrium ratio of 5.7 (/) at a few 104 yr. After several 104 yr, CCS abundance decreases by about two orders of magnitude (Figure 3a). The abundance of S-bearing molecular ions, such as HCCS+, decrease only by an order of magnitude, because H abundance is enhanced by the CO depletion. Then the exchange reaction (11), whose efficiency is proportional to the CCS abundance, becomes less effective than ion-molecule reactions, and the isotopomer ratio decreases to 4.1. Our model with the reaction (11) can reasonably explain the observed isotopomer ratio.
The isotopomer fractionation also affects the isotope ratios, CCS/13CCS and CCS/C13CS (Figure 9b). 13C is significantly diluted in 13CCS, and the CCS/13CCS ratio is higher than 200 in several 104 yr. On the other hand, the CCS/C13CS ratio is lower than 60. At 2 104 yr, the CCS/13CCS and CCS/C13CS ratios are 263 and 47, respectively, which are in reasonable agreement with the observed isotope ratios. Hence the reaction (11) is a possible culprit for the isotopomer fractionation of CCS.
4.3 Dependences on rate coefficients of isotopomer-exchange reactions
In the previous sections we assumed the forward reaction rate coefficients of the isotopomer-exchange reactions are all 1 10-10 cm3 s-1, which is a typical collisional rate coefficient between neutral species. However it is not obvious whether the actual exchange reactions proceed at the collisional rate. For example, the rate coefficient of the similar type of reactions, such as HNC3 + H HC3N + H, is assumed to be 1 10-11 cm-3 s-1 in our model (e.g. Garrod Herbst 2006). In particular, reaction (11) requires the rearrangement of the order of the carbon nuclei in the chain through the transient cyclic isomers (Yamada et al. 2002). Although the reaction is exothermic, the efficiency of reaction (11) might be low. Hence, we investigate the dependence of the isotopomer ratios on the rate coefficients of reactions (9) and (11). Figure 10 shows the temporal evolution of the isotopomer ratios of (a) CCH and (b) CCS. The forward reaction rate coefficients are 1 10-10 cm3 s-1 (solid line), 1 10-11 cm3 s-1 (dashed line) and 1 10-12 cm3 s-1 (dotted line). We can see the forward reaction rate coefficients should be larger than 1 10-11 cm3 s-1 to account for the observed isotopomer ratios by the exchange reactions (9) and (11). Laboratory measurements, as well as more detailed theoretical calculations of these isotopomer-exchange reactions, are highly desirable.
4.4 Initial condition of the carbon
So far, we have assumed that all the carbon initially exists as carbon ions. This assumption is the most favorable for the carbon isotope fractionation, because the isotope-exchange reaction (1) becomes efficient. Here, we investigate the dependencies of isotope ratios on the initial condition of the carbon.
We performed calculations with two different initial conditions; (1) a half of the carbon exists as atomic carbon, and (2) all the carbon is in atomic form. In the former case, the evolution of isotope ratios in the gas phase is very similar to the fiducial model, because the abundances of major carbon-bearing species are almost the same as the fiducial model after 102 yr. Figure 11 shows the evolutions of (a) molecular abundances and (b) isotope ratios in the gas phase for the latter case: all the carbon is initially atomic carbon. The molecular abundances and isotope ratios are different from the fiducial model before 105 yr, but they approach to the fiducial model after a few 105 yr. The abundances of C, C+ and CO are similar to those in the fiducial model after 104 yr. The isotope ratio of CO is nearly 60 before 104 yr, since the abundance of C+ is small. After 104 yr the ratio slightly decreases: 12CO/13CO = 56 at 106 yr. On the other hand, the isotope ratio of C+ is as high ( 60) as in the fiducial model, since the abundance of CO is smaller than in the fiducial model only by an order of magnitude. The isotope ratio of the carbon atom is nearly 60 before 105 yr. After 105 yr the ratio becomes greater than 60 because of the neutralization of the carbon ion. ”Carbon isotope pool” species are mostly produced from the carbon atoms, then their isotope ratios are similar to that of the carbon atom. In this way, the carbon isotope fractionation occurs by the isotope-exchange reactions after 105 yr, even if all the carbon is initially in the carbon atom. These results suggest isotope fractionation in early times does not much affect the isotope ratios after 105 yr. In order to account for the isotope fractionation at the period of peak carbon chain abundances ( yr), however, some fraction of carbon should be carbon ion initially.
4.5 Summary
We constructed a gas-grain chemical network model that includes carbon isotopes and isotopomers in order to investigate the evolution of molecular abundances, the carbon isotope ratios and the isotopomer ratios of CCH and CCS in cold dense cloud cores. The principal results are follows.
1. We confirm that the isotope ratios of molecules, both in the gas phase and on grain surfaces, mostly depend on whether the species is formed from the carbon atom (ion) or the CO molecule; the isotope ratio is larger than the elemental abundance ratio of [12C/13C] if the species is formed from the carbon atom, while the ratio is smaller if the species is formed from the CO molecule.
2. There are two possible processes of isotopomer fractionation: (i) the formation pathways of the species and (ii) the exchange of the 13C position by isotopomer-exchange reactions. We reproduce the observed isotopomer ratio C13CH/13CCH by considering the isotopomer-exchange reaction: 13CCH + H C13CH + H + 8.1 K, if this reaction proceeds with the forward rate coefficient 10-11 cm3 s-1. The isotope ratio is underestimated in our model, which is left for future studies.
3. We reproduce the observed C13CS/13CCS, CCS/C13CS and CCS/13CCS ratios simultaneously by considering the isotopomer-exchange reaction: 13CCS + H C13CS + H + 17.4 K, if this reaction proceeds with the forward rate coefficient 10-11 cm3 s-1.
4. In conclusion, isotopomer fractionation of CCH and CCS can be due to isotopomer-exchange reactions. Laboratory measurements and detailed quantum calculations of these isotopomer exchange reactions are highly desired.
References
- Aikawa et al. (2005) Aikawa, Y., Herbst, E., Roberts, H., & Caselli, P. 2005, ApJ, 620, 330.
- Boogert et al. (2000) Boogert, A. C. A., Eherenfreund, P., & Gerakines, P. A., et al. 2000, A&A, 353, 349.
- Boogert et al. (2002) Boogert, A. C. A., Blake, G. A., & Tielens, A. G. G. M. 2002, ApJ, 577, 271.
- Frerking et al. (1982) Frerking, M. A., Langer, W. D., & Wilson, R. W. 1982, ApJ, 262, 590.
- Garrod & Herbst (2006) Garrod, R. T., & Herbst, E. 2006, A&A, 457, 927.
- Gibb et al. (2004) Gibb, E. L., Whittet, D. C. B., Boogert, A. C. A., & Tielens, A. G. G. M. 2004, ApJS, 151, 35.
- Graedel et al. (1982) Graedel, T. E., Langer, W. D., & Frerking, M. A. 1982, ApJS, 48, 321.
- Langer et al. (1984) Langer, W. D., Graedel, T. E., Frerking, M. A., & Armentrout, P. B. 1984, ApJ, 277, 581.
- Langer & Graedel (1989) Langer, W. D., & Graedel, T. E. 1989, ApJS, 69, 241.
- Langer & Penzias (1990) Langer, W. D., & Penzias, A. A. 1990, ApJ, 357, 477.
- Langer & Penzias (1993) Langer, W. D., & Penzias, A. A. 1993, ApJ, 408, 539.
- Lucas, R. & Liszt, H. (1998) Lucas, R., & Liszt, H. 1998, A&A, 337, 246.
- Pratap, P. et al. (1997) Pratap, P., Dickens, J. E., & Snell, R. L., et al. 1997, ApJ, 486, 862.
- Ruffle & Herbst (2000) Ruffle, D. P., & Herbst, E. 2000, MNRAS, 319, 837.
- Sakai et al. (2007) Sakai, N., Ikeda, M., & Morita, M., et al. 2007, ApJ, 663, 1174.
- Sakai et al. (2010) Sakai, N., Saruwatari, O., & Sakai, T., et al. 2010, A&A, 512, A31.
- Smith & Adams (1980) Smith, D., & Adams, N. G. 1980, ApJ, 242, 424.
- Takano et al. (1998) Takano, S., Masuda, A., & Hirahara, Y., et al. 1998, A&A, 329, 1156.
- Tarroni & Carter (2003) Tarroni, R., & Carter, S. 2003, J.Chem. Phys., 119, 12878.
- Terzieva & Herbst (1998) Terzieva, R., & Herbst, E. 1998, ApJ, 501, 207.
- Turner et al. (2000) Turner, B. E., Herbst, E., & Terzieva, R. 2000, ApJS, 126, 427.
- van Dishoeck & Black (1988) van Dishoeck, E. F., & Black, J. H. 1988, ApJ, 334, 771.
- Watson et al. (1976) Watson, W. D., Anicich, V. G., & Huntress, W. T., Jr., 1976, ApJ, 205, L165.
- Woods & Willacy (2009) Woods, P. M., & Willacy, K. 2009, ApJ, 693, 1360.
- Yamada et al. (2002) Yamada, M., Osamura, Y., & Kaiser, R. I. 2002, A&A, 395, 1031.


| Reaction | (cm3 s-1) aafootnotemark: a | |
|---|---|---|
| CH + CS CCS + H | 1.00(-10) bbfootnotemark: b | - |
| CH + 13CS C13CS + H | 1.00(-10) | - |
| 13CH + CS 13CCS + H | 1.00(-10) | - |
| CCS+ + H2 HCCS+ + H | 1.00(-9) | - |
| C13CS+ + H2 HC13CS+ + H | 1.00(-9) | - |
| 13CCS+ + H2 H13CCS+ + H | 1.00(-9) | - |
| 13C+ + CO 13CO + C+ | 1.34(-9) | 35 |
| HCO+ + 13CO CO + H13CO+ | 6.50(-10) | 9 |
| 13CCH + H C13CH + H | 1.00(-10) | 8.1 |
| 13CCS + S C13CS + S | 1.00(-10) | 17.4 |
| species | Abundance |
|---|---|
| H2………………………………………. | 5.00(-1) |
| H……………………………………….. | 5.00(-5) |
| He………………………………………. | 9.75(-1) |
| 12C+…………………………………….. | 7.86(-5) |
| 13C+…………………………………….. | 1.31(-6) |
| N……………………………………….. | 2.47(-5) |
| O……………………………………….. | 1.80(-4) |
| Si+……………………………………… | 2.74(-9) |
| S+………………………………………. | 9.14(-8) |
| Fe+……………………………………… | 2.74(-9) |
| Na+……………………………………… | 2.25(-9) |
| Mg+……………………………………… | 1.09(-8) |
| Cl+……………………………………… | 1.00(-9) |
| P+………………………………………. | 2.16(-10) |
| 104 yr | 105 yr | 106 yr | |||||
|---|---|---|---|---|---|---|---|
| Species | (cm-3) | / | 12CX/13CX | / | 12CX/13CX | / | 12CX/13CX |
| CO | 5 | 6.0(-6) | 14 | 2.8(-5) | 43 | 2.5(-5) | 57 |
| 5 | 1.7(-5) | 34 | 1.6(-5) | 54 | 1.3(-6) | 50 | |
| 5 | 1.2(-5) | 51 | 2.0(-7) | 48 | 1.2(-7) | 49 | |
| C | 5 | 6.5(-5) | 79 | 2.6(-5) | 80 | 8.1(-9) | 154 |
| 5 | 4.0(-5) | 79 | 1.6(-8) | 84 | 3.0(-8) | 77 | |
| 5 | 7.0(-7) | 74 | 9.7(-10) | 65 | 5.2(-10) | 66 | |
| HCO+ | 5 | 3.4(-11) | 88 | 2.3(-9) | 51 | 5.7(-9) | 52 |
| 5 | 4.9(-10) | 51 | 1.9(-9) | 45 | 5.0(-10) | 50 | |
| 5 | 2.7(-10) | 42 | 9.8(-11) | 48 | 7.3(-11) | 49 | |
| H2CO | 5 | 5.9(-10) | 158 | 1.7(-9) | 74 | 3.3(-9) | 76 |
| 5 | 2.9(-10) | 76 | 3.2(-10) | 74 | 2.4(-9) | 68 | |
| 5 | 5.6(-11) | 73 | 1.6(-10) | 56 | 1.3(-10) | 56 | |
| CS | 5 | 1.7(-8) | 150 | 2.6(-9) | 83 | 1.9(-10) | 109 |
| 5 | 1.4(-8) | 109 | 3.0(-10) | 77 | 5.1(-10) | 75 | |
| 5 | 1.9(-9) | 87 | 4.4(-11) | 72 | 4.8(-11) | 73 | |
| CN | 5 | 7.0(-9) | 130 | 8.0(-9) | 83 | 3.3(-9) | 182 |
| 5 | 4.6(-9) | 83 | 7.6(-10) | 84 | 7.7(-9) | 77 | |
| 5 | 9.8(-10) | 77 | 6.9(-10) | 67 | 3.7(-10) | 69 | |
| CH | 5 | 9.0(-9) | 127 | 8.0(-9) | 78 | 8.7(-10) | 97 |
| 5 | 5.0(-9) | 78 | 5.0(-10) | 77 | 1.5(-9) | 75 | |
| 5 | 2.6(-10) | 74 | 1.1(-10) | 71 | 1.3(-10) | 72 | |
| CH2 | 5 | 6.2(-9) | 102 | 2.5(-9) | 78 | 8.2(-11) | 88 |
| 5 | 3.5(-9) | 79 | 1.2(-10) | 75 | 2.5(-10) | 76 | |
| 5 | 6.7(-10) | 73 | 9.1(-11) | 72 | 1.1(-10) | 73 | |
| HCN | 5 | 3.6(-10) | 151 | 1.4(-8) | 93 | 5.3(-9) | 180 |
| 5 | 4.6(-8) | 85 | 1.5(-9) | 96 | 1.1(-8) | 77 | |
| 5 | 4.1(-8) | 77 | 9.6(-10) | 68 | 4.1(-10) | 69 | |
| HNC | 5 | 3.0(-10) | 172 | 1.3(-8) | 96 | 5.3(-9) | 186 |
| 5 | 3.6(-8) | 88 | 1.3(-9) | 101 | 1.1(-8) | 77 | |
| 5 | 4.0(-8) | 77 | 9.2(-10) | 67 | 3.8(-10) | 69 |
| 104 yr | 105 yr | 106 yr | |||||
|---|---|---|---|---|---|---|---|
| Species | (cm-3) | / | 12CX/13CX | / | 12CX/13CX | / | 12CX/13CX |
| HC3N | 5 | 4.8(-13) | 123 | 9.4(-10) | 85 | 1.2(-11) | 99 |
| 5 | 1.8(-9) | 76 | 1.4(-10) | 73 | 2.8(-11) | 75 | |
| 5 | 9.5(-10) | 71 | 2.9(-13) | 73 | 9.4(-14) | 71 | |
| HC5N | 5 | 7.2(-14) | 149 | 7.2(-11) | 83 | 1.1(-12) | 88 |
| 5 | 4.3(-10) | 76 | 9.6(-12) | 71 | 2.2(-12) | 74 | |
| 5 | 9.6(-11) | 68 | 1.6(-14) | 73 | 4.3(-15) | 89 | |
| CCH 11footnotemark: 1 | 5 | 6.8(-9) | 136 | 8.6(-9) | 80 | 7.2(-10) | 107 |
| 5 | 3.3(-9) | 78 | 2.2(-9) | 76 | 8.3(-10) | 76 | |
| 5 | 8.2(-10) | 73 | 2.7(-11) | 71 | 2.4(-11) | 70 | |
| CCS 11footnotemark: 1 | 5 | 2.0(-10) | 140 | 1.0(-9) | 81 | 3.9(-10) | 97 |
| 5 | 1.3(-9) | 83 | 2.4(-10) | 74 | 2.3(-11) | 75 | |
| 5 | 6.2(-10) | 80 | 2.9(-13) | 81 | 3.4(-13) | 79 | |
| C3S | 5 | 7.0(-12) | 149 | 1.0(-10) | 82 | 3.4(-12) | 86 |
| 5 | 1.1(-10) | 82 | 3.2(-11) | 71 | 2.5(-12) | 74 | |
| 5 | 1.2(-10) | 73 | 1.8(-14) | 79 | 1.6(-14) | 81 |
| 104 yr | 105 yr | 106 yr | |||||
|---|---|---|---|---|---|---|---|
| Species | (cm-3) | / | 12CX/13CX | /nH | 12CX/13CX | / | 12CX/13CX |
| CO ice | 5 | 2.5(-7) | 33 | 2.8(-6) | 37 | 2.1(-5) | 56 |
| 5 | 2.7(-6) | 35 | 3.2(-5) | 50 | 2.6(-5) | 51 | |
| 5 | 2.8(-5) | 46 | 4.0(-5) | 48 | 2.7(-5) | 49 | |
| CH3OH ice | 5 | 2.9(-8) | 76 | 7.2(-8) | 80 | 1.6(-6) | 54 |
| 5 | 2.0(-7) | 81 | 3.8(-7) | 81 | 2.2(-6) | 54 | |
| 5 | 7.4(-7) | 82 | 6.2(-7) | 81 | 1.3(-6) | 52 | |
| HCOOH ice | 5 | 1.1(-18) | 129 | 3.4(-12) | 53 | 2.5(-10) | 59 |
| 5 | 5.3(-13) | 53 | 2.9(-10) | 46 | 3.0(-10) | 49 | |
| 5 | 4.8(-11) | 45 | 1.5(-10) | 44 | 1.1(-10) | 44 | |
| CO2 ice | 5 | 7.7(-10) | 74 | 6.1(-9) | 81 | 9.0(-8) | 78 |
| 5 | 9.3(-9) | 81 | 2.2(-7) | 78 | 1.7(-7) | 76 | |
| 5 | 3.2(-7) | 79 | 5.2(-7) | 78 | 2.8(-7) | 77 | |
| H2CO ice | 5 | 6.5(-8) | 75 | 2.4(-7) | 60 | 1.4(-5) | 54 |
| 5 | 4.2(-7) | 81 | 9.1(-7) | 80 | 2.0(-5) | 53 | |
| 5 | 1.3(-6) | 80 | 2.6(-6) | 61 | 1.5(-5) | 50 | |
| CH4 ice | 5 | 7.2(-7) | 78 | 8.2(-6) | 82 | 1.2(-5) | 79 |
| 5 | 8.1(-6) | 81 | 1.8(-5) | 80 | 2.0(-5) | 78 | |
| 5 | 2.2(-5) | 81 | 2.2(-5) | 81 | 2.3(-5) | 80 |