Solar-like oscillations and activity in Procyon: A comparison of the 2007 MOST**affiliation: Based on data from the MOST satellite, a Canadian Space Agency mission, jointly operated by Dynacon Inc., the University of Toronto Institute for Aerospace Studies and the University of British Columbia, with the assistance of the University of Vienna. and ground-based radial velocity campaigns
Abstract
We compare the simultaneous 2007 space-based MOST photometry and ground-based radial velocity observations of the F5 star Procyon. We identify slow variations in the MOST data that are similar to those reported in the radial velocity (RV) time series, and confirm by comparison with the Sun that these variations are likely the signature of stellar activity. The MOST power spectrum yields clear evidence for individual oscillation frequencies that match those found in the radial velocity data by Bedding et al. (2010). We identify the same ridges due to modes of different spherical degree in both datasets, but are not able to confirm a definite ridge identification using the MOST data. We measure the luminosity amplitude per radial mode ppm. Combined with the estimate for the RV data by Arentoft et al. (2008) this gives a mean amplitude ratio of ppm cm-1 s, considerably higher than expected from scaling relations but in reasonable agreement with theoretical models by Houdek (2010). We also compare the amplitude ratio as a function of frequency, and find that the maximum of the oscillation envelope is shifted to higher frequencies in photometry than in velocity.
Subject headings:
stars: individual (Procyon) — stars: oscillations — stars: activity — stars: rotation — techniques: photometric — techniques: radial velocities1. Introduction
The detection and measurement of oscillations in stars provides a unique possibility to infer details about the physics governing their interiors. The prospect of extending such studies from the Sun to distant stars has motivated many observation campaigns in recent decades. Even with the wealth of new space-based photometry from CoRoT (see, e.g., Michel et al., 2008) and Kepler (see, e.g., Gilliland et al., 2010) there is still an important place for ground-based spectroscopic campaigns of bright nearby stars with well-known fundamental parameters. Owing to its brightness (), proximity (d = 3.5 pc), and membership in an astrometrically well determined binary system, the F5 sub-giant Procyon A ( CMi, HR 2943, HD 61421) has long been considered a prime target for such campaigns.
The majority of early efforts to detect oscillations in Procyon have relied on measuring Doppler velocities from a single site. The first claimed detection dates back to Gelly et al. (1986) which, however, could not be confirmed by Libbrecht (1988) or Innis et al. (1991), who reported null-detections at similar sensitivity levels. With the benefit of hindsight, it now seems that the first detection of power excess in Procyon (and, in fact, any other solar-like star than the Sun) was by Brown et al. (1991). This was followed by numerous observing campaigns, mostly single-site, taking advantage of the increasing precision of Doppler-shift measurements (Mosser et al., 1998; Barban et al., 1999; Martić et al., 1999, 2004; Claudi et al., 2004; Eggenberger et al., 2004; Bouchy et al., 2004; Leccia et al., 2007). While all of these studies revealed clear power excess in the expected frequency range of 0.5–1 mHz, a consistent determination of individual frequencies was hampered due to severe aliasing caused by daily gaps inevitable in dual or single-site observations.
The first two sets of continuous observations of Procyon by the Canadian MOST satellite (Walker et al., 2003; Matthews, 2007) in 2004 and 2005 resulted in null-detections, leading to the conclusion that luminosity amplitudes in Procyon must be lower than 15 ppm and/or the mode lifetimes shorter than 2–3 days (Matthews et al., 2004; Guenther et al., 2007). Bedding et al. (2005) found these results to be compatible with limits set from ground-based radial velocity observations and Baudin et al. (2008) confirmed the null-result, while Régulo & Roca Cortés (2005) and Marchenko (2008) cautiously claimed a detection of oscillations based on a re-analysis of MOST data. Meanwhile, Bruntt et al. (2005) reported a detection of power excess with amplitudes of about twice the solar value ( 8 ppm) based on continuous space-based photometry by the WIRE satellite, consistent with the upper limits set by the MOST results.
The clear identification of individual oscillation modes in Procyon was finally achieved with a large ground-based radial velocity campaign that was carried out in January 2007 (Arentoft et al., 2008; Bedding et al., 2010). Simultaneously, a third set of MOST observations, longer and with higher precision than the previous runs, was obtained in January and February 2007 (Guenther et al., 2008). Here we present the first direct comparison of these datasets.
2. Summary of observing campaigns
The following sections present a brief summary of the observations and main results of the two campaigns on which the comparison in this paper is based. For a brief introduction to basic characteristics of solar-like oscillations, relevant to Procyon, we refer the reader to Section 2 in Bedding et al. (2010).
2.1. MOST photometry
The MOST (Microvariability and Oscillations of STars) space telescope, launched in 2003, is the first satellite dedicated to asteroseismic observations from space. MOST houses a 15 cm telescope, with observations performed through a custom broad-band filter (350–700 nm). It is positioned in a sun-synchronous low-Earth orbit, enabling it to continuously monitor stars for up to three months. For a detailed description of the instrument, we refer to Walker et al. (2003).
Guenther et al. (2008) presented the results of the MOST 2007 campaign. The data are the most precise MOST Procyon photometry to date, outperforming the previous runs in both length (38.5 d) and time-series point-to-point scatter (140 ppm), and consequently also in high-frequency noise (0.9 ppm). While the power spectrum showed an excess in the expected oscillation frequency range and an autocorrelation of the spectrum yielded strong evidence for the expected characteristic large frequency separation () of 55Hz, no reliable individual mode frequencies could be extracted. Using various common and new frequency extraction tools, Guenther et al. (2008) found that no consistent regularly spaced frequencies could be identified unless it was assumed that the mode lifetimes are 2 days, i.e. slightly less than solar (see, e.g., Chaplin et al., 2009). The large scatter of the extracted frequencies around the predicted regularity (5 Hz) was found to be consistent with the scatter of the frequency identifications from previous radial velocity campaigns. Using new numerical convection models Guenther et al. (2008) argued that, contrary to the Sun, the granulation timescale in Procyon is similar to the timescale of the p-mode oscillations. This was identified as a possible reason for the short mode lifetimes in Procyon and the consequent difficulty of extracting consistent frequencies from the MOST 2007 data.
2.2. Ground-based radial velocity campaign
The 2007 ground-based radial velocity (RV) campaign was described in detail by Arentoft et al. (2008) and included 11 telescopes, with apertures ranging from 0.6 to 3.9 m, at eight observatories. Covering a total length of 25 days, with a duty cycle above 90% for the central 10 days of observations, it is the most precise and complete radial-velocity campaign dedicated to asteroseismology to date.
Arentoft et al. (2008) reported the detection of slow variations in the velocity timeseries with an apparent period of 10 d, which they attributed to rotational modulation of active regions on the surface of the star. A possible rotation period of Procyon of 10 d or twice that value was suggested, with the latter scenario being more likely if it is assumed that the rotation axis is aligned with the known inclination of the binary orbit. Arentoft et al. (2008) also provided an estimate of the mean mode amplitude between of 38.11.3 cm s-1, consistent with previously reported detections and upper limits.
A detailed asteroseismic analysis of the RV data was presented by Bedding et al. (2010). The continuous coverage and high S/N allowed the first measurements of mode frequencies in Procyon. These authors also measured large and small frequency separations as a function of frequency and identified a possible mixed mode at 446 Hz. They used the variation of peak amplitudes caused by the stochastic nature of the oscillations to estimate the mode lifetimes in Procyon to be 1.30.5 d. As a result of the large linewidths of the modes, however, a major difficulty in the analysis was the identification of modes with even and odd spherical degree . Bedding et al. (2010) gave several arguments for the most probable mode identification but left open the possibility that the identification could be reversed.
3. Slow variations
The Procyon MOST photometry provides the opportunity to further investigate the nature of the slow variations detected in radial velocity. The stability and continuity of MOST photometry has previously been successfully used to study activity in several stars (Croll et al., 2006; Walker et al., 2007).
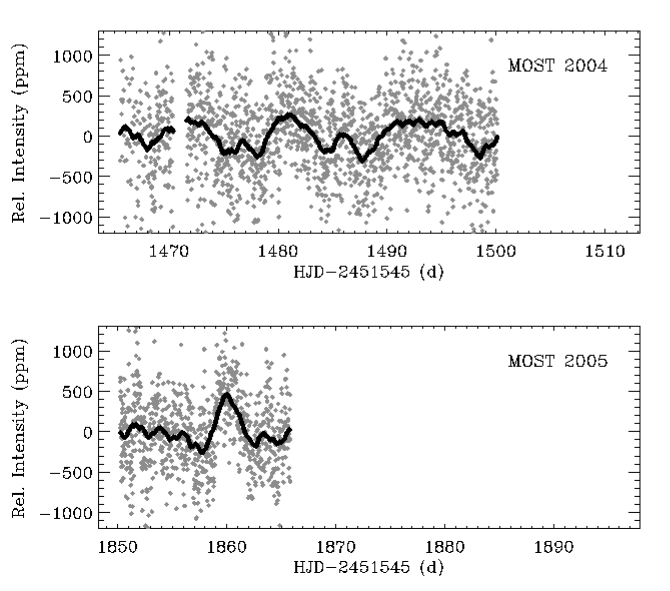
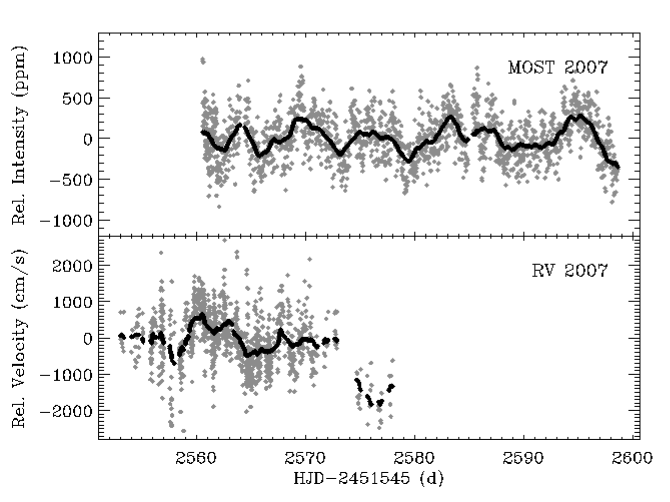
The analysis by Guenther et al. (2008) was based on a high-pass filtered MOST light curve to focus on the detection of solar-like oscillations. Here, we use the raw light curve, as produced by the reduction pipeline described in Reegen et al. (2006), as the starting point of our analysis. As discussed by Huber et al. (2009b) for another solar-like star observed by MOST (85 Peg) the reduced photometry sometimes shows long-periodic instrumental variability that can be identified and corrected by decorrelating satellite telemetry data, such as board and preamplifier temperatures, against the observed target intensities. We applied the same technique to the 2004, 2005 and 2007 photometry of Procyon and the resulting detrended light curves are shown in Figure 1.
The intensity and velocity curves in Figure 1 show similar variability in all datasets. The most prominent periodicity in the velocities, with a period of 10 days, is not readily apparent in the 2007 MOST photometry, which shows the strongest signal as measured from the amplitude spectrum with a period of 6 days. However, as is well known for the Sun and demonstrated by Clarke (2003) for models of spotted stars, the relationship between simultaneous velocity and intensity observations of active regions is not simple and strongly depends on parameters such as rotational velocity, inclination and spot size. Detailed modeling of the variations using the overlapping parts of the dataset ( 10 days) is beyond the scope of this paper, but we make some qualitative statements on the variability based on the observed low frequency power levels.
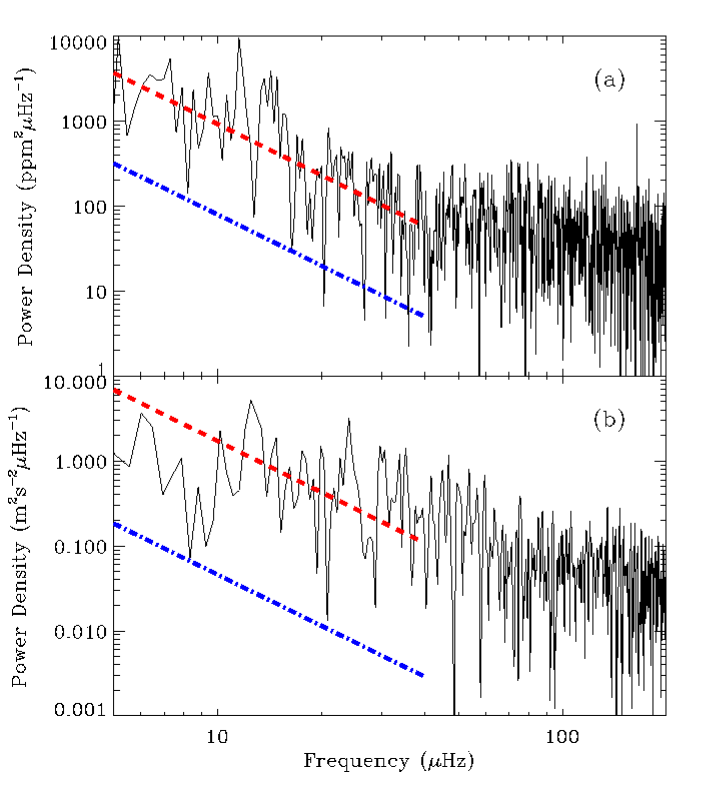
To compare both datasets independent of length and sampling, we converted the power spectra to power density by multiplying with the effective length of each dataset (calculated as the inverse of the area under the spectral window in power). Figure 2 shows the low-frequency power density level measured in Procyon in intensity (upper panel) and velocity (lower panel) using the full length of both datasets obtained in 2007. To measure the low frequency power density level, we fitted power laws with a fixed slope of 2 in the frequency interval 5–40 Hz (red dashed lines). For comparison, the blue dashed-dotted lines show the average power density level of the Sun during solar maximum derived using the same method with 30 d subsets of data obtained in intensity by VIRGO (Fröhlich et al., 1997) and in velocity by GOLF (Ulrich et al., 2000; García et al., 2005), both of which are instruments onboard the SOHO spacecraft. Note that we have corrected the photometric power density for the spectral response of the MOST filter following the method of Michel et al. (2009), yielding using an effective temperature of = 6500 K for Procyon, compared to for solar VIRGO observations in the green channel.
As noted by Arentoft et al. (2008), the Procyon velocity power spectrum shows a similar 1/ dependence as observed for the Sun but at higher power density levels, and the same is observed in the photometry. Is the observed excess of photometric power density, measured relative to the Sun, consistent with the velocity observations? To investigate this, we used SOHO data spanning from 1996 to 2004 and measured the low frequency power density levels in independent 30 d subsets as described above throughout the solar activity cycle. The ratios of the observed levels between Procyon and the Sun for each subset are shown in Figure 3(a).
We observe that the power density ratio between Procyon and the Sun is substantially higher in velocity than in photometry. Arentoft et al. (2008) argued that the velocity power density at frequency is expected to scale as follows:
| (1) |
where is the fractional area covered by active regions, the projected rotational velocity, and the typical lifetime of active regions on the stellar surface.
Similarly, the amplitude measured in photometry will be proportional to and the luminosity variation caused by the flux contrast between the unspotted and spotted areas of the star (see, e.g., Dorren, 1987). We can therefore rewrite Equation (1) for the case photometric power densities as:
| (2) |
We note that Equation (2) is only intended to give an approximate estimation of the photometric power density due to stellar activity. Compared to detailed photometric spot models (see, e.g. Dorren, 1987; Lanza et al., 2003; Mosser et al., 2009), Equation (2) for example does not include an explicit dependence on stellar inclination. As shown by Mosser et al. (2009), this corresponds to neglecting any information about the latitude of active regions (i.e., we assume in Equation (2) that it is equally likely to observe spots near the equator or near the poles). While this is certainly not the case for the Sun, this information is also neglected in Equation (1) (e.g., an active region at on a star with will cause no velocity variation). Since we are here only interested in comparing the ratio of velocity to photometry variations, any explicit dependence on the latitude of active regions will therefore cancel out.
Equations (1) and (2) imply that the difference between the velocity and photometry power density ratio of two stars depends only on and . We assume that the ratio in (and hence the flux contrast) between Procyon and the Sun is negligible compared to the ratio in , which is supported by detailed spot modeling of stars hotter than the Sun (Lanza et al., 2009, 2011). Using km s-1 for the Sun and km s-1 for Procyon (Allende Prieto et al., 2002), this therefore implies a difference in the velocity and photometry power density ratios by a factor of . The red dashed-dotted line in Figure 3(a) shows the photometric power density ratio multiplied by this value. We observe that the power density ratios are now in better agreement, both during solar minimum (in 1996) and solar maximum (in 2002). This result implies that the observed variations of Procyon in both datasets are qualitatively in agreement with being the signature of stellar activity.
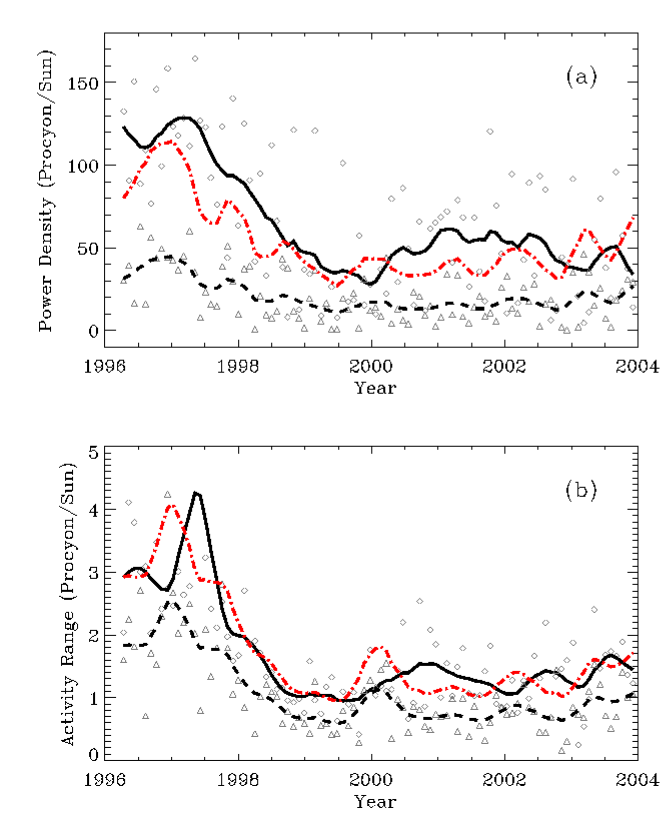
The scatter of individual datapoints in Figure 3(a) is large, presumably due to the complex non-sinusoidal variations of stellar activity causing large variations in low frequency power density fits. We have therefore repeated the above exercise using the activity range as defined in Basri et al. (2010), which measures the maximum absolute deviation of the time series with respect to its mean. The results of this are shown in Figure 3(b). In this case, the scaling factor is expected to be . Again, the scaled photometric ratios are in reasonable agreement with the velocity ratios, confirming the results derived using power densities.
4. Solar-like oscillations
4.1. Comparison of power spectra
Figure 4 compares the power spectra of both full 2007 datasets in the frequency range where p modes have been detected. We used the sidelobe-optimized power spectrum for the velocities, as described by Bedding et al. (2010), and the high-pass filtered MOST data used by Guenther et al. (2008). Note that the funnels of low power around the orbital harmonics of MOST (marked as dashed lines) are due to the high-pass filter removing power leaking from low frequencies, which in turn is caused by periodic outlier rejections in the data reduction pipeline during high-straylight phases. To smooth over the effects caused by the stochastic nature of the oscillations, we convolved both spectra with a Lorentzian profile with a width of 2.5Hz, corresponding to a mode lifetime of 1.5 d. We also show with dotted lines the values for the odd and even ridge centroids determined by Bedding et al. (2010) for the velocity data (see their Figure 9). Note that although our adopted value for the mode lifetime is larger than measured for other F-stars such as HD 49933 (Gruberbauer et al., 2009; Benomar et al., 2009), the exact choice of this value has no influence on the results presented below.
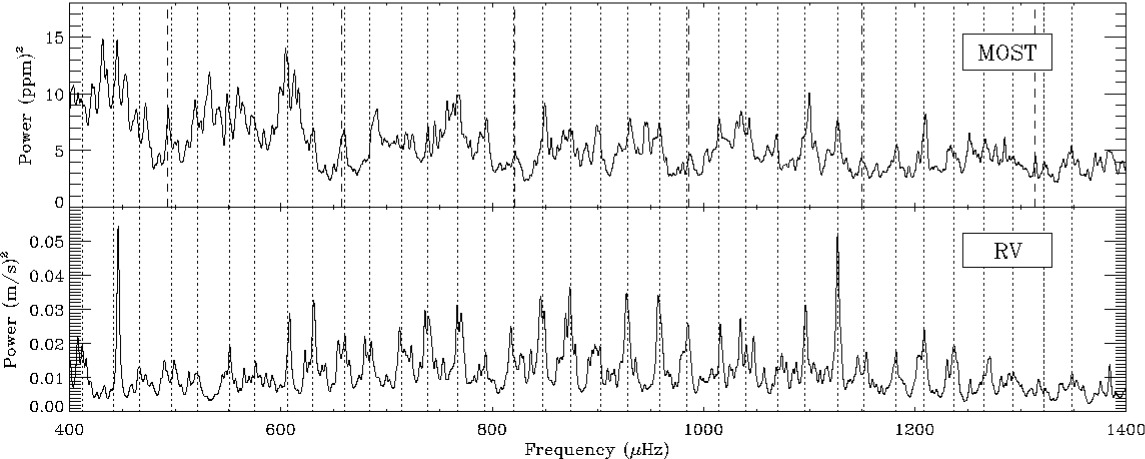
The comparison shows clearly that most of the peaks in the MOST spectrum coincide with pulsation frequencies identified in the velocity power spectrum. The agreement improves considerably towards high frequencies (Hz), where the granulation background in photometry becomes lower, as can be seen by the steady decrease of power towards high frequencies (see also Section 4.3). We also see that, unluckily, several of the intrinsic pulsation frequencies of Procyon near maximum power coincide almost exactly with harmonics of the orbital frequency of the MOST satellite.
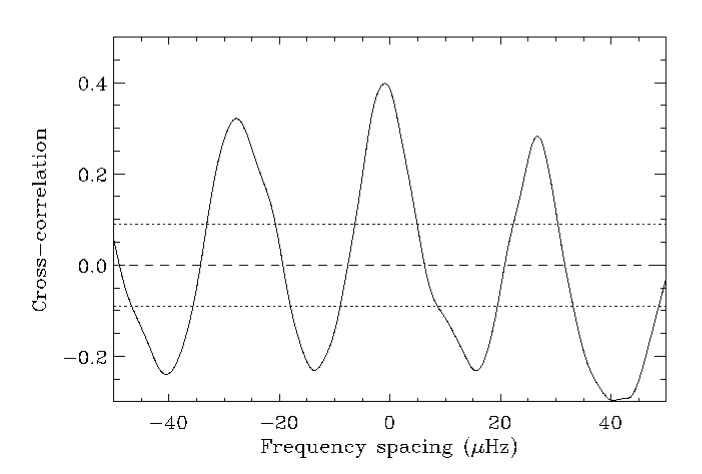
To investigate the agreement between the two spectra in more detail, we calculated a cross-correlation of the two power spectra in the central region of maximum power from 650-1150Hz. The result is shown in Figure 5. As expected, we see clear maxima at zero offset and at half the large frequency separation. Note that the shift of the highest peak from zero offset is only 0.9 Hz, which is much smaller than the lifetime of the modes and therefore insignificant. To test the significance of the peak height, we correlated the RV power spectrum with MOST power spectra calculated from 2000 white noise time series with the same sampling and scatter as the original dataset. The resulting distribution at zero offset showed a mean of zero and a standard deviation of 0.09, which is indicated as dashed and dotted lines in Figure 5. At a level of , these results confirm that the peaks observed in the MOST power spectrum very likely correspond to the oscillations observed in the radial velocity data.
4.2. Échelle diagrams and folded power spectra
A widely used method to analyze the regular frequency pattern characterizing solar-like oscillations is to stack the power spectrum (or extracted frequencies) in slices of the large frequency separation , forming a so-called échelle diagram (Grec et al., 1983). Note that throughout the paper we use , which corresponds to the large separation at maximum power as identified in the RV data (see Figure 11(a) in Bedding et al., 2010). The left and middle panel of Figure 6 show échelle diagrams of both power spectra smoothed to the same frequency resolution. Note that the MOST power spectrum has been corrected for the background contribution due to granulation and activity (see Section 4.3). The échelle diagrams clearly show two ridges corresponding to modes of odd and even degree in both datasets. The similarity of the curvature of both ridges (and hence the variation of with frequency) in both individual datasets reaffirms our conclusion that the peaks seen in Figure 4 are intrinsic p modes. The échelle diagrams also show that the higher low-frequency noise in the photometry makes it harder to detect p modes below Hz than in the velocity data.
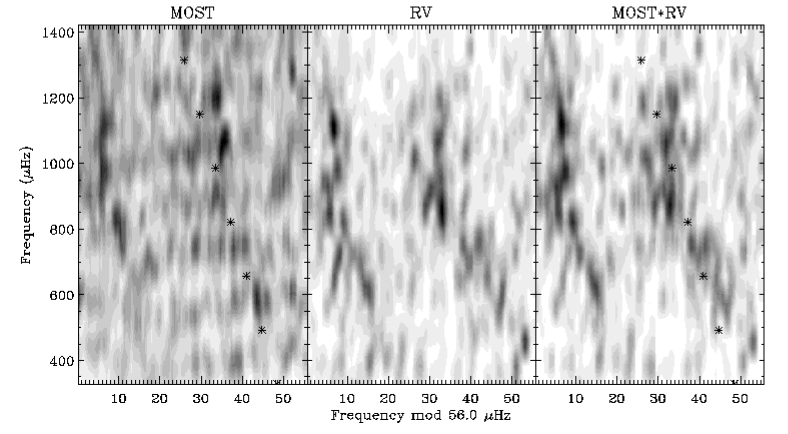
In addition to the MOST and RV datasets, we also analyzed a power spectrum constructed by multipliying both individual power spectra. This corresponds to a power spectrum of the convolution of the MOST and RV timeseries, combining the advantage of the higher frequency resolution of the MOST data with the higher S/N of the RV data. The resulting échelle diagram displayed in the right panel of Figure 6 clearly shows more well-defined ridges than the corresponding diagrams using the individual datasets.
Having confirmed that we have detected the ridges in both datasets, an obvious step in the analysis is to attempt to confirm or discard the ridge identification presented in Bedding et al. (2010) using the MOST data. It is well known that observations in intensity are less sensitive to pulsation modes of higher spherical degree than velocity measurements. We therefore expect ridges observed in photometry to be shifted to higher frequencies in the échelle diagram than in velocity, with the amount of shifting depending on the ridge identification. Calculations based on the theoretical response functions by Kjeldsen et al. (2008) and the frequency values presented in Bedding et al. (2010), however, showed that the expected shift is only of the order of 1 Hz, too small to be detected with the current uncertainties.
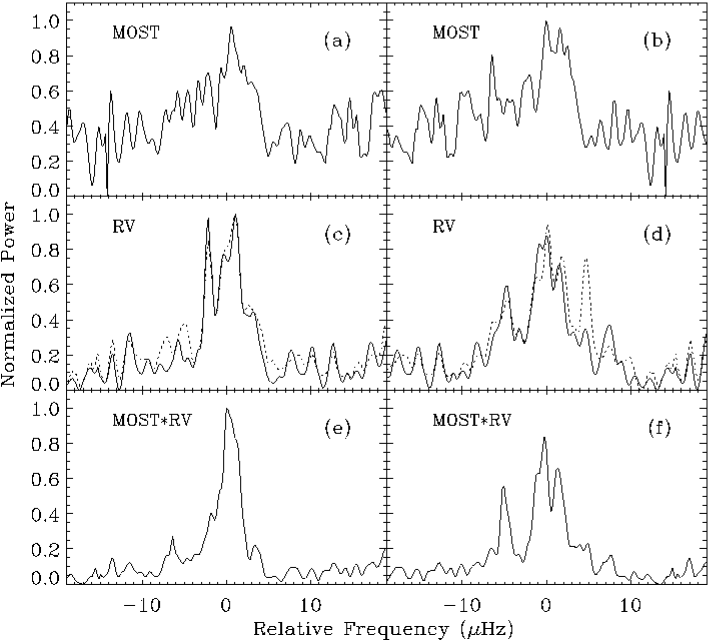
Another possibility to search for ridge asymmetries is to increase the S/N by collapsing the échelle diagram over several orders. To do so, we calculated the ridge centroids for the MOST data in the same manner as done by Bedding et al. (2010) for the radial velocities. Using the ridge centroids calculated for the MOST data, we straightened each order by removing the curvature seen in the échelle diagram before collapsing the échelle diagram in the frequency range where the centroids were reliably determined (700–1300 Hz). Figure 7 shows a comparison with the analogous procedure for the velocity power spectrum (see Figure 10 in Bedding et al., 2010) as well as for the product of the MOST and radial velocity power spectrum. Note that the ridge centroids have been calculated for each of the three power spectra individually since, as explained above, it is expected that the ridge positions are slightly different for each dataset. While the two ridges are clearly detected in the MOST photometry (top panels), the S/N is too low to make any firm conclusion about the possible presence of separated ridges (i.e. and ), as is the case for the RV data (middle panels). We note, however, that the collapsed power spectrum of the combined data (bottom panels) might show some evidence for separated and components in the right-hand-side ridge. This would imply Scenario A, which is opposite to that preferred by Bedding et al. (2010) but in agreement with the results of Bayesian model comparisons using the RV data (Bedding et al., 2010; Handberg & Campante, 2011). A more detailed analysis including the extraction of individual frequencies from the combined data and a comparison with pulsation models will be presented in a forthcoming paper (T. Kallinger et al., in preparation).
4.3. Oscillation amplitudes
4.3.1 Amplitude Ratios
The simultaneous observing campaigns allow us to measure the ratio of oscillation amplitudes in photometry and velocity and therefore test theoretical values and the scaling relations introduced by Kjeldsen & Bedding (1995). The following influences have to be considered when measuring amplitudes of solar-like oscillations:
-
(i)
Systematic variations due to the stellar cycle effects
-
(ii)
Variations due to stochastic excitation and damping of the oscillation signal
-
(iii)
Measurement errors due to background subtraction
Since both datasets have been obtained within a timespan of less than 60 days, effects arising from (i) can be safely ignored here. To measure amplitudes in a way that is largely insensitive to point (ii), we convolved the power spectrum with a Gaussian with FWHM = 4 and scaled the signal to the contribution of radial modes in each order (Kjeldsen et al., 2008). Note that for the factor , which measures the effective number of modes per order, we have interpolated the values listed in Table 1 of Kjeldsen et al. (2008) to the central wavelength of the MOST filter (525 nm), yielding .
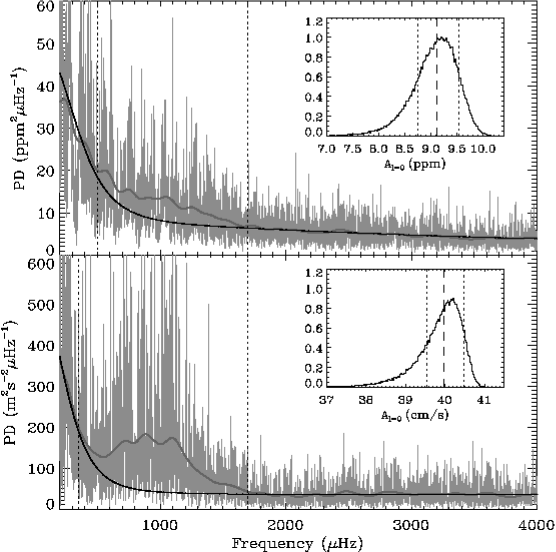
A crucial precondition to estimate the amplitude, particularly at low S/N, is to properly correct for the background contribution arising from stellar granulation and activity. In order to reliably estimate the uncertainty of the background parameters, we have used a combination of two published methods. An initial least-squares fit using the method of Huber et al. (2009a) was used as a starting point for a more careful fitting procedure using a Bayesian Markov-Chain Monte-Carlo (MCMC) algorithm, as described in Gruberbauer et al. (2009) and Kallinger et al. (2010). The fitted model was adopted from Karoff (2008) and has the form:
| (3) |
where is the white noise component, is the number of power laws used and and are the rms intensity and timescale of granulation, respectively. Note that in our application for Procyon, .
The determination of the resulting background and corresponding amplitude was done in two steps:
-
1)
We excluded the region of the power spectrum which contains oscillation signal and ran the Bayesian MCMC algorithm only on the remaining power spectrum. The excluded region was determined by visual inspection of heavily smoothed power spectra (see Figure 8), and we verified through several trial MCMC runs that changing this region within reasonable limits does not significantly influence the results. We used uniform priors for the granulation timescales and Jeffreys priors for the amplitudes of the background components. The most probable background model was then determined as the median of the marginalized posterior distributions for each background parameter.
-
2)
Since the amplitude is not implicitly defined as a model parameter that is fitted to the data, we determined the pulsation amplitude as the mean level of the smoothed power spectrum in frequency range 650–1150 Hz after subtracting the background. This step was done for each MCMC iteration, and the final amplitude was then evaluated as the median and 1- confidence limits of the resulting amplitude distribution.
Figure 8 shows the background fits resulting from 10 independent MCMC chains, each with iterations, for the full MOST and radial velocity datasets. The distributions for the mean amplitude over the range of 650–1150 Hz (after subtracting the background signal) yields ppm for the MOST data and cm-1 s for the velocity data. Hence, we arrive at a mean amplitude ratio for the full datasets of ppm cm-1 s.
As shown by Kjeldsen et al. (2008) for the Sun, short mode lifetimes can cause considerable variations even after heavily smoothing the oscillation envelope. To test these effects, we employed a similar approach as Arentoft et al. (2008) and subdivided the MOST data into five independent subsets of equal length ( d). Note that this subset length is considerably longer than the 10 individual 2 d subsets used by Arentoft et al. (2008) for the radial velocity data since the signal in photometry is lower, requiring longer sets to achieve a sufficiently high signal for an amplitude determination. The resulting smoothed curves, which were corrected for a background fit calculated using MCMC iterations for each subset, together with their mean value are shown in Figure 9(a). Using the central region of maximum power between 650-1150 Hz, we derived a mean amplitude of ppm, in very good agreement with the value derived using the full dataset above. In order to compare this photometric value to a velocity amplitude derived using the same method, we combine it with the estimate for the radial velocity amplitude given by Arentoft et al. (2008) as cm-1 s. This yields an amplitude ratio, measured using subsets, of ppm cm-1 s, again in good agreement with the value derived from the full datasets.
A few points need to be considered when evaluating the quoted values and uncertainties. Firstly, the fact that the uncertainty on derived from the full dataset is considerably lower than the value derived by Arentoft et al. (2008) shows that for high S/N data the influence of stochastic excitation (see point (ii) above) dominates the amplitude uncertainty over the uncertainty arising from the background determination (see point (iii) above). For the MOST data on the other hand, both uncertainties are roughly the same. To ensure a conservative approach, we therefore opted to use the amplitude ratio determined using subsets, ppm cm-1 s, as our final value of the mean amplitude ratio.
Secondly, the amplitude ratios do not include any uncertainties arising from the factors used to normalize the amplitude per radial mode. First observational constraints on photometric mode visibility ratios by Deheuvels et al. (2010) suggest differences of up to 25% compared to theoretical responses used by Kjeldsen et al. (2008). These differences could be caused by uncertainties in the limb-darkening laws used to calculate theoretical response functions, but also intrinsic differences in amplitudes of different degrees. We will assume that the latter cancel out in the photometry to velocity ratio, and therefore only concentrate on the mode visibilities. We repeated the calculations of by numerically integrating the spatial response functions for a quadratic limb-darkening law for the Sun (Bedding et al., 1996) assuming a conservative absolute uncertainty of 0.05 (corresponding to a relative uncertainty of 10–20%) for each limb-darkening coefficient (Howarth, 2010). The resulting factors after 1000 integrations yield an uncertainty of 4% in velocity and 6% in photometry, which translates into uncertainties of 2% and 3% in the normalized amplitudes, and hence an uncertainty of 4% in the amplitude ratio. This test shows that the uncertainty on can be substantial for estimating amplitude ratios, in particular for observations with high S/N and long mode lifetimes as found in red giant stars (De Ridder et al., 2009). In our case, however, the amplitude ratio is dominated by the 8% uncertainty arising from the background fits and finite mode lifetimes.
4.3.2 Comparison with Theoretical Results
How do our estimates for the amplitude ratio compare with scaling relations? Rearranging equation (5) in Kjeldsen & Bedding (1995) yields
| (4) |
with if the oscillations are adiabatic, and a best-fitting value of for observed amplitudes in classical pulsators (see Kjeldsen & Bedding, 1995).
Using , = 6500 K and a wavelength nm, the expected amplitude ratio for radial modes is 0.17 ppm cm-1 s. As shown by the dotted line in Figure 9(d), this is considerably lower than the observed ratio. Using the agreement is only slightly better, with an expected ratio of 0.18 ppm cm-1 s. Since the radial velocity amplitude is in agreement with the value from scaling relations (see Arentoft et al., 2008), this implies that the MOST amplitude is higher than expected.
Going one step further, the smoothed amplitude curves allow us to analyze the amplitude ratio as a function of frequency. Figure 9(d) shows the ratio of the amplitude curves derived from the full datasets for MOST and the RV data, which are shown separately in Figure 9(b) and 9(c). Note that we have scaled the uncertainty of the RV amplitude curve to match the relative uncertainty derived using subsets, as described in the previous section. We also repeated the calculation using only HARPS data from the RV dataset, and restricted the MOST data to the same timespan ( 6.5 d). The result was almost identical to the result based on the full dataset but with larger uncertainty.
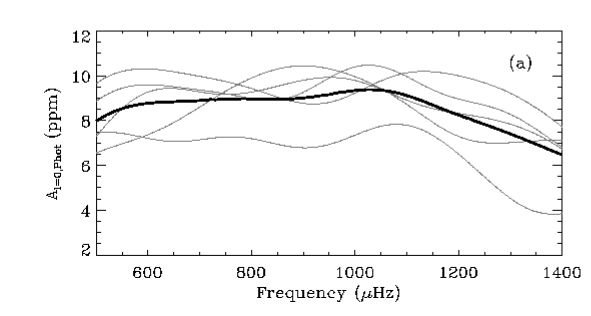

Figure 9(e) compares the amplitude ratio as a function of frequency with theoretical predictions by Houdek (2010) for a model of Procyon for different model atmospheres and different heights above the photosphere. Although the exact shape of the variation as a function of frequency is not well recovered, we note that the average amplitude ratio at maximum power () is in better agreement with models than the estimate based on scaling relations (dotted line). A more detailed comparison will have to await the collection of higher S/N data from which amplitudes of individual mode frequencies can be reliably extracted.
It is interesting to note that, as can be seen from Figures 6, 8, 9(b) and 9(c), the maximum of the oscillation envelope in photometry seems to be shifted to slightly higher frequencies than in velocity. Defining as the frequency corresponding to the maximum of the smoothed oscillation envelope, the MCMC analysis of the full datasets yields , compared to . This shift translates into an increase of the amplitude ratio as a function of frequency, which tentatively can be identified in Figure 9(d).
5. Conclusions
We have compared simultaneous space-based MOST photometry and ground-based radial velocity data of the F5 star Procyon. Our main findings can be summarized as follows:
-
•
The MOST light curves of 2004, 2005 and 2007 show slow variations similar to those observed in velocity. A comparison of the variability level in photometry and velocity to the Sun confirmed that these variations are compatible with stellar activity on Procyon.
-
•
The peaks observed in the MOST 2007 power spectrum match the oscillation frequencies detected in the radial velocity campaign, and the échelle diagrams shows similar structure and curvature. We have attempted to confirm the mode ridge identification presented by Bedding et al. (2010) by collapsing power spectra corrected for curvature. While the MOST data alone do not provide conclusive results, the collapsed échelle diagram of the combined datasets shows some evidence that scenario A in Bedding et al. (2010) is the correct mode identification, contradicting the conclusions of that paper. Further work based on the extraction of individual frequencies from the combined data and a comparison with stellar models will be necessary to confirm this result.
-
•
We measured the mean luminosity amplitude per radial mode in Procyon in the frequency range 650–1150 Hz to be ppm, in agreement with the value of ppm published by Bruntt et al. (2005). Combining this with the mean velocity amplitude measured by Arentoft et al. (2008) gives an amplitude ratio of ppm cm-1 s. This is considerably higher than the value of 0.17 ppm cm-1 s expected from scaling from the Sun, but is in better agreement with theoretical values predicted by Houdek (2010). We also analyzed the amplitude ratio as a function of frequency and found that the maximum of the oscillation envelope appears to be shifted to higher frequencies in photometry than in velocity.
The results presented here illustrate the potential of combining simultaneous luminosity and velocity measurements to study pulsations in stars. Future opportunities may arise from combining measurements from the ground-based radial-velocity network SONG (Grundahl et al., 2008) with space-based photometry by MOST and BRITE (Weiss et al., 2008), which will mark an important step in studying stellar structure and evolution in bright stars with well-known fundamental parameters.
References
- Allende Prieto et al. (2002) Allende Prieto, C., Asplund, M., García López, R. J., & Lambert, D. L. 2002, ApJ, 567, 544
- Arentoft et al. (2008) Arentoft, T., et al. 2008, ApJ, 687, 1180
- Barban et al. (1999) Barban, C., et al. 1999, in Astronomical Society of the Pacific Conference Series, Vol. 185, IAU Colloq. 170: Precise Stellar Radial Velocities, ed. J. B. Hearnshaw & C. D. Scarfe, 177
- Basri et al. (2010) Basri, G., et al. 2010, ApJ, 713, L155
- Baudin et al. (2008) Baudin, F., Appourchaux, T., Boumier, P., Kuschnig, R., Leibacher, J. W., & Matthews, J. M. 2008, A&A, 478, 461
- Bedding et al. (1996) Bedding, T. R., Kjeldsen, H., Reetz, J., & Barbuy, B. 1996, MNRAS, 280, 1155
- Bedding et al. (2005) Bedding, T. R., et al. 2005, A&A, 432, L43
- Bedding et al. (2010) —. 2010, ApJ, 713, 935
- Benomar et al. (2009) Benomar, O., et al. 2009, A&A, 507, L13
- Bouchy et al. (2004) Bouchy, F., Maeder, A., Mayor, M., Mégevand, D., Pepe, F., & Sosnowska, D. 2004, Nature, 432, 2
- Brown et al. (1991) Brown, T. M., Gilliland, R. L., Noyes, R. W., & Ramsey, L. W. 1991, ApJ, 368, 599
- Bruntt et al. (2005) Bruntt, H., Kjeldsen, H., Buzasi, D. L., & Bedding, T. R. 2005, ApJ, 633, 440
- Chaplin et al. (2009) Chaplin, W. J., Houdek, G., Karoff, C., Elsworth, Y., & New, R. 2009, A&A, 500, L21
- Clarke (2003) Clarke, D. 2003, A&A, 407, 1029
- Claudi et al. (2004) Claudi, R. U., et al. 2004, Communications in Asteroseismology, 145, 53
- Croll et al. (2006) Croll, B., et al. 2006, ApJ, 648, 607
- De Ridder et al. (2009) De Ridder, J., et al. 2009, Nature, 459, 398
- Deheuvels et al. (2010) Deheuvels, S., et al. 2010, A&A, 515, A87
- Dorren (1987) Dorren, J. D. 1987, ApJ, 320, 756
- Eggenberger et al. (2004) Eggenberger, P., Carrier, F., Bouchy, F., & Blecha, A. 2004, A&A, 422, 247
- Fröhlich et al. (1997) Fröhlich, C., et al. 1997, Sol. Phys., 170, 1
- García et al. (2005) García, R. A., et al. 2005, A&A, 442, 385
- Gelly et al. (1986) Gelly, B., Gree, G., & Fossat, E. 1986, A&A, 164, 383
- Gilliland et al. (2010) Gilliland, R. L., et al. 2010, PASP, 122, 131
- Grec et al. (1983) Grec, G., Fossat, E., & Pomerantz, M. A. 1983, Sol. Phys., 82, 55
- Gruberbauer et al. (2009) Gruberbauer, M., Kallinger, T., Weiss, W. W., & Guenther, D. B. 2009, A&A, 506, 1043
- Grundahl et al. (2008) Grundahl, F., Christensen-Dalsgaard, J., Kjeldsen, H., Frandsen, S., Arentoft, T., Kjaergaard, P., & Jørgensen, U. G. 2008, in IAU Symposium, Vol. 252, IAU Symposium, ed. L. Deng & K. L. Chan, 465–466
- Guenther et al. (2007) Guenther, D. B., et al. 2007, Communications in Asteroseismology, 151, 5
- Guenther et al. (2008) —. 2008, ApJ, 687, 1448
- Handberg & Campante (2011) Handberg, R., & Campante, T. L. 2011, A&A, 527, A56
- Houdek (2010) Houdek, G. 2010, Ap&SS, 328, 237
- Howarth (2010) Howarth, I. D. 2010, arXiv:1011.2631
- Huber et al. (2009a) Huber, D., Stello, D., Bedding, T. R., Chaplin, W. J., Arentoft, T., Quirion, P., & Kjeldsen, H. 2009a, Communications in Asteroseismology, 160, 74
- Huber et al. (2009b) Huber, D., et al. 2009b, A&A, 505, 715
- Innis et al. (1991) Innis, J. L., Isaak, G. R., Speake, C. C., Williams, H. K., & Brazier, R. I. 1991, MNRAS, 249, 643
- Kallinger et al. (2010) Kallinger, T., et al. 2010, A&A, 509, A77
- Karoff (2008) Karoff, C. 2008, PhD thesis, Department of Physics and Astronomy, University of Aarhus
- Kjeldsen & Bedding (1995) Kjeldsen, H., & Bedding, T. R. 1995, A&A, 293, 87
- Kjeldsen et al. (2008) Kjeldsen, H., et al. 2008, ApJ, 682, 1370
- Lanza et al. (2003) Lanza, A. F., Rodonò, M., Pagano, I., Barge, P., & Llebaria, A. 2003, A&A, 403, 1135
- Lanza et al. (2009) Lanza, A. F., et al. 2009, A&A, 493, 193
- Lanza et al. (2011) —. 2011, A&A, 525, A14
- Leccia et al. (2007) Leccia, S., Kjeldsen, H., Bonanno, A., Claudi, R. U., Ventura, R., & Paternò, L. 2007, A&A, 464, 1059
- Libbrecht (1988) Libbrecht, K. G. 1988, in IAU Symposium, Vol. 132, The Impact of Very High S/N Spectroscopy on Stellar Physics, ed. G. Cayrel de Strobel & M. Spite, 83
- Marchenko (2008) Marchenko, S. V. 2008, A&A, 479, 845
- Martić et al. (2004) Martić, M., Lebrun, J., Appourchaux, T., & Korzennik, S. G. 2004, A&A, 418, 295
- Martić et al. (1999) Martić, M., et al. 1999, A&A, 351, 993
- Matthews (2007) Matthews, J. M. 2007, Communications in Asteroseismology, 150, 333
- Matthews et al. (2004) Matthews, J. M., Kusching, R., Guenther, D. B., Walker, G. A. H., Moffat, A. F. J., Rucinski, S. M., Sasselov, D., & Weiss, W. W. 2004, Nature, 430, 51
- Michel et al. (2009) Michel, E., Samadi, R., Baudin, F., Barban, C., Appourchaux, T., & Auvergne, M. 2009, A&A, 495, 979
- Michel et al. (2008) Michel, E., et al. 2008, Science, 322, 558
- Mosser et al. (2009) Mosser, B., Baudin, F., Lanza, A. F., Hulot, J. C., Catala, C., Baglin, A., & Auvergne, M. 2009, A&A, 506, 245
- Mosser et al. (1998) Mosser, B., Maillard, J. P., Mekarnia, D., & Gay, J. 1998, A&A, 340, 457
- Reegen et al. (2006) Reegen, P., et al. 2006, MNRAS, 367, 1417
- Régulo & Roca Cortés (2005) Régulo, C., & Roca Cortés, T. 2005, A&A, 444, L5
- Ulrich et al. (2000) Ulrich, R. K., et al. 2000, A&A, 364, 799
- Walker et al. (2003) Walker, G., et al. 2003, PASP, 115, 1023
- Walker et al. (2007) Walker, G. A. H., et al. 2007, ApJ, 659, 1611
- Weiss et al. (2008) Weiss, W. W., Moffat, A. F. J., & Kudelka, O. 2008, Communications in Asteroseismology, 157, 271