The Dirt on Dry Mergers
Abstract
Using data from the Spitzer Space Telescope, we analyze the mid-infrared (3-70 ) spectral energy distributions of dry merger candidates in the Boötes field of the NOAO Deep Wide-Field Survey. These candidates were selected by previous authors to be luminous, red, early-type galaxies with morphological evidence of recent tidal interactions. We find that a significant fraction of these candidates exhibit 8 and 24 excesses compared to expectations for old stellar populations. We estimate that a quarter of dry merger candidates have mid-infrared-derived star formation rates greater than 1 M⊙ yr-1. This represents a “frosting” on top of a large old stellar population, and has been seen in previous studies of elliptical galaxies. Further, the dry merger candidates include a higher fraction of starforming galaxies relative to a control sample without tidal features. We therefore conclude that the star formation in these massive ellipticals is likely triggered by merger activity. Our data suggest that the mergers responsible for the observed tidal features were not completely dry, and may be minor mergers involving a gas-rich dwarf galaxy.
Subject headings:
galaxies: active — galaxies: evolution — galaxies: formation — infrared: galaxies1. Introduction
In hierarchical models of galaxy formation, massive galaxies form via mergers of smaller galaxies. Thus, the most massive galaxies, which tend to be ellipticals, should have formed most recently (; e.g. White & Frenk 1991; Cole et al. 2000). In seeming contrast with this picture, studies of the stellar populations and scaling relations in samples of elliptical galaxies imply that the bulk of their stars formed significantly earlier, at (e.g. Djorgovski & Davis 1987; Bower et al. 1992; Bender et al. 1993; Kuntschner 2000; Eisenhardt et al. 2008). This discrepancy can be resolved if massive ellipticals form via dissipationless mergers of red, bulge-dominated galaxies at low redshift. These mergers would involve little to no gas, and are colloquially referred to as “dry” mergers.
Hierarchical scenarios in which a significant fraction of massive elliptical galaxies formed via dry mergers have been presented in a number of theoretical works (e.g. Kauffmann & Haehnelt 2000; Khochfar & Burkert 2003; Khochfar & Silk 2009; De Lucia & Blaizot 2007). The observational evidence is mixed, with both supporting (e.g. van Dokkum et al. 1999; Bell et al. 2004, 2005, 2006; van Dokkum 2005; Tran et al. 2005; Brown et al. 2008) and contradictory (Cimatti et al. 2006; Scarlata et al. 2007; Donovan et al. 2007) studies.
In this paper, we focus on the study of van Dokkum (2005) (hereafter vD05), who analyzed the frequency of tidal distortions among an optically-selected sample of nearby () bright red galaxies. He found that 53% of the entire color-selected sample shows morphological evidence of tidal interactions. Further, this ratio rises to 71% when considering only the bulge-dominated early-type galaxies in the sample. vD05 concludes that the majority of today’s most luminous field elliptical galaxies were assembled at low redshift through major dry mergers.
However, N-body simulations of binary galaxy mergers analyzed by Feldmann et al. (2008) show that the morphologies of the tidal features seen in the vD05 sample cannot be reproduced by major dry mergers. Instead, the observations are better explained by massive elliptical galaxies accreting much lower mass disk-dominated galaxies. They also find that tidal features arising from disk accretion events last significantly longer than major elliptical-elliptical dry mergers (1-2 Gyr compared to a few hundred million years). This pushes the primary epoch of elliptical mass assembly back to . These simulations do not include gas. However, if the mass of the accreted galaxy is small, and the lifetime of the tidal signatures is large, then Feldmann et al. (2008) estimate that any stars formed during the interaction could have reddened with age sufficiently to match the observed colors. In a complementary study, Kawata et al. (2006) use a cosmological N-body simulation including gas to show that a minor merger can result in a red elliptical galaxy displaying red tidal features, similar to some of the objects selected by vD05, if AGN heating is taken into account.
If the Feldmann et al. (2008) and Kawata et al. (2006) scenarios are correct, and the vD05 red galaxy tidal features are due to the accretion of a low mass, possibly disk-dominated galaxy, then the accreted companion could contain a significant reservoir of gas, which should be accompanied by dust. Whitaker & van Dokkum (2008) analyze and HST/ACS and WFPC2 images of 31 of the bulge-dominated red sequence galaxies presented by vD05 and found that only 10% show evidence for dust based on their spatially-resolved colors. Assuming a simple relation between dust and gas mass, they conclude that red mergers in the nearby Universe mostly involve early-type galaxies with little gas.
In contrast, Donovan et al. (2007) examine 20 early-type galaxies known to be associated with neutral hydrogen. Of these, 15 match the vD05 optical selection criteria. The majority have 108 M⊙ of HI. In two cases, significant (up to 3040 M⊙ yr-1) star formation is detected. They conclude that red early-type galaxies are not the product of truly dry mergers. Whitaker & van Dokkum (2008) argue that this sample is not representative of massive ellipticals. However, cold gas is observed in a large fraction of early-type galaxies in the nearby universe (Morganti et al. 2006; Combes et al. 2007).
The star formation activity within a subset of the vD05 sample was recently analyzed by Sánchez-Blázquez et al. (2009) (hereafter SB09), who derived kinematics, stellar population absorption features, and ionization from emission lines. They find that half of the sample with strong tidal features contain young stellar populations corresponding to 2% of the baryonic mass of the galaxy, while a sample lacking interaction features does not contain detectable star formation. They also find that the galaxies containing young stellar populations are supported by rotation, which is unexpected in remnants of major dry mergers (Cox et al. 2006; Naab & Burkert 2003).
Given these conflicting results regarding the gas content of optically selected dry mergers, we use data from the Spitzer Space Telescope to revisit the question of whether the specific red mergers identified by vD05 are truly dry. In §2 we describe our multiwavelength data. In §3 we present the spectral energy distributions (SEDs) of a subsample of the vD05 galaxies and show that a significant fraction of the sources display mid-infrared excesses. After arguing that the origin of these excesses is most likely star formation (§4), we estimate the implied star formation rates (SFRs) in §5, and discuss the contributions from AGN and AGB stars in §6 and §7. We then estimate the dust and gas content of these dry mergers in §8, discuss the results in §9, and conclude in §10. Throughout, we use km s-1 Mpc-1, , and . All quoted magnitudes are in the Vega system.
2. The Sample and Survey Data
In this paper, we investigate the properties of the sample of red galaxies presented by vD05. Galaxies were selected by vD05 based on total magnitude and color. The selection was tuned to yield nonstellar field objects with the colors and magnitudes of early-type galaxies at . The vD05 sample consists of 116 red galaxies selected from the optical imaging of the Boötes field of the NOAO Deep Wide-Field Survey (NDWFS; Jannuzi & Dey 1999), and 10 galaxies selected from the Multiwavelength Survey by Yale-Chile (MUSYC; Gawiser et al. 2006). The relative numbers reflect the relative areas of the parent surveys. In this paper, we analyze the SEDs of the Boötes sample.
The Boötes field of the NDWFS has been observed with a variety of telescopes, at wavelengths ranging from the X-ray to the radio. The multiwavelength data sets used in this paper are the following.
Ground-based Optical Imaging: The 9.3 deg2 Boötes field of the NDWFS has been imaged in the , , , and bands down to 5 point-source depths of 27.1, 26.1, 25.4, and 19.0 Vega mags, respectively111See http://www.noao.edu/noao/noaodeep/ for more information regarding the depth and coverage of the NDWFS.. These are the data used by vD05 to select 116 red galaxies. The optical photometry plotted in this paper was determined using the images of the third data release (DR3) of the NDWFS, smoothed to achieve a uniform 1.35 FWHM Moffat profile with a parameter of 2.5. We used SExtractor AUTO magnitudes (Bertin & Arnouts 1996).
Spitzer IRAC Imaging: As part of the Spitzer Deep Wide-Field Survey (SDWFS; Ashby et al. 2009), 10 square degrees of the Boötes field have been mapped with the Infrared Array Camera (IRAC; Fazio et al. 2004) on board the Spitzer Space Telescope. The 5, 4 diameter, aperture-corrected SDWFS limits are 18.77, 18.83, 16.50, and 15.82 Vega mag at 3.6, 4.5, 5.8, and 8.0 , respectively. We measured SExtractor AUTO magnitudes using the SDWFS version 3.2 zeropoints. All 116 objects that were selected by vD05 from the optical Boötes data were also observed by IRAC.
Spitzer MIPS Imaging: Approximately 8.74 deg2 of the Boötes field have been imaged with the Multiband Imaging Photometer for Spitzer (MIPS; Rieke et al. 2004). The 1 point-source depths of the MIPS survey are 0.051, 5, and 18 mJy at 24, 70, and 160 , respectively. The data were reduced by the MIPS GTO team. Only five of the 116 sources selected by vD05 from the optical imaging of the Boötes field lack MIPS coverage: 6-2707, 2-3102, 3-953, 4-567, 2-3070. All MIPS photometry quoted in this paper refers to the emission associated with the main galaxy. In some cases, we see 24 emission in the near vicinity of the galaxy even though it is not centrally located. This emission may be associated with the tidal arms and/or may be associated with the merger. This emission is not accounted for in our current discussion, but may represent additional star formation associated with the merger event. Examples include 2-368, 3-601, 4-1975, 11-1732, 13-3813, 16-584, 17-2819, 21-837, 25-3572, and 27-984.
Chandra X-ray Imaging: As part of the XBoötes survey, 9.3 deg2 of the Boötes field has been imaged at a depth of 5 ks with ACIS-I on the Chandra X-ray Observatory (Murray et al. 2005; Kenter et al. 2005; Brand et al. 2006). The limiting flux, corresponding to 4 or more X-ray counts, is erg cm-2 s-1. The X-ray detections are discussed in §6.1.
SDSS Optical Spectroscopy: The Boötes field has also been observed as part of the Sloan Digital Sky Survey (SDSS; York et al. 2000; Gunn et al. 2006, 1998). We searched the SDSS DR7 (Abazajian et al. 2009) database to find the optical spectra corresponding to our sources. Of the 116 Boötes sources, we found optical spectra for 106. Figure 1 shows their redshift distribution. The sources lie in the range , with a median redshift of .
Many measurements and physical properties have been derived from the SDSS spectra in a homogenous way and made public by a team of SDSS researchers at the Max-Planck Institute for Astronomy at Heidelberg and Johns Hopkins University. Although SDSS DR7 spectra are available, this value-added catalog is only complete through DR4 (Adelman-McCarthy et al. 2006) at the time of writing. Therefore, the reported optical SFRs, classifications, and stellar masses are measured from DR4 spectra222http://www.mpa-garching.mpg.de/SDSS/DR4.
Samples: Our sample of red ellipticals is drawn from the set of galaxies identified as red ellipticals in the Boötes field by vD05. We first selected all 75 galaxies identified as red ellipticals (i.e., classified “E/S0”, but not “S0” or “S”) by vD05. In addition to the simple morphological classification, vD05 also visually classified galaxies into “tidal” classes, which take on four integer values (0 to 3) based on the following criteria: 0 for no tidal features; 1 for weak tidal features; 2 for strong tidal features; and 3 for evidence of an ongoing interaction with a neighboring galaxy. While the tidal class assigned to a galaxy is subjective and dependent on the depth of the imaging data available, it serves as a simple diagnostic to discriminate undisturbed ellipticals (i.e., those with tidal=0) from those which show some evidence of recent interaction (i.e., those with tidal0). Of the sample of 75 ellipticals in the vD05 study, 21 are undisturbed (tidal=0) and 54 are dry merger candidates (tidal0). Figure 1 shows the redshift distribution of the two samples. The redshift distributions are similar and suggest that the samples can be compared fairly. Table 1 lists the properties of the 54 dry merger candidates (tidal0).
3. Observed Mid-Infrared Excesses Among Dry Merger Candidates
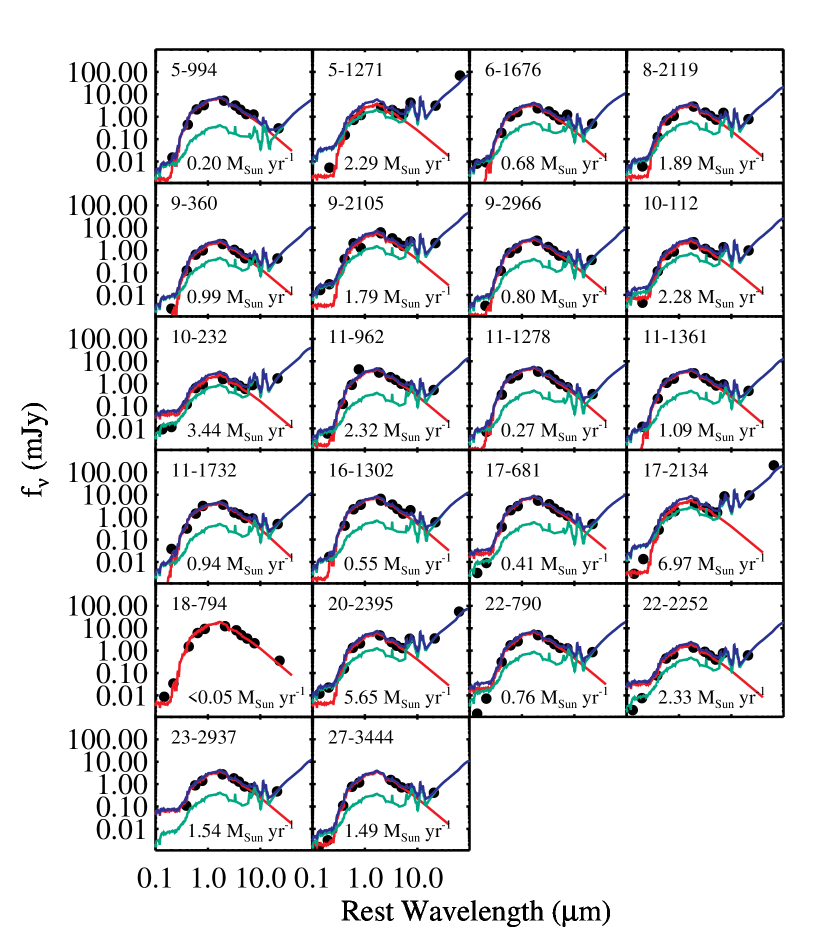
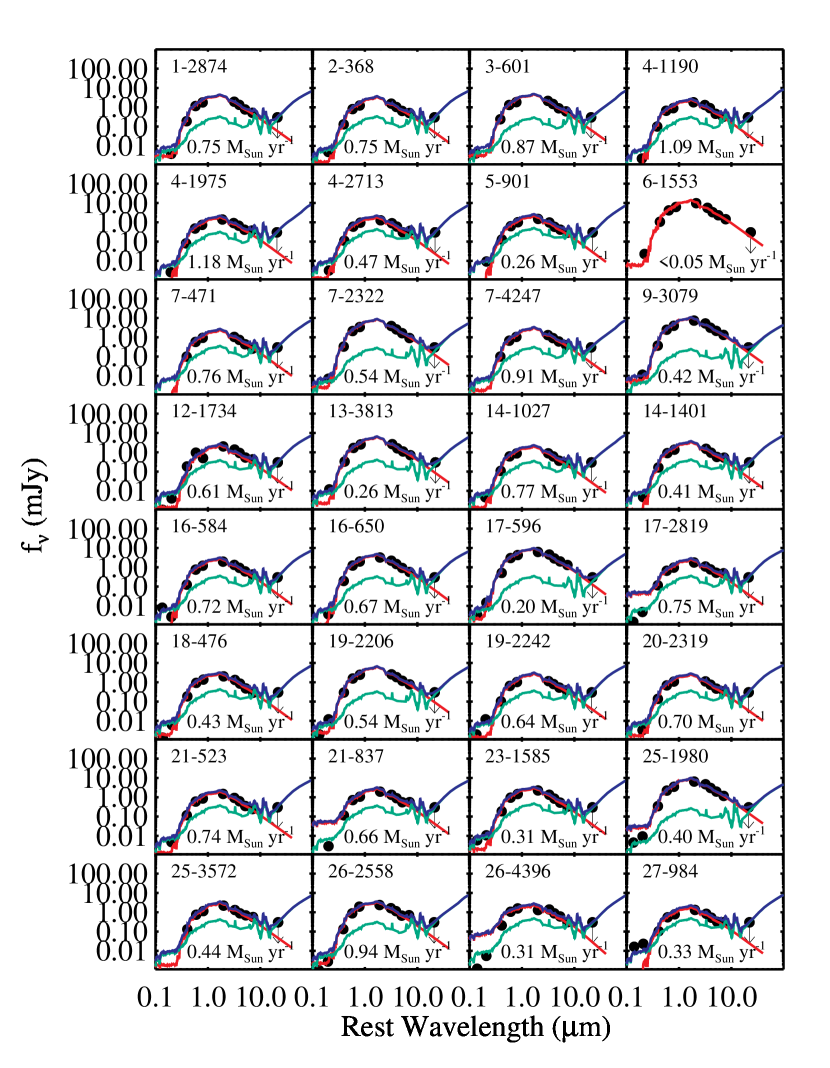
Using the multiwavelength survey data described in §2, we present the spectral energy distributions (SEDs) of the 54 Boötes dry merger candidates listed in Table The Dirt on Dry Mergers. Figure 2 shows the subset of 22 (41%) that were detected at 24 , while Figure 3 shows the remaining 32 (59%), which were undetected at 24 . Although a significant fraction of Boötes dry mergers were undetected in our 24 survey, all were detected at 8 .
Stellar population synthesis models computed using the isochrone synthesis code of Bruzual & Charlot (2003) (hereafter BC03) were fit to the optical () and near-infrared (IRAC 3.6, 4.5, 5.8 ) photometry for each object in Figures 2 and 3. The models include three different metallicities (0.008, 0.004, 0.02); have exponentially decreasing star formation rates with ; and use a Chabrier IMF. They do not include extinction. While the best-fitting BC03 models are good representations of the optical and near-infrared data, the photometry at longer wavelengths (IRAC 8 , MIPS 24 and, in three cases, MIPS 70 ) varies significantly with respect to this model. For example, Figures 2 and 3 show that the observed 24 flux density ranges from being consistent with an old stellar population (e.g. 18-794, 6-1553) to being over an order-of-magnitude in excess of it (e.g. 20-2395). Large 8 excesses are also obvious in several sources (e.g. 5-1271, 10-112, 17-2134).
These excesses may be attributed to emission from some combination of 1) dusty star-forming regions; 2) dust heated by an active galactic nucleus (AGN); and 3) dust in the envelopes of stars on the Asymptotic Giant Branch (AGB). The strong 8 excesses apparent in some sources in Figure 2 imply polycyclic aromatic hydrocarbon (PAH) emission, which strongly suggests ongoing star formation. In §4, we use this basic premise to argue that the observed mid-infrared excesses are dominated by dusty star formation. However, we also consider the potential AGN and AGB contributions in §6 and §7, respectively. In §8, we go on to estimate the dust and gas content of the dry merger candidates under the simplifying assumption that all of the mid-infrared excesses are due entirely to star formation. The SFRs used in Figures 2 through 4 all refer to values derived from the excess 24 emission, as described in §5.
4. Origin of the Observed Mid-Infrared Excesses
IRAC colors have been developed as a diagnostic to distinguish between star formation and AGN activity by several groups (Lacy et al. 2004; Sajina et al. 2005; Stern et al. 2005; Brand et al. 2006). For star-forming galaxies at , the first three IRAC channels sample the Rayleigh-Jeans side of the blackbody contributed by old (cool) stars, while the fourth IRAC channel samples the rest-frame 7.7 PAH feature. Thus, in star-forming galaxies, the [3.6][4.5] color is blue and the [5.8][8.0] color is red. For passive galaxies with no ongoing star formation or AGN activity, there will be no PAH features, so both [3.6][4.5] and [5.8][8.0] are expected to be blue. For powerful AGN, both the stellar blackbody and the PAH features can be overwhelmed by emission from AGN-heated dust, leading to redder [3.6][4.5] and bluer [5.8][8.0] colors (Brand et al. 2009).
Figure 4 shows an IRAC color-color diagnostic diagram with the Boötes dry merger candidates overplotted. The AGN wedge was determined by Stern et al. (2005) and was calibrated on optical spectroscopic diagnostics. We adopt the Brand et al. (2009) empirically-determined boundary between PAH (star-forming) and non-PAH (passive) emitting galaxies. Based on this color-color diagram, many of the vD05 Boötes dry merger candidates exhibit colors consistent with PAH-emitting star-forming galaxies or passive galaxies with low levels of star formation activity. Only one source (11-1732) lies near the AGN wedge in this diagram. The mid-infrared colors do not rule out the presence of AGN in these galaxies (see §6), but they do imply that the observed mid-infrared excesses of the vast majority are dominated by star formation rather than AGN activity.
5. Star Formation Rates
5.1. Infrared SFRs
Figures 2 and 3 show the rest-frame SEDs of the Boötes dry merger candidates, as well as the BC03 model fits to the and IRAC channels 1-3 photometry. We estimate the infrared ( ) luminosity of each source from the Chary & Elbaz (2001) model that best fits the single data point represented by the 24 excess (the observed 24 flux density minus the expected 24 flux density of the BC03 model). We find infrared luminosities in the range , corresponding to SFRs in the range (Kennicutt 1998).
For those sources without 24 detections, we calculate upper limits to the infrared SFR. Given the typical redshift () of the sources and the depth of the MIPS imaging, we are able to detect SFRs greater than approximately 1 M☉ yr-1. Of the total sample of 54 dry merger candidates, 22 have 24 detections. Of these, 12 have SFR1 M⊙ yr-1. In addition, we can rule out star formation rates greater than 1 M⊙ yr-1 in all but two of the 32 dry merger candidates with only upper limits at 24 . Therefore, 12-14 out of 54 dry merger candidates (22-26%) have infrared-derived SFR1 M⊙ yr-1.
The infrared-derived SFRs and limits are listed in the second column of Table The Dirt on Dry Mergers. We caution the reader that these star formation rates carry large (systematic) uncertainties, stemming from our lack of direct knowledge about the far-infrared SED, as well as scatter in the conversion between far-infrared luminosity and SFR. We also remind the reader that in several cases we have excluded 24 emission arising outside the main body of the galaxy and are therefore missing some of the star formation in these galaxies.
5.2. Spectroscopic SFRs
As described in §2, many of the Boötes dry merger candidates were spectroscopically observed as part of SDSS. Brinchmann et al. (2004) have estimated SFRs for galaxies based on SDSS DR4 spectra. First, the spectra were classified according to the BPT diagram (Baldwin et al. 1981; §6). For galaxies classified as Star-Forming, Brinchmann et al. (2004) modeled all of the emission lines to determine the SFR. For Low SNR Star-Forming galaxies, the observed H luminosity was used to calculate the SFR. For the galaxies classified as AGN, Composite, or Unclassifiable, the measured values of D4000 were used to estimate SFRs. All SFRs were aperture corrected. The resulting SFRs are listed in Table The Dirt on Dry Mergers. The stellar mass estimates (LGM in the Brinchmann et al. (2004) catalog) are also presented in Table The Dirt on Dry Mergers.
SDSS-derived specific SFRs are available for 32 Boötes dry merger candidates classified as Star-Forming, Low SNR Star-Forming, AGN, Composite, or Unclassifiable. The values range from to yr-1. Of these 32, most (81%) have specific SFRs less than yr-1, making them typical of quiescent galaxies detected at 24 (Salim et al. 2009). However, 19% (5-1271, 10-232, 11-1732, 17-2134, 22-2252, 27-3444) have specific SFRs exceeding yr-1, making them transition objects between quiescent and star forming. All of these have significant 24 excesses, but all have SDSS-derived stellar masses that are completely consistent with those of the quiescent galaxies. Of the six transition objects, Table The Dirt on Dry Mergers reveals that three have weak tidal features (), one has strong tidal features (), and two show evidence of an ongoing interaction with another galaxy (). Based on this small sample, we conclude that dry merger candidates with high spectroscopically-derived specific SFRs show diversity in the strength of their tidal features.
Figure 5 shows the SDSS-derived SFRs versus the MIPS-derived SFRs. The two are broadly correlated at a high level of significance according to the Spearman correlation coefficient ( when neglecting upper limits in the IR-derived SFRs). On average, the MIPS-derived SFRs are a factor of 1.4 higher than the SDSS-derived SFRs, a discrepancy which may be due to dust-obscuration.
6. AGN Content of Dry Merger Candidates
Having identified star formation as the dominant source of the mid-infrared excesses observed in Figure 2, we now investigate the AGN content of the Boötes dry mergers. In particular, we consider X-ray luminosity and optical spectroscopic line ratios.
6.1. X-ray Luminosity
The X-ray luminosity of a dry merger candidate can indicate its level of AGN activity. The XBoötes survey has a limiting depth of . At , this corresponds to an X-ray luminosity of . Grimm et al. (2003) find that the X-ray luminosity of a galaxy is related to its SFR through the following relation:
| (1) |
for erg s-1. This relation yields an X-ray derived SFR of 30 M⊙ yr-1 at the detection limit of the XBoötes survey. This limiting SFR is a factor of 4 higher than the highest mid-infrared SFR derived for any of these sources (see §5), so any dry merger candidate detected in the XBoötes survey likely hosts an AGN.
Using the XBoötes catalog of Brand et al. (2006), we found X-ray detections for only 5 of the red galaxies: 1-1403, 5-901, 5-2398, 10-232, and 26-5372. Of these, only two (5-901 and 10-232) are dry merger candidates. The object 5-901 was not detected at 24 . In contrast, 10-232 has mJy, which translates to a fairly large SFR of . The X-ray luminosity calls into question whether the observed 24 excess for this source can be translated into a SFR, since AGN can also emit strongly at 24 . However, the SED shown in Figure 2 appears to have an elevated 8 flux density, presumably from strong PAH features, indicating that star formation dominates the mid-infrared flux density. The same conclusion can be drawn from Figure 4, where 10-232 (indicated by a gold star within a black circle) is very near the “PAH” region and well removed from the “Powerful AGN” region.
While we detect two X-ray luminous AGN among the dry merger candidates, the mid-infrared emission of these sources does not appear to be strongly affected by the AGN.
6.2. BPT Diagram
The hard ionizing radiation of AGN results in optical emission line ratios distinct from those observed in star-forming regions. For example, high [O III]/H and [N II]/H ratios have been used to diagnose the presence of AGN in what is known as a BPT diagram (Baldwin et al. 1981). Brinchmann et al. (2004) use 3 diameter SDSS DR4 fiber spectroscopy to classify targeted galaxies into the following categories, which are numbered as in Table The Dirt on Dry Mergers.
Star-Forming (1): The objects with in all four BPT lines that have line ratios consistent with star formation.
Low SNR Star-Forming (2): Galaxies with in H that have not been classified as SF, AGN, or Composite.
Composite (3): The objects with in all four BPT lines for which up to 40% of the H luminosity has an AGN origin.
AGN (4): The objects with in all four BPT lines for which a substantial AGN contribution is required to reproduce the BPT line fluxes. In addition, galaxies with AGN-like values of [N II]6584/H and in the [N II]6584 and H lines but in either of the [O III]5007 or H lines.
Unclassifiable (-1): Those galaxies that cannot be classified using the BPT diagram, typically because they have no or very weak emission lines.
Of the 32 classified sources, four are classified as low SNR star-forming, 10 are classified as AGN, one is classified as Composite, and 17 are Unclassifiable. Recall that these classifications are based on 3 diameter fiber spectra. Thus, the Unclassifiable sample likely includes galaxies which do not have star formation in the central bulge but may have star formation in the disk. Similarly, while the optical emission lines indicate the presence of an AGN in some objects, this does not mean that the mid-infrared excess in these objects is dominated by AGN activity. The IRAC ratios presented in §5 and Figure 4 indicate that the objects with the largest mid-infrared excesses are dominated by star formation in the mid-infrared.
Recently, SB09 spectroscopically classified 24 of the galaxies listed in our Tables The Dirt on Dry Mergers and The Dirt on Dry Mergers. Since they had insufficient wavelength coverage to use the same line diagnostics as Brinchmann et al. (2004), they relied on [O II]3727, H, and [O III]5007. Their results are listed in column 5 of Table The Dirt on Dry Mergers. There are 12 objects for which both SDSS and SB09 classifications exist. Of these, six were listed by SB09 as “?”, meaning there was insufficient wavelength coverage to measure enough lines for classification. Of the remainder, three (12-1734, 17-681, 22-790) were consistently classified as having no or very weak emission lines; 10-232 was consistently classified as an AGN, and only two (6-1676 and 11-1732) had inconsistent diagnoses (-1 versus Seyfert and 4 versus LINER).
7. AGB contribution to mid-infrared emission
In Figures 2 and 3, we model an old stellar population with BC03 fits. However, such a stellar template may not accurately account for the mid-infrared emission from an old stellar population. Kelson & Holden (2010) recently showed that the large amount of near-infrared light expected from the thermally pulsating asymptotic giant branch (TP-AGB) phase (Maraston 2005; Bruzual 2009; Conroy et al. 2009), when coupled with the observed mid-infrared fluxes of TP-AGB stars in our own galaxy, imply that a significant amount of mid-infrared flux could come from a 1 Gyr old stellar population. This timescale is on the order of the time that a disk accretion event would have occurred according to Feldmann et al. (2008) and thus, some mid-infrared emission could come from the stars that formed at or around the time of the accretion event itself. To test this effect, we have obtained updated models (commonly referred to as CB07 models in the literature) which use the prescription of Marigo & Girardi (2007) and Marigo et al. (2008) for the TP-AGB evolution of low- and intermediate-mass stars (S. Charlot 2011, private communication). We find that the resulting infrared-derived SFRs are very similar, and identical in many cases. We therefore conclude that for this population, the contribution of TP-AGB stars to the mid-infrared flux is insignificant.
8. Dust and Gas Masses of Dry Merger Candidates
The red optical colors of the Boötes dry merger candidates can be modeled by an old stellar population. However, they could also be consistent with dust-extincted younger stars. The dust mass of a galaxy can be inferred from its measured submillimeter flux. Although submillimeter photometry is currently unavailable for these dry merger candidates, we can extrapolate based on the measured 24 flux densities. Based on Figure 4, we assume that AGN do not contribute significantly to the far infrared fluxes of these objects. Therefore, we use the best-fit Chary & Elbaz (2001) template from §7 to estimate the 350 flux density of each source detected at 24 (or an upper limit in cases where 24 observations were available but there was no detection). We estimate the dust mass following Hughes et al. (1997):
| (2) |
where is the luminosity distance; is the rest-frequency mass absorption coefficient interpolated from Draine (2003); and is the value of the blackbody function at the rest frequency and a temperature , which is taken to be 45 K. Estimated dust masses are listed in Table The Dirt on Dry Mergers. The dust masses for the dry merger candidates detected at 24 range from (0.3-10) 106 M⊙, with a mean of 3 106 M⊙. The dust mass upper limits for the dry merger candidates undetected at 24 range from (0.3-2) 106 M⊙, with a mean of 1.6 106 M⊙. For the canonical gas-to-dust ratio of 100, these dust masses correspond to gas masses ranging from (3-100) 107 M⊙ for the dry merger candidates detected at 24 and upper limits ranging from (3-20) 107 M⊙ for the dry merger candidates undetected at 24 . Adopting a dust temperature of 30 K instead of 45 K would increase these estimates by a factor of two.
Our Spitzer observations reveal dust that went undetected in the HST analysis of Whitaker & van Dokkum (2008). The 18 sources for which HST imaging is available are indicated in Table The Dirt on Dry Mergers. Of these, we detected a 24 excess in half: 9-360, 9-2105, 11-962, 16-1302, 17-681, 17-2134, 22-790, 22-2252, 27-3444. Note that 17-2134 has a particularly large 24 excess, corresponding to a SFR of 7 M⊙ yr-1 if all of it is attributed to star formation. Interestingly, Whitaker & van Dokkum (2008) find evidence for dust in 25-1980, which shows no mid-infrared excess. Thus it seems that both the optical and mid-infrared imaging are necessary for a full census of the dust content of this population.
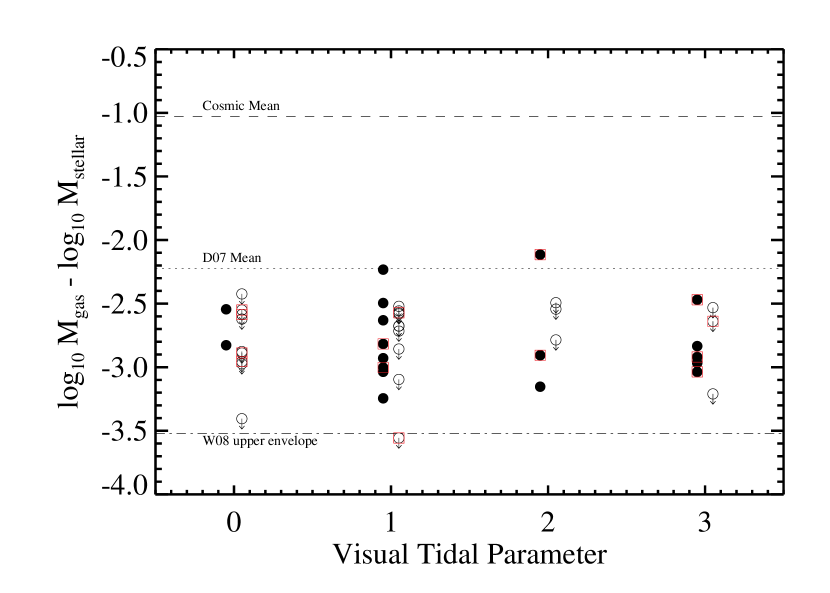
Figure 6 shows the gas-to-stellar mass ratio versus vD05 tidal parameter for the subset of the dry merger candidates for which we were able to calculate all quantities. For comparison, we show the cosmic mean, the Donovan et al. (2007) sample mean, and the Whitaker & van Dokkum (2008) upper envelope, all taken from Whitaker & van Dokkum (2008). The measured gas-to-stellar mass ratios derived by Spitzer are intermediate between those derived for an overlapping sample by Whitaker & van Dokkum (2008) and those derived for an analogous sample of early-type galaxies with HI emission by Donovan et al. (2007). All are significantly below the cosmic mean. Although our gas mass estimates are significantly higher than those calculated from optical images, we still find that gas makes up less than 1% of the baryonic mass in these ellipticals.
A caveat to Figure 6 are the uncertainties in calculating the gas masses. These errors arise from uncertainties in the extrapolation to the far-infrared, the dust temperatures, the mass absorption coefficient, and the gas-to-dust ratio. Considering only the last, we would have to adopt a gas-to-dust ratio of 10 to match the gas-to-stellar mass ratios of Whitaker & van Dokkum (2008) and a gas-to-dust ratio of 250 to match to gas-to-stellar mass ratios of Donovan et al. (2007).
9. Discussion
We have detected 1 M of star formation in 25% of the massive dry merger candidates discovered by vD05 in Boötes. Given the mass already existing in old stars, this represents a “frosting” of star formation, similar to what has been seen in previous studies of elliptical galaxies (e.g. Trager et al. 2000; Gebhardt et al. 2003). Kormendy et al. (2009) have argued that the cuspy cores observed in the most luminous ellipticals may result from the scouring caused by binary black holes in dry mergers. The higher redshift of our sample and the lack of sufficiently high spatial resolution data preclude a determination of the nature of the central light profile. However, the absolute magnitude limit on the vD05 sample is approximately 1.5 mags fainter than the cuspy cores observed by Kormendy et al. Based on the SED combined with a number of assumptions, we estimate that these ellipticals are associated with on the order of 108 M⊙ in gas.
What is the origin of this gas? We favor a scenario in which gas was delivered to the dry merger candidates via a merger. The strongest evidence for this is that the residual star formation tends to be found in the sources with morphological evidence of a recent merger. Figure 7 shows the distribution of infrared-derived SFRs in bins of the parameter tabulated by vD05. Distributions are presented both for the Boötes dry merger candidates and for a control sample consisting of the subset of the red galaxy sample with early type morphologies and no tidal features. Galaxies forming stars at a rate greater than about 1 M⊙ yr-1 tend have a parameter greater than 0. The observation that the mid-infrared emission is related to the designation supports the hypothesis that the star formation is due to interaction-driven activity. In a GALEX study of these same sources, Kaviraj (2010) also found that the dry merger candidates with the bluest GALEX colors tended to show signs of tidal interaction. Additionally, Donovan et al. (2007) looked at HI data for galaxies that would fall into the dry merger sample, and found large reservoirs of gas. They find that 12/15 red rogues exhibit signs of tidal interaction. This is comparable to the fraction of red early-type galaxies found by vD05 to exhibit tidal features.
An alternative explanation is that gas expelled from AGB stars is already present in the dry merger candidates, and star formation is triggered by a merger, not fueled by one. Can AGB stars expel enough gas to fuel star formation? For a M⊙ old stellar population, 0.15 M⊙ yr-1 is expected to be ejected by AGB stars (Mathews & Brighenti 2003). Over a billion years, such a galaxy could accumulate 108 M⊙ of gas, which is on the same order as what is observed. If this were the case, then we would expect that even the galaxies without tidal features should have evidence for gas, even if it has not been triggered to form stars.
10. Conclusions
We analyze the multiwavelength data available for vD05 dry merger candidates in the NDWFS Boötes field. We find:
-
•
A significant fraction of the sources display mid-infrared (24 ) excesses over that expected from an old stellar population with the observed red optical colors.
-
•
Based on the mid-infrared IRAC colors indicating the presence of PAH emission, this infrared excess is likely due to emission from dust heated by star forming regions, rather than AGN-heated dust or AGB stars.
-
•
If the observed mid-infrared excesses are due to star formation, we estimate that a quarter of the Boötes dry merger candidates are forming stars at rates greater than 1 M⊙ yr-1. This represents a “frosting” of star formation on top of a well-developed old stellar population.
-
•
Red early-type galaxies exhibiting tidal features are more likely to have star formation detectable in the mid-infrared than a control sample lacking tidal features. This implies that a frosting of star formation in elliptical galaxies may be triggered by tidal interactions.
-
•
We estimate gas masses in the range (3-100) 107 M⊙ for the dry merger candidates detected at 24 and upper limits ranging from (3-20) 107 M⊙ for the dry merger candidates undetected at 24 .
-
•
Based on the observed 24 emission, and assuming the Chary & Elbaz (2001) star-forming templates, we predict the 70 flux densities of the dry merger candidates. The predicted 70 flux densities are shown in Table The Dirt on Dry Mergers. Only three sources have a Spitzer 70 detection. For these three sources, the observed 70 flux density is a factor of 1.5-2 times greater than the template prediction. Nevertheless, these template predictions provide useful guidelines for future Herschel observations.
11. Acknowledgments
AD thanks the SSC/Caltech for its gracious hospitality during summer 2009, when much of this paper was written. EC was supported through the Caltech Summer Undergraduate Research Fellowship program and the Spitzer Enchanced Science Fund. ELF is supported by the Spitzer Fellowship Program through a contract with JPL/Caltech/NASA. We thank John Moustakas for advice on using the SDSS spectra, and Stéphane Charlot for providing the CB07 models. We also warmly thank Lee Armus, George Helou, Bradford Holden, Daniel Kelson, Francine Marleau, Samir Salim, and Nick Scoville for stimulating discussions pertaining to this work. Finally, we are grateful to the anonymous referee for providing useful feedback that improved this work.
This research is partially supported by the National Optical Astronomy Observatory which is operated by the Association of Universities for Research in Astronomy, Inc. (AURA) under a cooperative agreement with the National Science Foundation.
This work is in part based on observations made with the Spitzer Space Telescope, which is operated by the Jet Propulsion Laboratory, California Institute of Technology under a contract with NASA. Support for this work was provided by NASA through an award issued by JPL/Caltech.
The Spitzer/MIPS survey of the Boötes region was obtained using GTO time provided by the Spitzer Infrared Spectrograph Team (James Houck, P.I.) and by M. Rieke.
Funding for the SDSS and SDSS-II has been provided by the Alfred P. Sloan Foundation, the Participating Institutions, the National Science Foundation, the U.S. Department of Energy, the National Aeronautics and Space Administration, the Japanese Monbukagakusho, the Max Planck Society, and the Higher Education Funding Council for England. The SDSS Web Site is http://www.sdss.org/.
The SDSS is managed by the Astrophysical Research Consortium for the Participating Institutions. The Participating Institutions are the American Museum of Natural History, Astrophysical Institute Potsdam, University of Basel, University of Cambridge, Case Western Reserve University, University of Chicago, Drexel University, Fermilab, the Institute for Advanced Study, the Japan Participation Group, Johns Hopkins University, the Joint Institute for Nuclear Astrophysics, the Kavli Institute for Particle Astrophysics and Cosmology, the Korean Scientist Group, the Chinese Academy of Sciences (LAMOST), Los Alamos National Laboratory, the Max-Planck-Institute for Astronomy (MPIA), the Max-Planck-Institute for Astrophysics (MPA), New Mexico State University, Ohio State University, University of Pittsburgh, University of Portsmouth, Princeton University, the United States Naval Observatory, and the University of Washington.
Facilities: Spitzer(MIPS,IRAC,IRS) KPNO:2.1m(ONIS,SQUID,FLAMINGOS,FLAMINGOS-1) Mayall(Mosaic-1)
References
- Abazajian et al. (2009) Abazajian, K. N. et al. 2009, ApJS, 182, 543
- Adelman-McCarthy et al. (2006) Adelman-McCarthy, J. K. et al. 2006, ApJS, 162, 38
- Ashby et al. (2009) Ashby, M. L. N. et al. 2009, ApJ, 701, 428
- Baldwin et al. (1981) Baldwin, J. A., Phillips, M. M., & Terlevich, R. 1981, PASP, 93, 5
- Bell et al. (2006) Bell, E. F. et al. 2006, ApJ, 640, 241
- Bell et al. (2005) —. 2005, ApJ, 625, 23
- Bell et al. (2004) —. 2004, ApJ, 608, 752
- Bender et al. (1993) Bender, R., Burstein, D., & Faber, S. M. 1993, ApJ, 411, 153
- Bertin & Arnouts (1996) Bertin, E., & Arnouts, S. 1996, A&AS, 117, 393
- Bower et al. (1992) Bower, R. G., Lucey, J. R., & Ellis, R. S. 1992, MNRAS, 254, 601
- Brand et al. (2006) Brand, K. et al. 2006, ApJ, 644, 143
- Brand et al. (2009) —. 2009, ApJ, 693, 340
- Brinchmann et al. (2004) Brinchmann, J., Charlot, S., White, S. D. M., Tremonti, C., Kauffmann, G., Heckman, T., & Brinkmann, J. 2004, MNRAS, 351, 1151
- Brown et al. (2008) Brown, M. J. I. et al. 2008, ApJ, 682, 937
- Bruzual (2009) Bruzual, G. 2009, in Revista Mexicana de Astronomia y Astrofisica, vol. 27, Vol. 35, Revista Mexicana de Astronomia y Astrofisica Conference Series, 154–155
- Bruzual & Charlot (2003) Bruzual, G., & Charlot, S. 2003, MNRAS, 344, 1000
- Chary & Elbaz (2001) Chary, R., & Elbaz, D. 2001, ApJ, 556, 562
- Cimatti et al. (2006) Cimatti, A., Daddi, E., & Renzini, A. 2006, A&A, 453, L29
- Cole et al. (2000) Cole, S., Lacey, C. G., Baugh, C. M., & Frenk, C. S. 2000, MNRAS, 319, 168
- Combes et al. (2007) Combes, F., Young, L. M., & Bureau, M. 2007, MNRAS, 377, 1795
- Conroy et al. (2009) Conroy, C., Gunn, J. E., & White, M. 2009, ApJ, 699, 486
- Cox et al. (2006) Cox, T. J., Dutta, S. N., Di Matteo, T., Hernquist, L., Hopkins, P. F., Robertson, B., & Springel, V. 2006, ApJ, 650, 791
- De Lucia & Blaizot (2007) De Lucia, G., & Blaizot, J. 2007, MNRAS, 375, 2
- Djorgovski & Davis (1987) Djorgovski, S., & Davis, M. 1987, ApJ, 313, 59
- Donovan et al. (2007) Donovan, J. L., Hibbard, J. E., & van Gorkom, J. H. 2007, AJ, 134, 1118
- Draine (2003) Draine, B. T. 2003, ARA&A, 41, 241
- Eisenhardt et al. (2008) Eisenhardt, P. R. M. et al. 2008, ApJ, 684, 905
- Fazio et al. (2004) Fazio, G. G. et al. 2004, ApJS, 154, 10
- Feldmann et al. (2008) Feldmann, R., Mayer, L., & Carollo, C. M. 2008, ApJ, 684, 1062
- Gawiser et al. (2006) Gawiser, E. et al. 2006, ApJS, 162, 1
- Gebhardt et al. (2003) Gebhardt, K. et al. 2003, ApJ, 597, 239
- Grimm et al. (2003) Grimm, H.-J., Gilfanov, M., & Sunyaev, R. 2003, MNRAS, 339, 793
- Gunn et al. (1998) Gunn, J. E. et al. 1998, AJ, 116, 3040
- Gunn et al. (2006) —. 2006, AJ, 131, 2332
- Hughes et al. (1997) Hughes, D. H., Dunlop, J. S., & Rawlings, S. 1997, MNRAS, 289, 766
- Jannuzi & Dey (1999) Jannuzi, B. T., & Dey, A. 1999, in ASP Conf. Ser. 191: Photometric Redshifts and the Detection of High Redshift Galaxies, 111–+
- Kauffmann & Haehnelt (2000) Kauffmann, G., & Haehnelt, M. 2000, MNRAS, 311, 576
- Kaviraj (2010) Kaviraj, S. 2010, MNRAS, 408, 170
- Kawata et al. (2006) Kawata, D., Mulchaey, J. S., Gibson, B. K., & Sánchez-Blázquez, P. 2006, ApJ, 648, 969
- Kelson & Holden (2010) Kelson, D. D., & Holden, B. P. 2010, ApJ, 713, L28
- Kennicutt (1998) Kennicutt, R. C. 1998, ARA&A, 36, 189
- Kenter et al. (2005) Kenter, A. et al. 2005, ApJS, 161, 9
- Khochfar & Burkert (2003) Khochfar, S., & Burkert, A. 2003, ApJ, 597, L117
- Khochfar & Silk (2009) Khochfar, S., & Silk, J. 2009, MNRAS, 397, 506
- Kormendy et al. (2009) Kormendy, J., Fisher, D. B., Cornell, M. E., & Bender, R. 2009, ApJS, 182, 216
- Kuntschner (2000) Kuntschner, H. 2000, MNRAS, 315, 184
- Lacy et al. (2004) Lacy, M. et al. 2004, ApJS, 154, 166
- Maraston (2005) Maraston, C. 2005, MNRAS, 362, 799
- Marigo & Girardi (2007) Marigo, P., & Girardi, L. 2007, A&A, 469, 239
- Marigo et al. (2008) Marigo, P., Girardi, L., Bressan, A., Groenewegen, M. A. T., Silva, L., & Granato, G. L. 2008, A&A, 482, 883
- Mathews & Brighenti (2003) Mathews, W. G., & Brighenti, F. 2003, ApJ, 590, L5
- Morganti et al. (2006) Morganti, R. et al. 2006, MNRAS, 371, 157
- Murray et al. (2005) Murray, S. S. et al. 2005, ApJS, 161, 1
- Naab & Burkert (2003) Naab, T., & Burkert, A. 2003, ApJ, 597, 893
- Rieke et al. (2004) Rieke, G. H. et al. 2004, ApJS, 154, 25
- Sajina et al. (2005) Sajina, A., Lacy, M., & Scott, D. 2005, ApJ, 621, 256
- Salim et al. (2009) Salim, S. et al. 2009, ApJ, 700, 161
- Sánchez-Blázquez et al. (2009) Sánchez-Blázquez, P., Gibson, B. K., Kawata, D., Cardiel, N., & Balcells, M. 2009, MNRAS, 400, 1264
- Scarlata et al. (2007) Scarlata, C. et al. 2007, ApJS, 172, 494
- Stern et al. (2005) Stern, D. et al. 2005, ApJ, 631, 163
- Trager et al. (2000) Trager, S. C., Faber, S. M., Worthey, G., & González, J. J. 2000, AJ, 119, 1645
- Tran et al. (2005) Tran, K.-V. H., van Dokkum, P., Franx, M., Illingworth, G. D., Kelson, D. D., & Schreiber, N. M. F. 2005, ApJ, 627, L25
- van Dokkum (2005) van Dokkum, P. G. 2005, AJ, 130, 2647
- van Dokkum et al. (1999) van Dokkum, P. G., Franx, M., Fabricant, D., Kelson, D. D., & Illingworth, G. D. 1999, ApJ, 520, L95
- Whitaker & van Dokkum (2008) Whitaker, K. E., & van Dokkum, P. G. 2008, ApJ, 676, L105
- White & Frenk (1991) White, S. D. M., & Frenk, C. S. 1991, ApJ, 379, 52
- York et al. (2000) York, D. G. et al. 2000, AJ, 120, 1579


| Object | RA | Dec | tidal | zaafootnotemark: | [3.6] | [4.5] | [5.8] | [8.0] | remark | |||
|---|---|---|---|---|---|---|---|---|---|---|---|---|
| (h:m:s) | (::) | (Vega mag) | (Vega mag) | (Vega mag) | (Vega mag) | (mJy) | (mJy) | (mJy) | ||||
| 1-2874 | 14:27:19.5 | 32:44:29.1 | 3 | 0.1333 | 12.90 | 12.82 | 12.93 | 12.73 | 0.3 | 25 | 3 | SB09 |
| 2-368 | 14:26:15.6 | 32:54:27.4 | 2 | 0.1315 | 13.15 | 13.10 | 13.13 | 12.76 | 0.3 | 25 | 3 | |
| 3-601 | 14:27:03.5 | 33:33:51.8 | 2 | 0.1514 | 12.79 | 12.71 | 12.79 | 12.55 | 0.3 | 25 | 2 | W08; SB09 |
| 4-1190 | 14:25:43.7 | 34:17:02.8 | 3 | 0.1563 | 13.33 | 13.24 | 13.50 | 13.26 | 0.3 | 25 | 3 | W08 |
| 4-1975 | 14:26:43.2 | 34:28:53.3 | 3 | 0.1602 | 13.73 | 13.58 | 13.62 | 13.09 | 0.3 | 25 | 3 | W08 |
| 4-2713 | 14:25:03.5 | 34:37:49.0 | 3 | 0.1009 | 13.74 | 13.70 | 13.95 | 13.12 | 0.3 | 25 | 3 | |
| 5-901 | 14:26:35.8 | 34:49:48.6 | 1 | 0.0767 | 13.65 | 13.73 | 13.61 | 13.37 | 0.3 | 25 | 3 | |
| 5-994 | 14:27:03.2 | 34:51:35.0 | 2 | 0.0775 | 12.37 | 12.36 | 12.36 | 11.78 | 0.30 | 25 | 2 | SB09 |
| 5-1271 | 14:25:41.1 | 34:54:47.4 | 1 | 0.0766 | 12.88 | 12.76 | 12.34 | 10.45 | 3.10 | 68 | 32 | |
| 6-1553 | 14:26:14.7 | 35:31:05.5 | 1 | 0.0284 | 11.75 | 11.83 | 11.75 | 11.62 | 0.3 | 25 | 4 | SB09 |
| 6-1676 | 14:25:55.1 | 35:32:17.6 | 1 | 0.0995 | 13.04 | 12.98 | 12.98 | 11.80 | 0.48 | 25 | 5 | SB09 |
| 7-471 | 14:29:06.0 | 32:21:32.9 | 1 | 0.1313 | 13.58 | 13.48 | 13.56 | 13.49 | 0.3 | 25 | 3 | |
| 7-2322 | 14:27:53.9 | 32:37:14.7 | 1 | 0.1299 | 12.16 | 12.12 | 12.13 | 12.12 | 0.3 | 25 | 2 | SB09 |
| 7-4247 | 14:28:12.8 | 32:54:30.5 | 3 | 0.1496 | 13.34 | 13.25 | 13.20 | 13.04 | 0.3 | 25 | 2 | |
| 8-2119 | 14:28:54.7 | 33:12:12.2 | 2 | 0.1330 | 13.16 | 13.04 | 12.99 | 11.59 | 0.77 | 25 | 8 | SB09 |
| 9-360 | 14:28:29.6 | 33:29:53.8 | 2 | 0.1286 | 13.59 | 13.48 | 13.56 | 13.05 | 0.43 | 25 | 4 | W08 |
| 9-2105 | 14:29:19.2 | 33:48:58.0 | 1 | 0.0840 | 12.30 | 12.28 | 12.19 | 11.05 | 2.06 | 25 | 20 | W08; SB09 |
| 9-2966 | 14:28:24.5 | 33:57:38.4 | 1 | 0.1280 | 13.27 | 13.20 | 13.25 | 12.83 | 0.37 | 25 | 3 | |
| 9-3079 | 14:29:14.3 | 33:59:22.4 | 2 | 0.1293 | 11.83 | 11.90 | 11.82 | 11.72 | 0.3 | 25 | 1 | SB09 |
| 10-112 | 14:29:12.9 | 34:04:41.4 | 2 | 0.1280 | 13.48 | 13.40 | 13.23 | 11.69 | 0.97 | 25 | 10 | SB09 |
| 10-232 | 14:30:03.2 | 34:06:51.3 | 1 | 0.1261 | 13.53 | 13.37 | 13.24 | 12.18 | 1.71 | 25 | 19 | SB09 |
| 11-962 | 14:29:09.7 | 34:52:13.2 | 3 | 0.1735 | 12.90 | 12.71 | 12.66 | 12.35 | 0.52 | 25 | 4 | double nucleus; W08 |
| 11-1278 | 14:29:30.2 | 34:57:23.7 | 3 | 0.0776 | 12.64 | 12.68 | 12.69 | 12.42 | 0.34 | 25 | 3 | SB09 |
| 11-1361 | 14:27:44.1 | 34:58:34.4 | 1 | 0.1287 | 13.01 | 12.91 | 12.86 | 12.10 | 0.48 | 25 | 5 | |
| 11-1732 | 14:28:55.5 | 35:04:56.7 | 3 | 0.1210 | 13.12 | 12.83 | 12.76 | 12.17 | 0.49 | 25 | 4 | SB09 |
| 12-1734 | 14:29:28.2 | 35:37:53.5 | 1 | 0.1164 | 13.27 | 13.23 | 13.34 | 12.93 | 0.3 | 25 | 3 | SB09 |
| 13-3813 | 14:32:29.1 | 32:46:20.0 | 2 | 0.0850 | 12.57 | 12.63 | 12.55 | 12.40 | 0.3 | 25 | 3 | SB09 |
| 14-1027 | 14:30:27.7 | 33:02:29.9 | 1 | 0.1336 | 13.76 | 13.68 | 13.75 | 13.38 | 0.3 | 25 | 3 | |
| 14-1401 | 14:31:34.8 | 33:06:18.5 | 3 | 0.0984 | 13.17 | 13.19 | 13.26 | 12.72 | 0.3 | 25 | 3 | W08; SB09 |
| 16-584 | 14:32:51.4 | 34:07:26.6 | 1 | 0.1269 | 13.32 | 13.21 | 13.19 | 12.96 | 0.3 | 25 | 4 | |
| 16-650 | 14:31:30.8 | 34:08:09.1 | 1 | 0.1282 | 12.78 | 12.72 | 12.74 | 12.63 | 0.3 | 25 | 3 | SB09 |
| 16-1302 | 14:30:55.7 | 34:14:28.2 | 2 | 0.0843 | 12.22 | 12.22 | 12.27 | 11.25 | 0.59 | 25 | 6 | W08; SB09 |
| 17-596 | 14:31:54.0 | 34:42:10.7 | 3 | 0.0840 | 11.97 | 12.00 | 11.90 | 11.73 | 0.3 | 25 | 1 | pair with 17-681; W08; SB09 |
| 17-681 | 14:31:55.3 | 34:42:40.6 | 3 | 0.0831 | 12.18 | 12.18 | 12.10 | 11.86 | 0.49 | 25 | 5 | pair with 17-596; W08; SB09 |
| 17-2134 | 14:30:48.3 | 34:56:06.0 | 2 | 0.0843 | 12.60 | 12.52 | 12.14 | 9.70 | 9.32 | 203 | 100 | W08; SB09 |
| 17-2819 | 14:32:16.8 | 35:02:48.9 | 1 | 0.1282 | 13.52 | 13.41 | 13.37 | 12.80 | 0.3 | 25 | 4 | |
| 18-476 | 14:32:03.5 | 35:16:23.5 | 1 | 0.0986 | 13.32 | 13.31 | 13.45 | 13.38 | 0.3 | 25 | 3 | |
| 18-794 | 14:31:12.8 | 35:19:55.1 | 1 | 0.0327 | 11.35 | 11.41 | 11.31 | 11.19 | 0.35 | 25 | 3 | |
| 19-2206 | 14:35:41.8 | 33:08:20.1 | 3 | 0.1210 | 12.60 | 12.47 | 12.46 | 12.30 | 0.3 | 25 | 3 | pair with 19-2242; W08; SB09 |
| 19-2242 | 14:35:42.4 | 33:08:22.4 | 3 | 0.1205 | 13.48 | 13.37 | 13.35 | 13.06 | 0.3 | 25 | 3 | pair with 19-2206; W08; SB09 |
| 20-2319 | 14:34:29.7 | 33:47:25.6 | 1 | 0.1238 | 13.51 | 13.46 | 13.48 | 13.19 | 0.3 | 25 | 3 | |
| 20-2395 | 14:33:37.5 | 33:48:13.8 | 1 | 0.1190 | 12.67 | 12.59 | 12.37 | 10.69 | 3.49 | 54 | 37 | |
| 21-523 | 14:33:56.8 | 34:09:00.7 | 2 | 0.1257 | 13.71 | 13.65 | 13.79 | 13.55 | 0.3 | 25 | 4 | |
| 21-837 | 14:33:51.6 | 34:13:01.2 | 2 | 0.1225 | 13.30 | 13.26 | 13.30 | 12.65 | 0.3 | 25 | 3 | |
| 22-790 | 14:33:27.1 | 34:43:42.1 | 1 | 0.0846 | 12.44 | 12.42 | 12.35 | 11.77 | 0.86 | 25 | 9 | W08; SB09 |
| 22-2252 | 14:33:37.5 | 34:58:23.2 | 3 | 0.1561 | 13.75 | 13.67 | 13.66 | 12.32 | 0.62 | 25 | 7 | W08 |
| 23-1585 | 14:33:12.2 | 35:30:04.8 | 1 | 0.0839 | 13.30 | 13.32 | 13.35 | 13.23 | 0.3 | 25 | 3 | W08 |
| 23-2937 | 14:34:49.1 | 35:42:47.3 | 1 | 0.1520 | 12.98 | 12.86 | 12.91 | 12.48 | 0.47 | 25 | 4 | |
| 25-1980 | 14:37:07.1 | 34:18:50.7 | 1 | 0.1220 | 11.94 | 11.94 | 11.92 | 11.85 | 0.3 | 25 | 2 | W08 |
| 25-3572 | 14:37:21.9 | 34:34:56.0 | 1 | 13.33 | 13.28 | 13.06 | 12.64 | 0.3 | 25 | 3 | ||
| 26-2558 | 14:36:42.0 | 34:55:14.5 | 3 | 0.1509 | 13.10 | 12.99 | 13.09 | 12.40 | 0.3 | 25 | 2 | |
| 26-4396 | 14:38:08.4 | 35:10:00.2 | 1 | 0.0830 | 13.27 | 13.28 | 13.20 | 13.31 | 0.3 | 25 | 3 | |
| 27-984 | 14:36:10.2 | 35:21:06.6 | 2 | 0.0852 | 13.82 | 13.84 | 13.89 | 13.29 | 0.3 | 25 | 3 | |
| 27-3444 | 14:37:20.3 | 35:38:16.7 | 1 | 0.1593 | 13.16 | 13.03 | 13.02 | 12.50 | 0.41 | 25 | 3 | W08 |
Note. — Subset of red galaxies from vd05 which are early type and have tidal features. Redshifts are from SDSS DR7 and/or SB09. The IRAC magnitudes are SExtractor AUTO magnitudes. The MIPS fluxes are PSF-fitted total fluxes. All limits are 5. If W08 appears in the remarks, the source was included in the HST study of Whitaker & van Dokkum (2008).
| Object | metallicity | age | SFRIR | SFRspec | SDSS class | SB09 class | SDSS M∗ | Mdust | |
| Gyr | M⊙ yr-1 | M⊙ yr-1 | 1010 M⊙ | 105 M⊙ | |||||
| 1-2874 | 0.1 | 0.008 | 9.88 | 0.8 | No emission | 21 | |||
| 2-368 | 0.3 | 0.02 (Z⊙) | 9.97 | 0.8 | 21 | ||||
| 3-601 | 0.3 | 0.008 | 9.87 | 0.9 | ? | 13 | |||
| 4-1190 | 0.1 | 0.02 (Z⊙) | 9.88 | 1.1 | 18 | ||||
| 4-1975 | 0.1 | 0.02 (Z⊙) | 9.90 | 1.2 | 0.2 | -1 | 8 | 19 | |
| 4-2713 | 0.1 | 0.008 | 9.94 | 0.5 | 0.3 | 2 | 5 | 15 | |
| 5-901 | 0.1 | 0.02 (Z⊙) | 9.90 | 0.3 | 0.2 | 4 | 3 | 10 | |
| 5-994 | 0.1 | 0.02 (Z⊙) | 9.91 | 0.2 | 0.3 | 4 | ? | 11 | 7 |
| 5-1271 | 0.1 | 0.02 (Z⊙) | 10.30 | 2.3 | 3.8 | 4 | 13 | 42 | |
| 6-1553 | 0.3 | 0.02 (Z⊙) | 9.98 | 0.0 | 0.0 | -1 | ? | 2 | 3 |
| 6-1676 | 0.1 | 0.02 (Z⊙) | 9.91 | 0.7 | 0.4 | -1 | Seyfert | 8 | 19 |
| 7-471 | 0.1 | 0.02 (Z⊙) | 9.92 | 0.8 | 21 | ||||
| 7-2322 | 0.1 | 0.02 (Z⊙) | 9.93 | 0.5 | ? | 16 | |||
| 7-4247 | 0.1 | 0.02 (Z⊙) | 9.98 | 0.9 | 14 | ||||
| 8-2119 | 0.1 | 0.02 (Z⊙) | 10.26 | 1.9 | LINER/Seyfert | 32 | |||
| 9-360 | 0.1 | 0.02 (Z⊙) | 9.89 | 1.0 | 17 | ||||
| 9-2105 | 0.1 | 0.02 (Z⊙) | 10.30 | 1.8 | ? | 31 | |||
| 9-2966 | 0.1 | 0.02 (Z⊙) | 9.96 | 0.8 | 13 | ||||
| 9-3079 | 0.1 | 0.02 (Z⊙) | 9.98 | 0.4 | No emission | 11 | |||
| 10-112 | 3.0 | 0.02 (Z⊙) | 10.02 | 2.3 | LINER | 37 | |||
| 10-232 | 5.0 | 0.02 (Z⊙) | 9.97 | 3.4 | 1.2 | 4 | Seyfert | 7 | 45 |
| 11-962 | 0.3 | 0.02 (Z⊙) | 9.92 | 2.3 | 0.4 | -1 | 28 | 34 | |
| 11-1278 | 0.1 | 0.02 (Z⊙) | 9.87 | 0.3 | 0.2 | 4 | ? | 7 | 10 |
| 11-1361 | 0.1 | 0.02 (Z⊙) | 9.88 | 1.1 | 1.2 | 2 | 16 | 19 | |
| 11-1732 | 0.1 | 0.02 (Z⊙) | 9.84 | 0.9 | 3.7 | 4 | LINER | 14 | 15 |
| 12-1734 | 0.1 | 0.02 (Z⊙) | 10.30 | 0.6 | 0.3 | -1 | No emission | 6 | 19 |
| 13-3813 | 0.3 | 0.02 (Z⊙) | 9.93 | 0.3 | No emission | 10 | |||
| 14-1027 | 0.3 | 0.008 | 9.91 | 0.8 | 13 | ||||
| 14-1401 | 0.1 | 0.02 (Z⊙) | 9.93 | 0.4 | Seyfert | 14 | |||
| 16-584 | 0.1 | 0.02 (Z⊙) | 9.91 | 0.7 | 21 | ||||
| 16-650 | 0.1 | 0.02 (Z⊙) | 9.88 | 0.7 | 0.6 | -1 | ? | 23 | 18 |
| 16-1302 | 0.1 | 0.02 (Z⊙) | 9.90 | 0.5 | 0.3 | 4 | ? | 16 | 19 |
| 17-596 | 0.1 | 0.02 (Z⊙) | 9.87 | 0.2 | No emission | 7 | |||
| 17-681 | 3.0 | 0.02 (Z⊙) | 10.03 | 0.4 | 0.1 | -1 | No emission | 16 | 14 |
| 17-2134 | 0.1 | 0.02 (Z⊙) | 10.28 | 7.0 | 1.4 | 3 | ? | 13 | 104 |
| 17-2819 | 5.0 | 0.02 (Z⊙) | 9.93 | 0.7 | 0.4 | 4 | 11 | 21 | |
| 18-476 | 0.1 | 0.008 | 9.94 | 0.4 | 0.1 | -1 | 6 | 14 | |
| 18-794 | 0.1 | 0.02 (Z⊙) | 9.90 | 0.0 | 0.1 | -1 | 5 | 3 | |
| 19-2206 | 0.3 | 0.02 (Z⊙) | 9.93 | 0.5 | LINER | 18 | |||
| 19-2242 | 0.1 | 0.02 (Z⊙) | 9.98 | 0.6 | No emission | 18 | |||
| 20-2319 | 0.1 | 0.008 | 9.88 | 0.7 | 0.5 | -1 | 8 | 18 | |
| 20-2395 | 2.0 | 0.02 (Z⊙) | 10.03 | 5.7 | 79 | ||||
| 21-523 | 0.1 | 0.008 | 9.91 | 0.7 | 0.0 | -1 | 6 | 21 | |
| 21-837 | 5.0 | 0.02 (Z⊙) | 9.94 | 0.7 | 0.5 | -1 | 11 | 18 | |
| 22-790 | 3.0 | 0.02 (Z⊙) | 10.02 | 0.8 | 0.7 | -1 | No emission | 15 | 24 |
| 22-2252 | 5.0 | 0.02 (Z⊙) | 9.94 | 2.3 | 2.7 | 2 | 11 | 39 | |
| 23-1585 | 0.1 | 0.008 | 9.93 | 0.3 | 0.1 | -1 | 4 | 12 | |
| 23-2937 | 5.0 | 0.02 (Z⊙) | 9.95 | 1.5 | 0.7 | 4 | 25 | 23 | |
| 25-1980 | 3.0 | 0.02 (Z⊙) | 10.00 | 0.4 | 0.6 | 4 | 43 | 11 | |
| 25-3572 | 0.1 | 0.02 (Z⊙) | 10.29 | 0.4 | |||||
| 26-2558 | 0.1 | 0.008 | 9.93 | 0.9 | 0.3 | -1 | 24 | 14 | |
| 26-4396 | 0.3 | 0.02 (Z⊙) | 9.55 | 0.3 | 0.0 | -1 | 4 | 12 | |
| 27-984 | 0.1 | 0.02 (Z⊙) | 9.89 | 0.3 | 0.2 | 2 | 4 | 12 | |
| 27-3444 | 0.1 | 0.02 (Z⊙) | 10.00 | 1.5 | 2.5 | -1 | 23 | 23 |
Note. — Subset of red galaxies from vD05 which are early type and have tidal features. The values of , metallicity, and age are the results of the best-fitting BC03 models to the SEDs, while SFRIR is derived from the MIPS 24 point. These SED-derived quantities are described in Section 3. The SFRspec is derived from the SDSS DR4 spectrum, as described in Brinchmann et al. (2004). The SDSS class also comes from Brinchmann et al. (2004) and is decoded as follows: 1 = SF, 2 = Low S/N SF, 3 = composite, 4= AGN, -1 = Unclassifiable. See Section 6.2 for more details. The SB09 class is based on [OII]3727, H, and [OIII]5007 measurements made by Sánchez-Blázquez et al. (2009). The dust mass is derived as described in Section 8.