ENERGY SPECTRUM OF NONTHERMAL ELECTRONS ACCELERATED AT A PLANE SHOCK
Abstract
We calculate the energy spectra of cosmic ray (CR) protons and electrons at a plane shock with quasi-parallel magnetic fields, using time-dependent, diffusive shock acceleration (DSA) simulations, including energy losses via synchrotron emission and Inverse Compton (IC) scattering. A thermal leakage injection model and a Bohm type diffusion coefficient are adopted. The electron spectrum at the shock becomes steady after the DSA energy gains balance the synchrotron/IC losses, and it cuts off at the equilibrium momentum . In the postshock region the cutoff momentum of the electron spectrum decreases with the distance from the shock due to the energy losses and the thickness of the spatial distribution of electrons scales as . Thus the slope of the downstream integrated spectrum steepens by one power of for , where the break momentum decrease with the shock age as . In a CR modified shock, both the proton and electron spectrum exhibit a concave curvature and deviate from the canonical test-particle power-law, and the upstream integrated electron spectrum could dominate over the downstream integrated spectrum near the cutoff momentum. Thus the spectral shape near the cutoff of X-ray synchrotron emission could reveal a signature of nonlinear DSA.
1 INTRODUCTION
Diffusive shock acceleration (DSA) is widely accepted as the primary mechanism through which cosmic rays (CRs) are produced in a variety of astrophysical environments (Blandford & Eichler 1987; Drury 1983). Detailed nonlinear treatments of DSA predict that a small fraction of incoming thermal particles can be injected into the CR population, and accelerated to very high energies through their interactions with resonantly scattering Alfvén waves in the converging flows across collisionless shocks (e.g. Berezhko, Ksenofontov & Völk 2002, 2009; Kang et al. 2002).
Since DSA operates on relativistic particles with the same rigidity () in exactly the same manner, both electrons and protons are expected to be accelerated at shocks. Indeed, multi-band observations of nonthermal radio to -ray emissions from several supernova remnants have confirmed the acceleration of CR electrons and protons up to 100 TeV (e.g. Völk, Berezhko, & Ksenofontov 2005; Parizot et al. 2006; Abdo et al. 2010). On the other hand, postshock thermal electrons need to be pre-accelerated before they can be injected into Fermi process, since electrons have smaller gyroradius than protons by a factor of (Reynods 2008). This results in a much smaller injection rate for electrons, i.e., the CR electron-to-proton ratio is estimated to be , which is not yet constrained accurately by plasma physics. Moreover, electrons lose energy primarily by synchrotron emission and Inverse Compton (IC) scattering, and so their energy spectrum has a cutoff much lower than that of the proton spectrum.
In a strong, non-relativistic shock, DSA theory predicts that the power-law distribution function for electrons, with , which translates into the synchrotron flux, with . For a unresolved, optically-thin source, we should observe the volume integrated emission spectrum that steepens to , because the volume integrated electron spectrum steepens to above a break momentum, , due to synchrotron/IC losses. Such characteristics of nonthermal electrons and their synchrotron emission have been explored extensively in several previous studies (e.g. Webb et al. 1984; Heavens & Meisenheimer 1987; Berezhko, Ksenofontov & Völk 2002; Zirakashvili & Aharonian 2007).
Webb et al. (1984) and Heavens & Meisenheimer (1987) considered steady-state solutions for the electron spectrum accelerated at a plane shock in the case of constant, momentum-independent diffusion coefficient, while Zirakashvili & Aharonian (2007) generalize it to the case of momentum-dependent diffusion coefficient. In the present paper, we performed time-dependent numerical simulations in which DSA of protons and electrons are followed along with synchrotron/IC losses for the shock parameters relevant for typical young supernova remnants (SNRs). A thermal leakage injection model and a Bohm-type diffusion coefficient () are adopted. Even though the CR proton spectrum extends to ever higher momentum with time, the electron spectrum at the shock approaches to time-asymptotic states and can be compared with the steady-state solution of Zirakashvili & Aharonian (2007). We also demonstrate how the nonlinear feedback of the CR pressure affects the electron spectrum in a CR modified shock.
In the next section we describe the numerical method and model parameters. Some analytic estimates for the various features in the electron spectrum will be presented in Section 3. The simulation results will be discussed in Section 4, followed by a brief summary in Section 5.
2 NUMERICAL METHOD
2.1 CRASH code for DSA
Here we consider the CR acceleration at quasi-parallel shocks where the magnetic field lines are parallel to the shock normal. So we solve the standard gasdynamic equations with CR proton pressure terms added in the conservative, Eulerian formulation for one dimensional plane-parallel geometry. The basic gasdynamic equations and details of the CRASH (Cosmic-Ray Amr SHock) code for one-dimensional plane-parallel geometry can be found in (Kang et al. 2002).
We solve the following diffusion-convection equations for the pitch-angle-averaged phase space distribution function for CR protons, , and for CR electron, (Skilling 1975):
| (1) |
| (2) |
where , , . Here the particle momentum is expressed in units of and so the spatial diffusion coefficient, , has the same form for both protons and electrons. The cooling term takes account for electron synchrotron/IC losses.
The velocity represents the effective relative motion of scattering centers with respect to the bulk flow velocity, . The mean wave speed is set to the Alfvén speed, i.e., in the upstream region. This term reflects the fact that the scattering by Alfvén waves tends to isotropize the CR distribution in the wave frame rather than the gas frame (Bell 1978). In the postshock region, is assumed, since the Alfvénic turbulence in that region is probably relatively balanced (Jones 1993). This reduces the velocity difference between upstream and downstream scattering centers compared to the bulk flow, leading to less efficient DSA. Hereafter we use the subscripts ’0’, ’1’, and ’2’ to denote conditions far upstream of the shock, immediately upstream of the gas subshock and immediately downstream of the subshock, respectively.
The dynamical effects of the CR proton pressure are included in the DSA simulations, while the CR electrons are treated as test-particles. In equations (1) and (2) the spatial advection terms are solved by the wave-propagation algorithm, while the diffusion term is solved by the Crank-Nicholson scheme (Kang et al. 2002).
The radiative cooling term in equation (2) is treated by the operator splitting method, in which the following advection equation in the momentum space is solved:
| (3) |
where the advection speed is . Here the synchrotron cooling constant is defined as (in cgs units), and is the “effective” magnetic field strength and is the energy density of ambient radiation field (Longair 1994). The downward advection in momentum introduces an additional Courant condition for time step, .
2.2 Model Parameters
Here we consider a plane-parallel shock with , propagating into the upstream medium with the following properties: gas temperature, K, sound speed, (sonic Mach number, ), and hydrogen number density, . Because high-resolution X-ray observations of several young SNRs indicate the presence of magnetic fields as strong as a few G downstream of the shock (e.g., Parizot et al.2006), we adopt for the upstream field strength, which is stronger than the mean ISM field of 5-8 . The upstream Alfvén speed is (Alfvénic Mach number, ) and so . This set of parameters may represent young supernova remnants in the hot interstellar medium with self-amplified magnetic fields (Kang 2010).
The physical quantities are normalized, both in the numerical code and in the plots below, by the following constants:
Note that the calculations depend on the density only through Alfvén speed. So for the cases where Alfvénic drift is ignored, the density parameter is arbitrary.
Since we consider only quasi-parallel shocks, the magnetic field is passive in the simulations. However, theoretical studies have shown that efficient magnetic field amplification via resonant and non-resonant wave-particle interactions is an integral part of DSA (Lucek & Bell 2000, Bell 2004), and the evolution of magnetic field strength is important in modeling the diffusion coefficient and synchrotron cooling. For simplicity, we assume the local magnetic field strength scales with gas density as , which represents enhancement of resonant Alfvén wave amplitudes through compression.
We adopt a Bohm-type diffusion coefficient that includes a weaker non-relativistic momentum dependence,
| (4) |
where the coefficient . The density dependence approximately accounts for the compressive amplification of Alfvén waves.
Also we adopt a phenomenological injection model, in which particles above a certain injection momentum cross the shock and get injected to the CR population (Kang et al. 2002). The “effective” injection momentum can be approximated by
| (5) |
where is the thermal peak momentum of the immediate postshock gas with temperature and is the Boltzmann constant (Kang & Ryu 2010). One free parameter controls this function; , the ratio of the general magnetic field along the shock normal, , to the amplitude of the postshock MHD wave turbulence, . Since we are not interested in the absolute amplitude of the electron spectrum in this study, protons and electrons are injected in the same manner in the simulations, ignoring the fact that postshock thermal electrons have a much smaller gyroradius. In other words, we take effectively the electron-to-proton ratio, .
3 ANALYTIC ESTIMATES
3.1 Basics of Diffusive Shock Acceleration
In the test-particle regime of DSA theory, the postshock CR spectrum takes the power-law form of , where the spectral index, , depends on the velocity jump across the shock:
| (6) |
where and are the upstream and downstream speed, respectively. Alfvénic drift of self-generated waves in the upstream region reduces the velocity jump that the particles experience across the shock, which in turn softens the CR spectrum beyond the canonical test-particle slope.
The mean acceleration time for a particle to reach from an injection momentum in the test-particle limit of DSA theory is given by (Drury 1983)
| (7) |
Then the mean acceleration time scale is estimated by
| (8) |
where , is the shock compression ratio, and is Alfvén Mach number (Kang & Ryu 2010). In the limit of large , the factor , and for . So the maximum momentum accelerated by the shock age of can be estimated as , which represents the cutoff momentum in the proton spectrum. For typical supernova remnant shocks, it becomes
| (9) |
3.2 Radiative Cooling
Relativistic electrons lose energy primarily through combined synchrotron and IC radiation with the cooling rate . So the cooling time scale is
| (10) |
This can be rewritten in term of the electron Lorentz factor, as
| (11) |
The electron cutoff energy can be estimated from the equilibrium condition that the momentum gain per cycle by DSA is equal to the synchrotron/IC loss per cycle, i.e., =0. Following the derivation given by Webb et al. (1984),
| (12) |
| (13) |
where is the particle velocity, and and . The upstream and downstream residence time per cycle are and , respectively. For , the equilibrium momentum for electrons is given in cgs units by
| (14) |
If we assume , , , , , this becomes
| (15) |
which does not depend on the shock age unlike the proton cutoff momentum .
For the DSA momentum gain is much larger than the radiative losses, so electrons and protons are accelerated in almost the same manner until the radiative loss balances the DSA gain. This occurs at the equilibrium time, , after which the electron spectrum at the shock becomes steady and cuts off at . Using equations (8) and (15) with , it gives
| (16) |
Figure 1 shows the evolution of the proton and electron spectrum at the shock position from the test-particle DSA simulation (see next section for details). The electron cutoff momentum asymptotes to after , a few times longer than , while the proton maximum momentum continues to increase with time as . For , the distribution function, and evolve in exactly the same way, as expected.

Using equation (15), we can estimate the characteristic synchrotron frequency of electrons with as
| (17) |
which depends only on the shock speed. So the turn-over frequency of X-ray synchrotron emission from SNRs provides a measure of the shock speed, but not the magnetic field strength directly.
Zirakashvili & Aharonian (2007) suggested that the electron spectrum at the shock position for a steady-state plane shock can be approximated by
| (18) |
in the case of Bohm diffusion with and . Their cutoff momentum is given by
| (19) |
which is similar to, but not the same as, in equation (15),
At the shock the electron spectrum cuts off at , but in the postshock region electrons lose energy while being advected downstream, and so the electron cutoff momentum moves downward in the momentum space. The cutoff momentum, , at the distance downstream from the shock is given by
| (20) |
where . In the limit of , the cutoff momentum of the electron spectrum decreases away from the shock as . This implies that the thickness of the spatial distribution of electrons with momentum decrease as .
At the shock age , the electron spectrum at the furthest downstream point () has the cutoff at . This gives
| (21) |
which depends only on the postshock magnetic field strength and the shock age, but not on the shock speed. If the electron distribution function at the shock has the form, for , then the downstream integrated electron spectrum is given by
| (22) |
for , which was also shown in previous studies (e.g. Heavens & Meisenheimer 1987; Zirakashvili & Aharonian 2007).
4 DSA SIMULATION RESULTS
4.1 Test-Particle Case
In order to make a direct comparison between the analytic estimates and the DSA simulation results, we first consider a test-particle case, in which the dynamical feedback of the CR pressure is ignored. So the shock structure is determined by the canonical shock jump conditions. The injection parameter, is adopted and the Alfvénic drift is ignored (i.e., ) for this case.
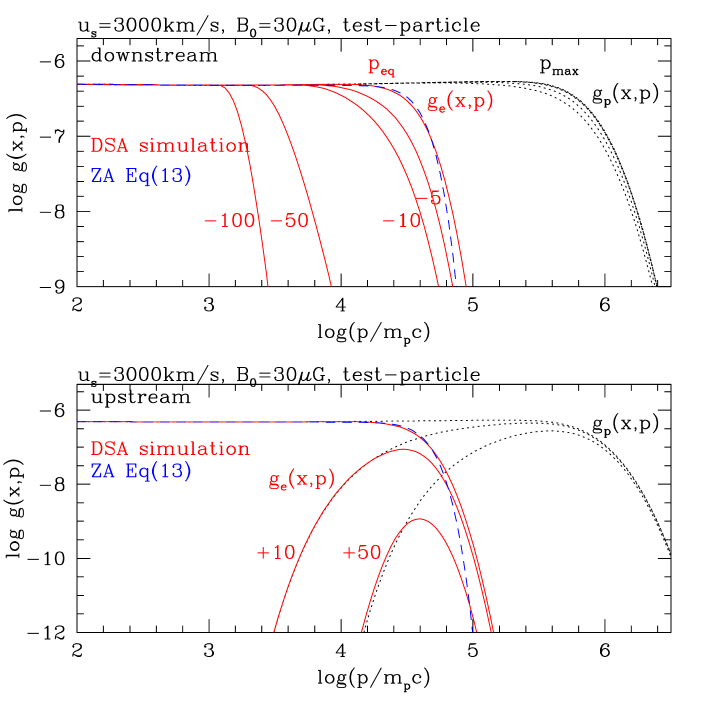
Figure 2 shows the proton and electron spectra at different locations at . It shows that the cutoff momentum for the proton spectrum is (Eq. [9]), while that for the electron spectrum at the shock is (Eq. [15]). For comparison, we also show the analytic form in equation (18) suggested by Zirakashvili & Aharonian (2007), which agrees well with the simulated electron spectrum at the shock, especially near the exponential cutoff.
The DSA operates efficiently only within a diffusion length, , from the shock. Far behind the shock radiative cooling of electrons dominates over DSA, so the function shifts downward in space in a manner approximately described by the advection equation in (3). Because the advection speed depends on electron momentum as , the shape of the cutoff steepens as we move downstream from the shock. So the electron spectrum well behind shock cannot be approximated by a simple analytic form such as a power-law with a Gaussian exponential cutoff. Heavens & Meisenheimer (1987) also observed the same trend in the electron spectrum behind a steady-state plane shock in the case of constant magnetic field strength and momentum-independent diffusion coefficient (i.e., and ). According to equation (20) the cutoff momentum is estimated to be at 100, 50, 10, 5 grid zones, respectively, downstream from the shock. These estimates match well the simulated electron spectra, as can be seen in Figure 2.
In upstream region, only the highest energy particles diffuse away from the shock, while low energy particles are swept downstream. So there the proton spectrum has a peak at , while the electron spectrum has a peak at , as can be seen in the bottom panel of Figure 2. The upstream electron spectrum has the same exponential cutoff at as the spectrum at the shock. Again the electron spectrum has the same shape as the proton spectrum for .
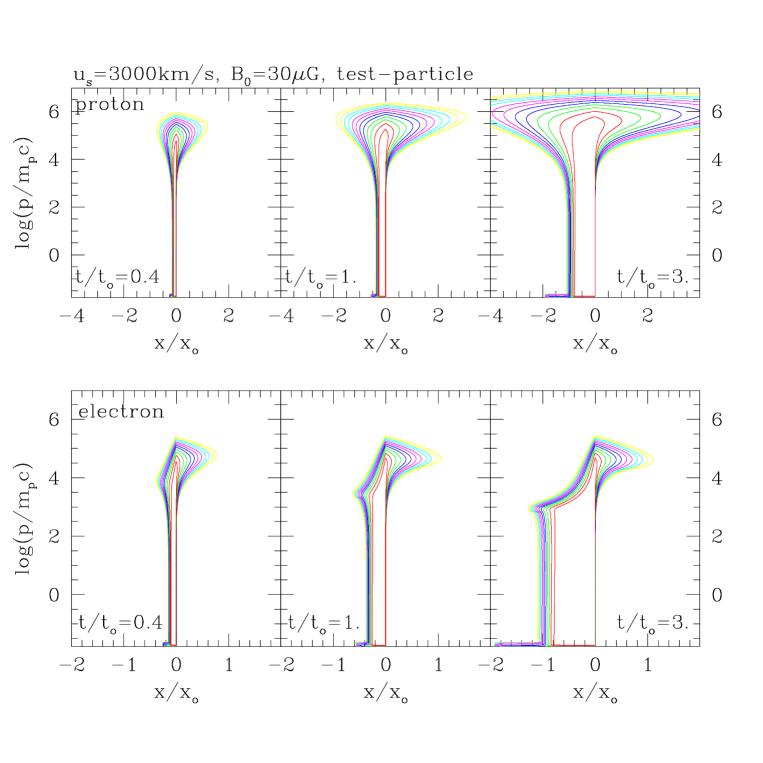
Figure 3 shows the evolution of the phase-space distribution of and for the test-particle case. At low energy, , electron cooling is not important and so protons and electrons have the same distribution. At higher energy, electrons have much narrower distribution both in and space due to radiative cooling. It also demonstrates that the spatial thickness of the electron distribution narrows down at higher momentum as in the postshock region, and that the cutoff momentum decreases as the downstream distance increases away from the shock. Although the postshock electron distribution extends downstream as the flow advects, the upstream electron distribution does not change after due to the balance between DSA and cooling. On the contrary, high energy protons diffuse much further both downstream and upstream as increases with time.
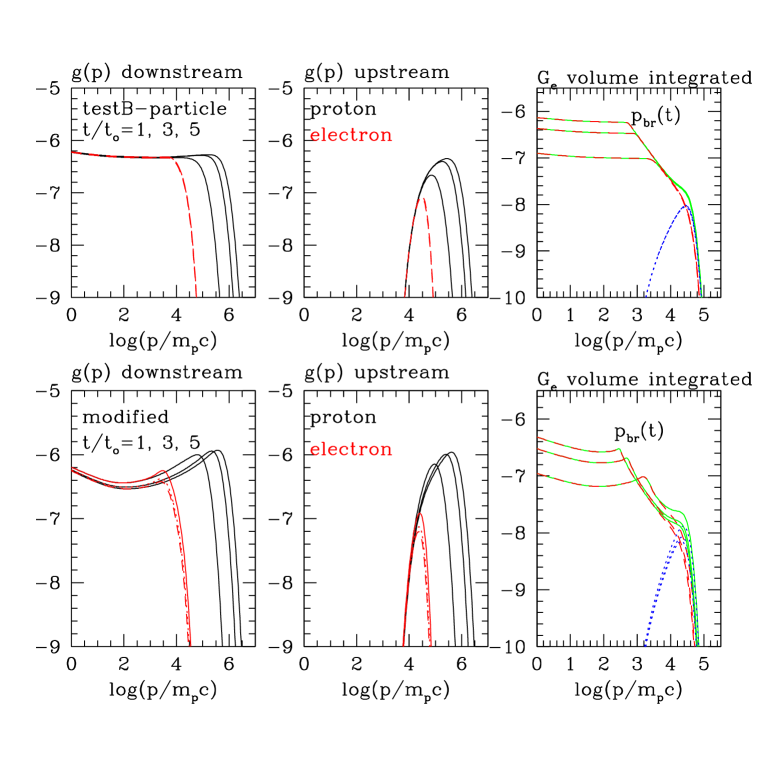
The top panels of Figure 4 show the evolution of and at the shock (right panel) and at a upstream position (middle panel) at . Because , so the electron spectrum has already reached the steady-state, as can be seen in the figure. In the right panel we also plot the downstream integrated electron spectrum, , the upstream integrated electron spectrum, . As discussed right after equation (16), (dashed lines) becomes a broken power-law which steepens from to above with an exponential cutoff at the higher momentum . We also see that the brake momentum decrease with time as . Note that the upstream integrated spectrum (dotted lines) has reached the steady-state, while, for , the amplitude of the downstream spectrum increase linearly with time as the flow advects downstream. Such a trend was seen in Figure 3 as well. Total volume integrated spectrum (solid lines) shows a small bump near the cutoff momentum due to the upstream contribution, which in turn will determine the exact shape of the cutoff of X-ray synchrotron emission.
4.2 CR Modified Case
With the injection parameter , the CR injection and acceleration is efficient enough to modify significantly the shock structure. The CR injection fraction becomes , and the postshock CR pressure is . So the postshock gas density, , is larger than for the gasdynamic shock. In such CR modified shocks, the pressure from CRs diffusing upstream compresses and decelerates the gas smoothly before it enters the subshock, creating a shock precursor (Kang & Jones 2007).
With the assumed momentum-dependent diffusion, , the particles of different momenta, , experience different compressions, depending on their diffusion length, . The particles just above sample mostly the compression across the subshock (), while those near experience the total compression across the entire shock structure (). This leads to the particle distribution function that behaves as for , but flattens gradually to toward (Kang et al. 2009).
The bottom panels of Figure 4 show the evolution of , at the shock position (left panel) and at a upstream location (middle panel) and the volume integrated (right panel) as discussed before. The Alfvénic drift with are considered. Because of the development of a smooth precursor and the weaker subshock, both and at the shock are softer than the test-particle power-law spectra at lower momenta , while they are harder at higher momenta with a cutoff at (proton spectrum) or (electron spectrum). Thus the CR spectrum exhibits the well-known concave curvature between the lowest and the highest momenta. Such concavity is reflected in the volume integrated spectrum as well, so is no longer a simple broken power-law as in the test-particle case.
With the greater velocity jump (), the acceleration is more efficient and so there are more highest energy particles in the upstream region, compared to the test-particle case. As a result, the upstream integrated spectrum, (dotted lines) has a more pronounced peak at , compared to the test-particle case. This introduces an additional curvature in the total spectrum. In fact, dominates over near , so the upstream contribution should determine the spectral shape of X-ray synchrotron emission. Thus the spectral slope in radio and the detail shape in X-ray of the observed synchrotron flux can provide a measure of nonlinear DSA feedback.
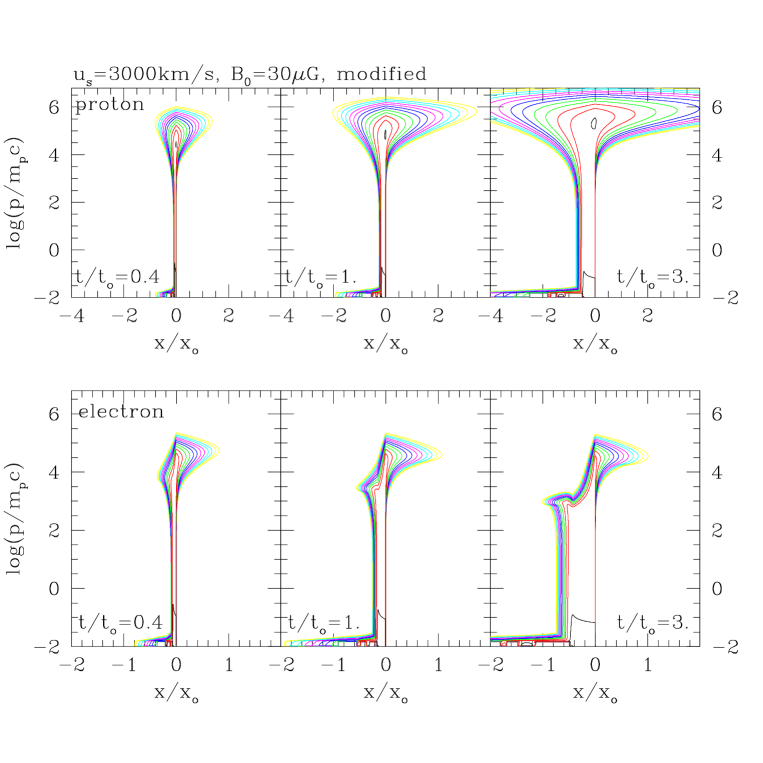
Finally, Figure 5 shows the phase-space distribution of and for the CR modified model with high injection rate. Because the postshock magnetic field strength, , is stronger, electrons cool down to lower energies, compared to the test-particle case shown in Figure 3. Enhanced cooling also reduces the thickness of the electron spatial distribution downstream of the shock. Again, we can see that at the highest energies of , the upstream electron components is more important than the downstream component.
5 SUMMARY
Using the kinetic simulations of diffusive shock acceleration at a plane shock, we calculate the time-dependent evolution of the CR proton and electron spectra, including electronic synchrotron/IC energy losses. Both protons and electrons are injected at the shock via thermal leakage injection and accelerated by DSA, while electrons are treated as test-particles. We adopt a momentum-dependent, Bohm-type diffusion coefficient and assume that the magnetic field strength scales with the gas density.
The proton spectrum at the shock, , and the volume-integrated proton spectrum, extends to in equation (9), which increases linearly with time. On the other hand, the electron spectrum at the shock, , approaches to the time-asymptotic spectrum for the shock age in equation (16) . In that regime, our time-dependent results with a Bohm-type diffusion are qualitatively consistent with the analytic solutions for a stead-state plane shock, which were previously presented by several authors such as Heavens & Meisenheimer (1987) with momentum-independent and Zirakashvili & Aharonian (2007) with momentum-dependent . So we will re-iterate some of the major findings discussed by those authors and add new insights obtained from our nonlinear DSA simulations.
1) First of all, we re-derive two characteristic momenta: the cutoff momentum, in equation (15) (for the Bohm-type diffusion coefficient) and the break momentum, in equation (21). Note that is a time-asymptotic quantity that is achieved when the DSA energy gain balances the synchrotron/IC energy losses, while is a time-dependent quantity that is determined by ’aging’ of electrons due to synchrotron/IC cooling downstream of the shock.
2) The time-asymptotic electron distribution function at the shock, , has a Gaussian cutoff as , which agrees well with the analytic form suggested by Zirakashvili & Aharonian (2007).
3) Behind the shock synchrotron/IC cooling dominates over DSA, so the electron spectrum, , cuts off at progressively lower , which decrease with the distance, , from the shock and is smaller than . This cutoff momentum is determined by the cooling rate , independent of DSA.
3) The electron cooling can be represented by the advection of the distribution function in space with the advection speed, (see Eq. [3]). This causes the electron spectrum, , cuts off more sharply as the distance downstream from the shock increases.
4) Because the synchrotron/IC cooling time decreases with momentum as , thickness of the electron distribution is inversely proportional to the momentum, i.e., . Then the electron spectrum integrated over to the downstream region steepens as for , when the spectrum at the shock is . The break momentum decreases with the shock age as (see Eq. [21]).
5) Only highest energy electrons diffuse upstream to the distance of , so the upstream integrated spectrum has a much harder spectrum than the downstream integrated spectrum and it peaks at .
6) For a CR modified shock, both proton and electron spectra exhibit the well-known concave curvatures. Thus the volume integrated spectrum, , cannot be represented by the canonical broken power-law spectrum. In this regime, the radio synchrotron index, , could be steeper than 0.5 even for a high sonic Mach number. Also in the case of small Alfvénic Mach number (i.e., large and small ), the spectral slope could be even steeper due to the Alfvénic drift effect. Moreover, detail analysis of the X-ray synchrotron emission near the cutoff frequency may provide some information about the effect of nonlinear DSA at shocks. Spectral characteristics of the synchrotron emission from a CR modified shock will be presented elsewhere.
ACKNOWLEDGMENTS This research was supported by Basic Science Research Program through the National Research Foundation of Korea (NRF) funded by the Ministry of Education, Science and Technology (2010-0016425).
References
- Abdo et al. (2010) Abdo, A. A. et al.2010, Gamma-Ray Emission from the Shell of Supernova Remnant W44 Revealed by the Fermi LAT, Science, 327, 1103
- Bell (1978) Bell, A. R. 1978, The acceleration of cosmic rays in shock fronts. I, MNRAS, 182, 147
- Berezhko, Ksenofontov & Völk (2002) Berezhko E. G., Ksenofontov L.T., Völk, H. J., 2002, Emission of SN 1006 produced by accelerated cosmic rays, A&A, 395, 943
- Berezhko, Ksenofontov & Völk (2009) Berezhko, E. G., Ksenofontov, L. T., & Völk, H. J. 2009, Cosmic ray acceleration parameters from multi-wavelength observations. The case of SN 1006, A&A, 505, 169
- Blandford & Eichler (1987) Blandford, R. D., and Eichler, D. 1987, Particle acceleration at astrophysical shocks - a theory of cosmic-ray origin, Phys. Rept., 154, 1
- Drury (1983) Drury, L. O’C. 1983, An introduction to the theory of diffusive shock acceleration of energetic particles in tenuous plasmas, Rept. Prog. Phys., 46, 973
- Heavens & Meisenheimer (1987) Heavens, A. F., & Meisenheimer, K., 1987 Particle Acceleration in extrgalactic sources: the role of synchrotron losses in determining the spectrum, MNRAS, 225, 335
- Jones (1993) Jones, T. W. Alfvén wave transport effects in the time evolution of parallel cosmic-ray-modified shocks, 1993, ApJ, 413, 619
- Kang (2010) Kang, H. 2010, Cosmic Ray Spectrum in Supernova Remnant Shocks, J. Korean Astronomical Society, 43, 25
- Kang et al. (2002) Kang, H., Jones, T. W., & Gieseler, U.D.J. 2002, Numerical Studies of Cosmic-Ray Injection and Acceleration, ApJ, 579, 337
- Kang & Jones (2007) Kang, H. & Jones, T. W. 2007, Self-similar evolution of cosmic-ray-modified quasi-parallel plane shocks, Astropart. Phys, 28, 232
- Kang et al. (2009) Kang, H., Ryu, D., Jones, T. W. 2009, Self-similar Evolution of Cosmic-ray Modified Shocks:The Cosmic-ray Spectrum, ApJ, 695, 1273
- Kang & Ryu (2010) Kang, H., & Ryu, D. 2010, Diffusive Shock Acceleration in Test-particle Regime, ApJ, 721, 886
- Longair (1994) Longair, M. S. 1994, High Energy Astrophysics, Volume 2, (Cambridge Univ. Press, Cambridge, 1994).
- Malkov & Drury (2001) Malkov M.A., & Drury, L.O’C. 2001, Nonlinear theory of diffusive acceleration of particles by shock waves, Rep. Progr. Phys. 64, 429
- Parizot et al. (2006) Parizot, E., Marcowith, A., Ballet, J., & Gallant, Y. A. 2006, Observational constraints on energetic particle diffusion in young supernovae remnants: amplified magnetic field and maximum energy, A&A, 453, 387
- Reynods (2008) Reynolds, S. P. 2008, Supernova Remnants at High Energy, ARA&A, 46, 89
- Skilling (1975) Skilling, J., 1975, Cosmic ray streaming. I - Effect of Alfvén waves on particles, MNRAS, 172, 557
- Völk, Berezhko, & Ksenofontov (2005) Völk, H. J., Berezhko, E. G., & Ksenofontov, L. T. 2005, Magnetic field amplification in Tycho and other shell-type supernova remnants, A&A, 433, 229
- Webb et al. (1984) Webb, G. M., Drury, L. O’C., & Biermann, P., 1984, Diffusive shock acceleration of energetic electrons subject to synchrotron losses, A&A, 137, 185
- Zirakashvili & Aharonian (2007) Zirakashvili V. N., Aharonian F. A., 2007, Analytical solutions for energy spectra of electrons accelerated by nonrelativistic shock-waves in shell type supernova remnants, A&A, 465, 695