PLUME DEVELOPMENT OF THE SHOEMAKER-LEVY 9 COMET IMPACT
Abstract
We have studied plume formation after a Jovian comet impact using the ZEUS-MP 2 hydrodynamics code. The three-dimensional models followed objects with 500, 750, and 1000 meter diameters. Our simulations show the development of a fast, upward-moving component of the plume in the wake of the impacting comet that “pinches off” from the bulk of the cometary material 50 km below the 1 bar pressure level, 100 km above the depth of greatest mass and energy deposition. The fast-moving component contains about twice the mass of the initial comet, but consists almost entirely (99.9%) of Jovian atmosphere rather than cometary material. The ejecta rise mainly along the impact trajectory, but an additional vertical velocity component due to buoyancy establishes itself within seconds of impact, leading to an asymmetry in the ejecta with respect to the entry trajectory. The mass of the upward-moving component follows a velocity distribution approximately proportional to ( for the 750 m and 500 m cases) in the velocity range km s-1.
Subject headings:
comets: individual (Shoemaker-Levy 9) – hydrodynamics – shock waves – methods: numerical1. INTRODUCTION
In July 1994, several fragments of comet Shoemaker-Levy 9 (SL9) impacted Jupiter, giving a unique opportunity for direct observation of a hypervelocity impact and its aftermath. The scientific community labeled it as “once in a lifetime event” because at that point the estimates for the probability of a similar event taking place suggested that decades or centuries might pass before it happens again. The 2009 July 19 impact discovered by A. Wesley (Hammel et al. 2010, Sánchez-Lavega et al. 2010) and the 2010 June 3 impact discovered by C. Go and A. Wesley (Hueso et al., 2010) indicate that Jupiter impacts happen much more frequently.
Harrington et al. (2004) give an overview of the phenomenology common to all the larger impacts. In the short but energetic entry phase the fragments entered Jupiter’s atmosphere at 45∘S latitude with an impact velocity of over 60 km s-1 and an impact angle of about 45∘ (Chodas & Yeomans, 1996). During entry, the impactors broke up and evaporated in 10 seconds (Korycansky et al., 2006), depositing most of their kinetic energy close to the terminal depth. Each impact created a low-density entry channel consisting of high-temperature Jovian air and impactor material (Mac Low & Zahnle, 1994; Zahnle & Mac Low, 1994, 1995; Crawford et al., 1995; Korycansky et al., 2006). This column of debris rose back up in the entry channel and expanded radially, generating shock waves. At higher altitudes, the plume rose ballistically, with the visible top of the debris reaching about 3000 km above the cloud tops (Hammel et al., 1995; Jessup et al., 2000). The plume then collapsed, compressing and heating itself and the upper atmosphere it encountered as it continued to expanded radially (Deming & Harrington, 2001).
Modeling the observed phenomena is difficult because the various stages of the process have time and length scales that differ by several orders of magnitude and the relevant physics and chemistry cannot be incorporated into a single model. Instead, modelers have simulated individual phases of the impact. Initial conditions for models of later phases (entry response, plume flight, plume splash) come from remapping the final state of the previous phase onto a larger grid. Zahnle & Mac Low (1994) and Crawford et al. (1995) chained the entry and the blowout phases in this manner, while Harrington & Deming (2001) and Deming & Harrington (2001) connected the plume flight and landing response phases using the same technique in a two-dimensional model. Exceptions to this practice are Takata et al. (1994) and Takata & Ahrens (1997), who used a smoothed particle hydrodynamics (SPH) model to include both the entry and the entry respond phases in their three-dimensional (3D) simulations. Harrington et al. (2004) give a more complete review of previous modeling efforts.
Since all subsequent phases depend on the entry, (Korycansky et al., 2006) performed high-resolution, 3D simulations, computing energy deposition profiles and terminal depths of various impactor types. In this paper, our investigation focuses on plume development in the immediate aftermath of an SL9 comet fragment’s entry.
2. MODEL DESCRIPTION
We modified the ZEUS-MP 2 hydrodynamics code (Hayes et al., 2006) for Jovian impacts, validating the modifications modifications with a series of tests. These included ZEUS-MP’s own hydrodynamic test suite (e.g. Sedov-Taylor blast wave, radiating shock waves) and our simulations matched their published data (Hayes et al., 2006). We also set up simulations to verify hydrostatic equilibrium and the long-term stability of the atmosphere over many sound-crossing times. Past work on atmospheric impacts (Korycansky et al., 2002) has found significant differences in results between 2D and 3D simulations. In particular geometrical constraints that operate in two dimensions (but not in three) tend to enforce global enstrophy conservation, which in turn forces a portion of the flow kinetic energy into large scales. Two-dimensional calculations thus show unrealistic amounts of large-scale structure (Khokhlov, 1994). Because of the qualitative differences between 2D and 3D fluid dynamics, 3D models provide more accurate results than those of the SL9 era.
In order to delay the remapping of variables to a second model as long as possible, we studied the plume’s genesis and its effect on the Jovian atmosphere by extending the grid of Korycansky et al. (2006) and continuing calculations beyond the 10 seconds of impactor destruction. The sensitivity tests of Korycansky et al. (2006) determined that having a higher resolution than 16 grid elements within the impactor’s radius (R16) did not result in significant changes in the impactor’s disruption mode or penetration depth, so we used R16 for the present models. The Cartesian coordinate system aligns with the initial trajectory of the impactor; is the along-track coordinate, is horizontal, and is perpendicular to the others. The 1 bar pressure level coincides with the origin of the x1 coordinate. Away from the high-resolution inner region that contains the impactor, the spacing increases by 4% per grid cell. A typical grid has a size of 4009090 km and has 430280280 grid elements. These numbers vary somewhat depending on the diameter of the impactor. The grid moves with the impactor to keep it in the high-resolution region, and stops when the comet is vaporized. When the grid stops, there is no undisturbed Jovian air along the track of the impactor and behind it. This allows us to model the acceleration and expansion of the plume as accurately as possible. Korycansky et al. (2006) provide a more-detailed description of the model.
3. RESULTS
Our nominal case is that of Korycansky et al. (2006), a 1 km diameter, 0.6 g cm-3, porous, spherical, ice impactor arriving at 44∘.02 S, at 61.46 km s-1, at a 42∘.09 impact angle. This case is likely larger than a typical SL9 fragment (Carlson et al., 1997) but it lets us compare our results to prior work.
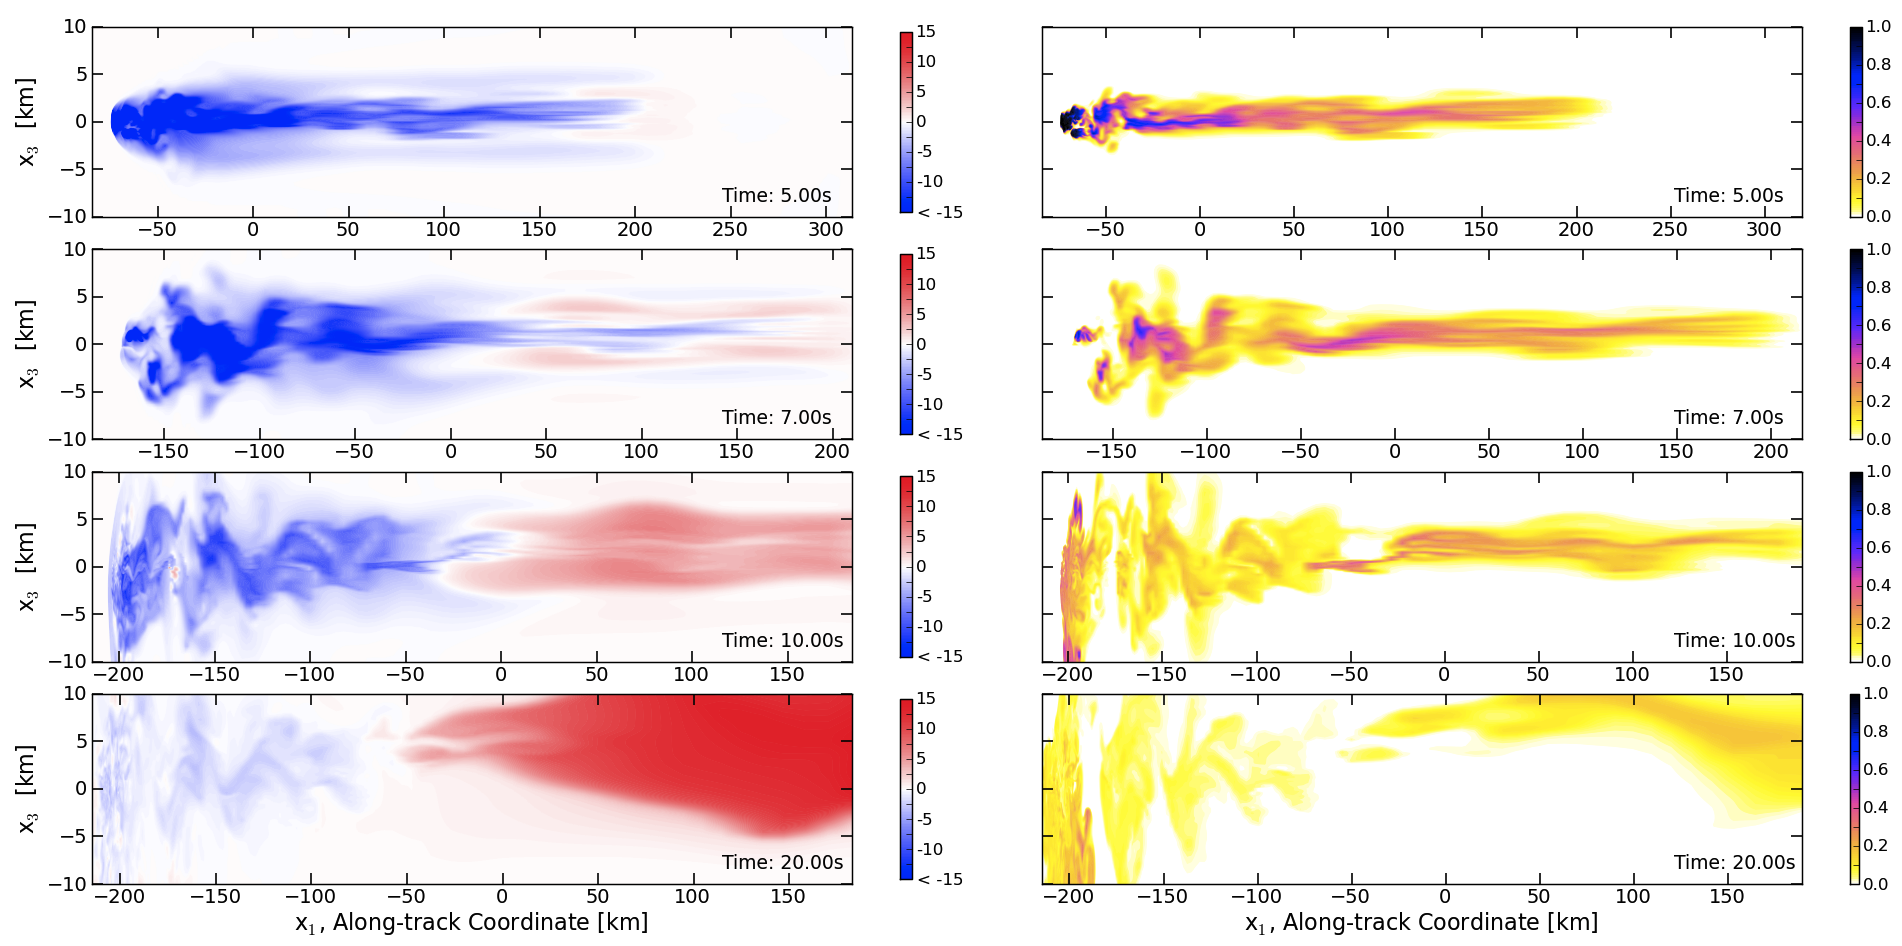
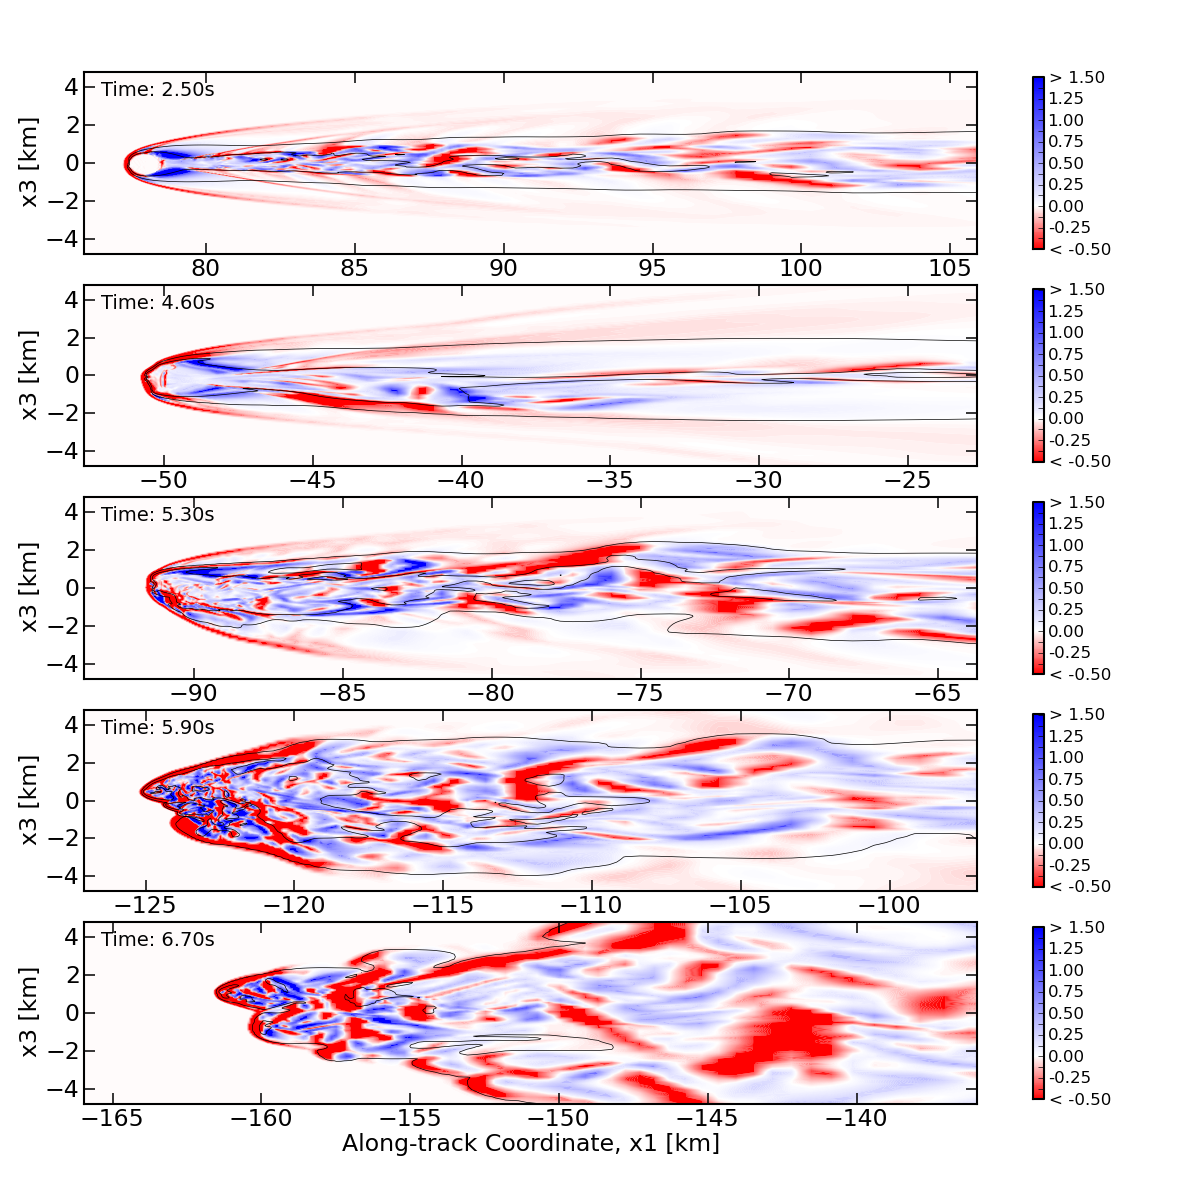
Figure 1. shows the impact and genesis of the plume. Initially, the shock structure behind the impactor (Figure 2.) limits the distribution of cometary material to the turbulent wake, so only a narrow trail of impactor debris remains in the entry channel. The breakup of the impactor begins at about 4.2 s into the simulation and at about 40–50 km below the 1 bar pressure level (distances indicate along-track values). This event disrupts the organized flow behind the main fragment, allowing for the spreading of impactor material perpendicular to the entry path and more vigorous mixing of debris and Jovian air as the impactor descends to greater depths.
The plume forms as upward velocities appear within the entry channel. At this point we find an interesting and important property of the plume: it “pinches off” at a certain depth. Below this level, the material rises independently and much slower. Almost all of the cometary material is below this level, and although most of the energy gets deposited near the terminal depth, this material only rises buoyantly. Most likely it cannot achieve ballistic ejection (see below). We associate the pinch-off level with the breakup level of the impactor and the disruption of the simple entry shock structure. The 500 m and 750 m impactors pinch off within about a scale height of the nominal case.
Based on their 2D experiments, Boslough et al. (1995) reported that using only the energy deposited by a 3 km diameter impactor above the -50 km level results in an almost identical fireball to that generated by using the full energy deposition curve. They concluded that the fireball growth depends mostly on the diameter of the impactor and the fact that several plumes reached the same height (Hammel et al., 1995) implies that the fragments that generated those plumes were the same size. In our simulations the plume detachment occurs at about the same depth that Boslough et al. (1995) used for the energy deposition cutoff, which strengthens the hypothesis that the energy deposition below this level (more than 99% of the total energy deposition) would not affect the buildup of the plume. However, in our models the 1 km, 750 m, and 500 m diameter impactors all broke up at similar altitudes and all of them generated ejection velocities of 12 km s-1 despite the factor of eight range of mass/kinetic energy and factor of four range in initial cross-section. Thus, the observed plume heights likely could have been achieved by different-sized impactors. We plan future studies to verify this.
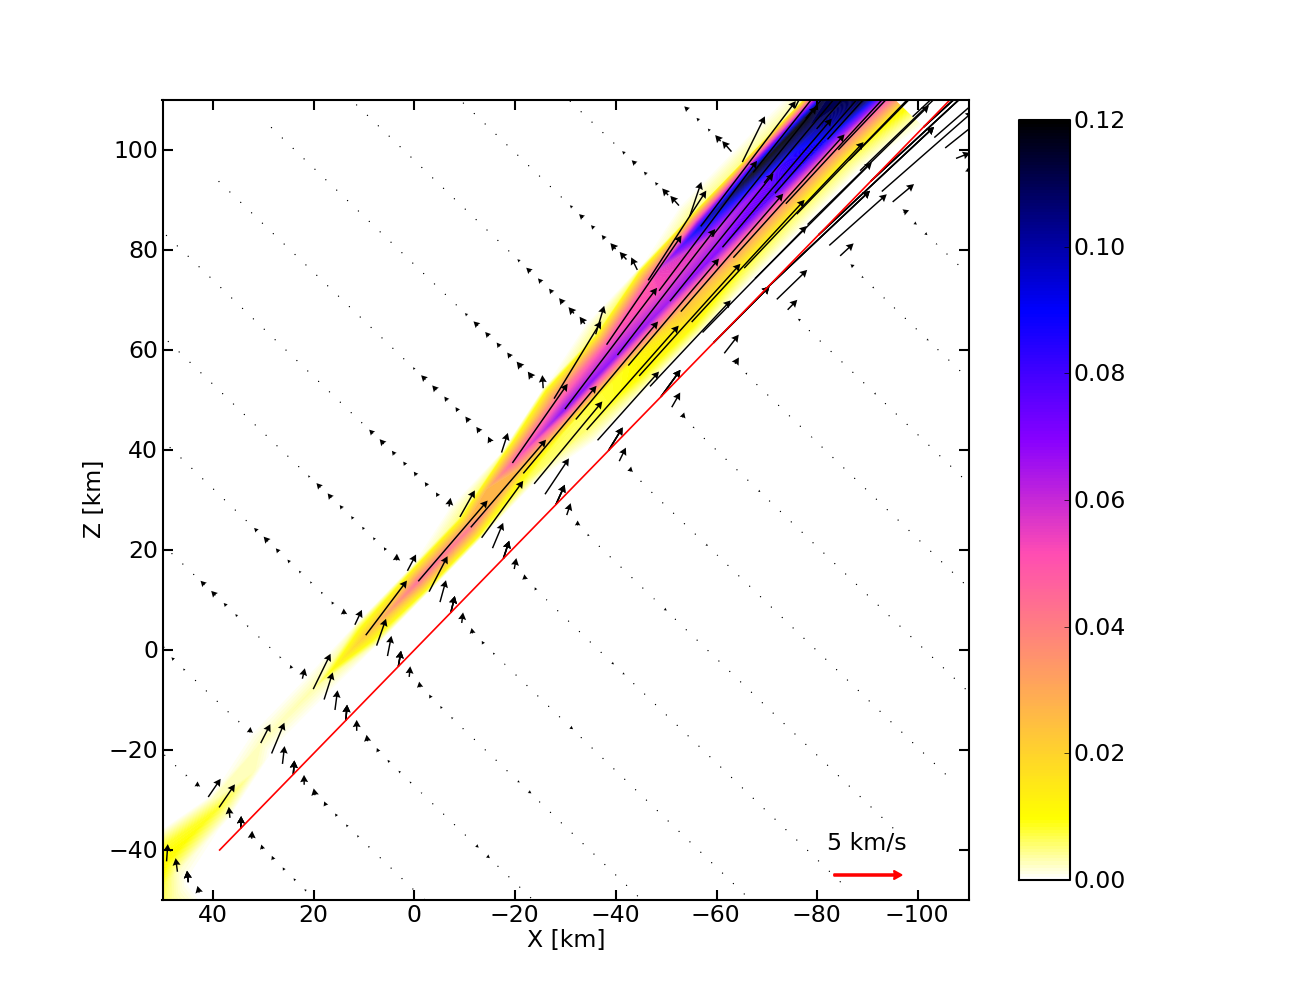
Crawford et al. (1995) noted that during the early stages of their model the evolving fireball maintained axisymmetry with respect to the entry channel. The oblique impact simulations of Boslough et al. (1995) and Takata et al. (1994) also predict the ejecta to rush back along the entry trajectory. In their models, Pankine & Ingersoll (1999) aligned the axis of the ejecta cone with the trajectory of the incoming comet. Hammel et al. (1995) estimated that in order for the plume material to reach the observed height of 3000 km at the 45∘ ejection angle, an initial velocity of 17 km s-1 is required for ballistic particles. However, Harrington & Deming (2001) found that the best fit to the appearance of the impact site came with an ejection cone tilted just 30° from the vertical. Our models do not produce velocities that high even for the 1 km diameter impactor, although it is conceivable that they may appear later as the plume blows out from the atmosphere. However, even in the first few seconds of plume formation, the entry channel expands mostly toward low pressure, creating an asymmetry with respect to the entry channel. Figure 3 shows the debris ejection directions in our model. Most of the ejecta are above the impactor’s trajectory, and the deviation from the entry path increases with time. Jessup et al. (2000) determined that an initial tilt angle of 6∘–15∘ and initial velocity of “only” 11–12 km s-1 are required to reproduce the time-dependent behavior of the observed plume apexes from the A, E, G, and W impacts. We do see velocities that high in our model, even in the cases of the 750 m and 500 m diameter impactors.
Jessup et al. (2000) deduced from the Galileo Near-Infrared Mapping Spectrometer data that the G fireball was most likely initiated between the 100 and 200 mbar pressure levels (35–45 km above the 1 bar level). Figure 1 shows that our model agrees with this deduction: at this level (50–70 km in along-track coordinates) the ejection velocities are near their maxima.
Takata et al. (1994) modeled the evolution of the plume expansion. They observed a gradual upward ejection of the debris and estimated that more than 40% of cometary material would rise above the 1 bar level at 100 s into their simulation, and more than 80% would eventually ascend above the visible cloud decks. Crawford et al. (1995) calculated that the energy and mass deposition of large fragments (1 km diameter) occurs below Jupiter’s ammonia cloud layer and predicted that less than 1% of the impactor material would be entrained into the rising plume. Lagrangian tracer particles in their model indicated that for a 3 km diameter impactor the total material in the plume above the 1 bar level is about 6.8 fragment masses, with only 0.2% being cometary material. Carlson et al. (1997) modeled the mass outflow of the G-impact. They assumed equal Jovian and cometary contributions in the plume, with a total mass of g. Based on the chemistry model of Zahnle et al. (1995), they assumed that 40% of the comet material would produce water, which agrees with the observations by Bjoraker et al. (1996) and Encrenaz et al. (1997) for the G plume splash. At 20 s into our simulation, the plume is completely detached from the rest of the comet-disturbed material and the mass of the debris that is moving with an upward velocity component of more than 100 m s-1 is about g, more than three times the mass of the original 1 km diameter fragment. The material with cometary origin in the plume at the same time is about g, about 0.07% of the original fragment or about 0.02% of the total plume material. For the 750 m and 500 m diameter impactors the plume masses are g and g, and the comet fractions are g and g, respectively.
Boslough et al. (1995) introduce an upwelling phase. At the depth of maximum energy deposition, a bubble of material forms from cometary material and Jovian air and rises buoyantly. Based on simulations of Crawford et al. (1995), they suggested that the adiabatic expansion of this bubble as it approaches the visible cloud deck is the source for the expanding ring of Hammel et al. (1995). In our 80 s simulations (not shown), we observe a similar feature forming out of the material below the pinch-off level. We plan experiments to study whether this feature, plume-related shocks, or something else forms the expanding ring. Our simulations indicate that the blowout plume should be relatively water free and most likely it cannot serve as the source of the observed water abundance values (Bjoraker et al., 1996; Encrenaz et al., 1997). Alternatively, this potentially water-rich bubble that forms well below the water cloud level and contains most of the comet material could provide an explanation for those observations. There is also the possibility of water forming from other species in the stratosphere and detailed investigation of these hypotheses is needed.
The horizontal (-plane) opening angle of the plume cone is 25∘ at the end of our 25–30 s simulations. This value is lower than expected based on the size of the crescent-shaped debris field. Harrington & Deming (2001) used a 70∘ opening angle to model the crescent and Pankine & Ingersoll (1999) also stated that the opening angle should be about 70∘ to produce a crescent that spans 180∘ around the impact site. The smaller opening angle in our model is the result of the plume leaving the computational grid, but we anticipate that the further expansion of the plume at higher altitudes will allow it to open more and we will model this by re-mapping the variables onto a larger grid. At 30 s in our simulation, the small amount of cometary material is limited horizontally to a very narrow trail within the plume. This could lead to a higher abundance of cometary material in the middle of the crescent than towards the sides. We plan to study this in the future.
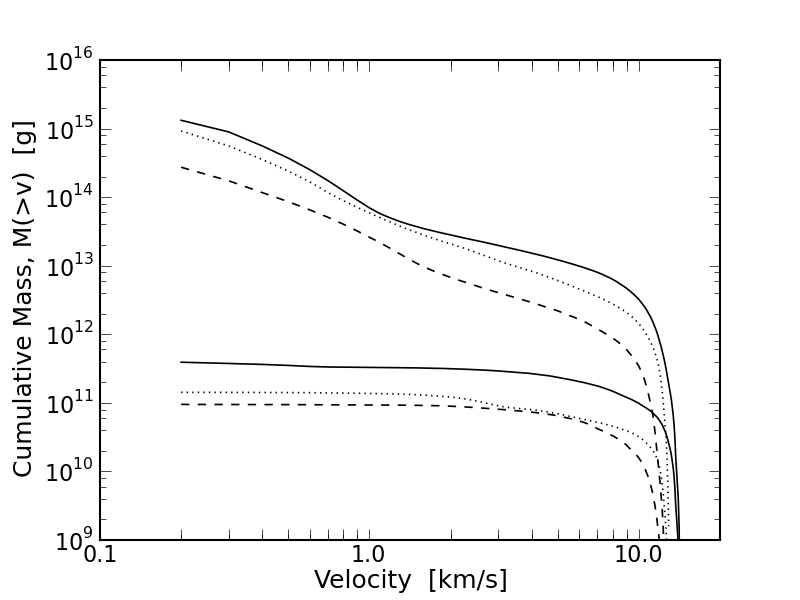
Zahnle & Mac Low (1995) calculated mass-velocity distributions (MVD) from simulations similar to those of Zahnle & Mac Low (1994). The MVD of ejecta from hypervelocity impacts usually follows a power law that can be written in a cumulative form
where is the mass at velocities greater than . Their power-law exponent was . The conservation laws of energy and momentum constrain to be . Harrington & Deming (2001) used this distribution in their ballistic Monte Carlo plume model. Pankine & Ingersoll (1999) used two different MVDs in order to simulate the plume and the resulting debris field. The first distribution was based on isentropic expansion of gas into vacuum following an explosion. The second MVD assumed that all the mass was ejected at the same velocity.
Figure 4 shows the MVDs from our simulations. The results follow power law curves below and above the cutoff velocity of 10 km s-1. The plume generated by the 1 km diameter impactor has 1.4; for the 750 m and 500 m diameter cases 1.6. For the comet material only (bottom curves), these curves are much shallower, indicating that proportionally more impactor material ejects at higher speeds.
4. CONCLUSIONS
In this study we focused on the generation and evolution of the initial plume after a Jovian cometary impact. We found that there is a pinch-off point approximately 50 km below the 1 bar level in the atmosphere, above which the initial plume begins to form and ascend, with velocities up to 15 km s-1. The initial opening angle of the plume is quite narrow, much smaller than the 70∘ found in other models. However, further evolution of the plume as it blows out may change this value. The bulk of the cometary material and kinetic energy penetrates to much lower depths; it rises buoyantly and much slower, and merits our further study. The fast plume contains more than three times the mass of the original impactor but is almost entirely (99.9%) composed of material from the Jovian atmosphere, so the observed dark features away from the impact site (e.g., main ring, crescent) should contain almost exclusively processed Jovian air. We will continue to investigate Jovian impacts with the goal of relating their physical properties to the observations.
References
- Bjoraker et al. (1996) Bjoraker, G., Stolovy, S. R., Herter, T. L., Gull, G. E. & Pirger, B. E., 1997, Icarus, 121, 411
- Boslough et al. (1995) Boslough, M. B., Crawford, D. A., Trucano, T. G., & Robinson, A. C. 1995, Geophys. Res. Lett., 22, 1821
- Carlson et al. (1997) Carlson, R. W., Drossart, P., Encrenaz, Th., Weissman, P. R., Hui, J., & Segura, M. 1997, Icarus, 128, 251
- Chodas & Yeomans (1996) Chodas, P. W., & Yeomans,D. K., 1996, in IAU Colloq. 156, The Impact of Comet Schoemaker-Levy 9 on Jupiter, ed. Noll, K. S., Weaver, H. A., & Feldman P. D., Cambridge Univ. Press.
- Crawford et al. (1995) Crawford, D. A., Boslough, M. B., Trucano, T. G., & Robinson, A. C. 1995, Int. J. Impact. Engng., 17, 253
- Deming & Harrington (2001) Deming, D., & Harrington, J. 2001, ApJ, 561, 468
- Encrenaz et al. (1997) Encrenaz, Th., Drossart, P., Carlson, R. W. & Bjoraker, G. 1997, Planet. Space Sci., 45, 1189
- Hammel et al. (1995) Hammel, H. B., Beebe, R. F., Ingersoll, A. P., Orton, G. S., Mills, J. R., Simon, A. A., Chodas, P., Clarke, J. T., De Jong, E., Dowling, T. E., Harrington, J., Huber, L. F., Karkoscha, E., Santori, C. M., Toigo, A., Yeomans, D., & West, R. A. 1995, Science, 267, 1288
- Hammel et al. (2010) Hammel, H. B., Wong, M. H., Clarke, J. T., de Pater, I., Fletcher, L. N., Hueso, R., Noll, K., Orton, G. S., Pérez-Hoyos, S., Sánchez-Lavega, A., Simon-Miller, A. A., & Yanamandra-Fisher, P. A. 2010, ApJ Letters, 715, L150
- Hueso et al. (2010) Hueso, R., Wesley, A., Go, C., Pérez-Hoyos, S., Wong, M. H., Fletcher, L. N., Sánchez-Lavega, A., Boslough, M. B., de Pater, I., Orton, G. S., Simon-Miller, A. A., Djorgovski, S. G., Edwards, M. L., Hammel, H. B., Clarke, J. T., Noll, K. S. & Yanamandra-Fisher, P. A. 2010, ApJ Letters, 721, L129
- Harrington & Deming (2001) Harrington, J., & Deming, D. 2001, ApJ, 561, 455
- Harrington et al. (2004) Harrington, J., de Pater, I., Brecht, S. H., Deming, D., Meadows, V. S., Zahnle, K., & Nicholson, P. D., 2004, in Jupiter: The Planet, Satellites, and Magnetosphere, ed. Bagenal, F., Dowling, T. E., & McKinnon, W. B. (Cambridge: Cambridge Univ. Press), 159
- Hayes et al. (2006) Hayes, J. C., Norman, M. L., Fiedler, R. A., Bordner, J. O., Li, P. S., Clark, S. E., ud-Doula, A. & MacLow, M.-M. 2006, ApJS, 226, 99
- Jessup et al. (2000) Jessup, K. L., Clarke, J. T., Ballester, G. E. & Hammel, H. B. 1997, Icarus, 146, 19
- Khokhlov (1994) Khokhlov, A. 1994, ApJ Letters, 124, L115
- Korycansky et al. (2002) Korycansky, D. G., Zahnle, K. J., & Mac Low, M.-M. 2002, Icarus, 157, 1
- Korycansky et al. (2006) Korycansky, D. G., Harrington, J., Deming, D., & Kulick, M. E. 2006, ApJ, 646, 642
- Mac Low & Zahnle (1994) Mac Low, M.-M. & Zahnle, K. 1994, ApJ, 434, L33
- Pankine & Ingersoll (1999) Pankine, A. A., & Ingersoll, A. P.. 1999, Icarus, 138, 157
- Sánchez-Lavega et al. (2010) Sánchez-Lavega, A., Wesley, A., Orton, G. S., Hueso, R., Pérez-Hoyos, S., Fletcher, L. N., Yanamandra-Fisher, P. A., Legarreta, J., de Pater, I., Hammel, H. B., Simon-Miller, A. A., Gomez-Forrellad, J. M., Ortiz, J. L., Garcia-Melendo, E., Puetter, R. C., & Chodas, P. 2010, ApJ Letters, 715, L155
- Takata et al. (1994) Takata, T., O’Keefe, J. D., Ahrens, T. J., & Orton, G. S. 1994, Icarus, 109, 3
- Takata & Ahrens (1997) Takata, T., & Ahrens, T. J. 1997, Icarus, 125, 317
- Zahnle & Mac Low (1994) Zahnle, K., & Mac Low, M.-M. 1994, Icarus, 108, 1
- Zahnle & Mac Low (1995) Zahnle, K., & Mac Low, M.-M. 1995, J. Geophys. Res., 100, 16885
- Zahnle et al. (1995) Zahnle, K., Mac Low, M.-M., Lodders, K. & Fegley Jr., B. 1995, Geophys. Res. Lett., 22, 1593
- Zel’dovich & Raizer (1999) Zel’dovich, Ya. B. & Raizer, Yu. P., 1999, Physics of Shock Waves and High-Temperature Hydrodynamic Phenomena