On the methanol masers in G9.62+0.20E and G188.95+0.89
Abstract
A comparison between the observed light curves of periodic masers in G9.62+0.20E and G188.95+0.89 and the results of a simple colliding-wind binary model is made to establish whether the flaring and other time-dependent behaviour of the masers in these two star forming regions can be ascribed to changes in the environment of the masers or in the continuum emission from parts of the background H II region. It is found that the light curves of widely different shape and amplitude in these two objects can be explained within the framework of a periodic pulse of ionizing radiation that raises the electron density in a volume of partially ionized gas against which the masers are projected. It is also shown that the decay of the 11.405 maser in G188.95+0.89 can be explained very well in terms of the recombination of the ionized gas against which the maser is projected while it would require very special conditions to explain it in terms of changes in environment of the maser. We conclude that for G9.62+0.20E and G188.95+0.89 the observed changes in the masers are most likely due to changes in the background free-free emission which is amplified by the masers.
1 Introduction
Since the discovery of the bright and widespread class II methanol masers at 6.7 GHz by Menten (1991), research on these masers has grown enormously. Over the last almost two decades it has been established rather firmly that the class II methanol masers are exclusively associated with high mass star forming regions (see eg. Ellingsen, 2006). However, in spite of the large volume of work that has been done, a clear picture of exactly where in the circumstellar environment the class II masers arise does not yet exist (see eg. van der Walt et al., 2007). This lack of knowledge makes it difficult to fully exploit the masers to study the circumstellar environment of the young massive stars with which they are associated.
A significant recent discovery is that a small number of masers show periodic or regular variability at 6.7, 12.2, and 107 GHz (Goedhart et al., 2003, 2004, 2007, 2009; van der Walt et al., 2009). Except for the detection of quasi-periodic flaring of formaldehyde masers in IRAS 18566+0488 (Araya et al., 2010) no similar variability has yet been detected for other masing molecules associated with high-mass star forming regions. This suggests that for some reason yet unknown, the class II methanol masers in some star forming regions are sensitive to a periodic/regular phenomenon associated with these massive star forming regions. On the one hand, the maser variability might be due to changes in the physical conditions in the masing region itself which affect the population inversion. On the other hand the variability may be due to changes in the background radiation field that is amplified. Given the regularity of the flaring of these masers, it is reasonable to assume that only one of the above mechanisms is responsible for the observed periodic behaviour of these maser. Whether it is the same mechanism that is responsible for the periodic flaring of the masers in all the periodic sources is not yet clear.
In a recent paper Araya et al. (2010) suggested that not only the flare events traced by formaldehyde and methanol masers IRAS 18566+0408 but also the methanol masers in G9.62+0.20E could be caused by periodic accretion of circumbinary disk material in a very young binary system. These authors also suggested that the less flare-like and lower amplitude variablity seen in other periodic methanol maser sources would be expected from accretion of circumbinary material in binary systems with lower eccentricity. On the other hand, van der Walt et al. (2009) suggested that the methanol maser flares seen in G9.62+0.20E might be related to changes in the background free-free emission which in turn is due to changes in the electron density caused by a pulse of ionizing radiation passing through a volume of partially ionized gas against which the maser is projected. This suggestion by van der Walt et al. (2009) was based on the decay part of the average 12.2 GHz flare profile only and it is therefore not really clear to what extent the time series can be explained by a simple colliding-wind binary scenario. Although both van der Walt et al. (2009) and Araya et al. (2010) suggested an underlying radiative origin for the flaring, these are two different scenarios with different implications.
In this paper we use a very simple toy model based on some general aspects of a colliding-wind binary (CWB) system and apply it to the time series of G9.62+0.20E and the significantly smaller amplitude periodic methanol maser source G188.95+0.89 (also known as S252 and AFGL 5180 in the literature). The use of such a toy model is justified at present since very little or perhaps nothing is known about the existence or not of a binary system in each of these star forming regions as well as about the stellar winds of the exciting stars. It is shown that the time series for the 1.25 12.2 GHz maser in G9.62+0.20E is very well reproduced over six cycles spanning about 1400 days. It is also shown that the simple model is able to reproduce the time series of the 10.659 maser in G188.95+0.89 over five cycles spanning about 1800 days. In addition we show that the decay of the 11.405 maser in G188.95+0.89 can be explained very well in terms of the recombination of a hydrogen plasma.
2 Theoretical framework
At present there is no explicit observational evidence indicating that G9.62+0.20E and G188.95+0.89 are colliding-wind binary systems or even just binary systems. Therefore no observational data exists on the stellar winds and orbital parameters except for the association with the periodic methanol masers. Modelling of both systems based on known values of physical quantities is therefore not possible. To make progress we adopt the following working hypotheses.
-
•
G9.62+0.20E and G188.95+0.89 are CWB systems. In the case of G9.62+0.20E the more massive star is at least a B1 type star (Hofner et al., 1996) which is the dominant ionizing source that maintains the H II region. For the present simple model the mass of the secondary star is not important except for setting the orbital parameters. However, it is implicity assumed that the secondary star is a non-ionizing star but which is still massive enough to have a significant stellar wind. As a starting point it is also assumed that the post-shock gas cools adiabatically implying that (Stevens et al., 1992; Zhekov et al., 1994), where is the luminosity of the post-shock gas and the distance between the two stars.
-
•
The class II methanol masers amplify the free-free emission from the background hypercompact H II region. In the case of G9.62+0.20E it is known from the work of Sanna et al. (2009) that all the 12.2 GHz maser features are projected against the H II region. No single dish or high resolution radio continuum data could be found for G188.95+0.89. The positions of the masers relative to a possible background ultra- or hypercompact H II region is therefore not known for this region. Since our underlying assumption is that the observed flaring is due to changes in seed photon flux (the background free-free emission) the amplification of the masers is considered to be time independent.
With the above working hypotheses the basic picture is that, whether the shock heated gas cools adiabatically or radiatively, the orbital motion results in the modulation of the ionizing radiation originating from the shock heated gas. This results in a “pulse” of ionizing radiation propagating outwards almost unattenuated through the H II region until it reaches substantially partially or non-ionized gas where it is absorbed. This raises the electron density and consequently the free-free emission. A schematic representation of the CWB scenario is given in Fig. 1.

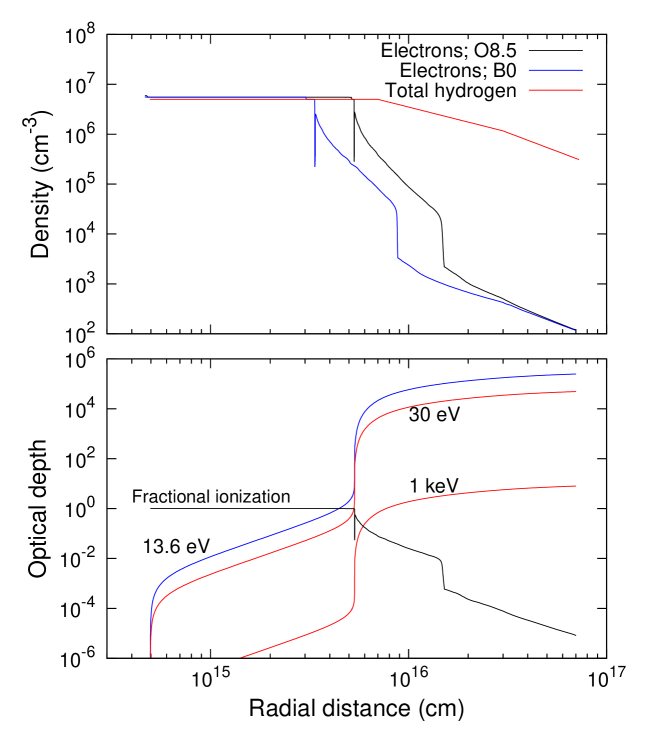
It is also necessary to expand somewhat on the location of the partially ionized gas referred to above. Examples of the possible ionization structure of a hyper/ultra-compact H II region as calculated with the photo-ionization code Cloudy (Ferland et al., 1998) are shown in the upper panel of Fig. 2. The red line gives the radial distribution of hydrogen while the black and blue lines are for the resulting radial electron densities for ionizing stars of spectral types B0 and O8.5 respectively. In both cases it is seen that the fully ionized region ends in a rather rapid decrease in the electron density. Although the decrease in the electron density is very rapid, the transition region is still of finite width. Closer inspection shows that the electron density decreases from a value of to over a distance of about cm.
Conversely, it means there is a sharp increase in the hydrogen density across the transition region, implying a sharp increase in the optical depth for ionizing photons. The lower panel of Fig. 2 shows the optical depth as a function of distance into the H II region for 13.6, 30, and 1 keV photons using the ionization structure for the case of the O8.5 star in the upper panel. It is seen that 13.6 eV photons are absorbed even before reaching the transition region. The reason for this is that although the fractional ionization equals one at the inner edge of the H II region, it slowly decreases outwards. The neutral hydrogen column density between the inner edge and the transition region is therefore not zero. For example, for a total hydrogen density of and a fractional ionization of, say, 0.998, the mean free path of a 13.6 eV photon is only cm. Higher energy, 30 eV, ionizing photons can, however, reach the partially ionized gas, while 1 keV photons can propagate well beyond the transition region before being absorbed. What is important to note is that while 30 eV photons are absorbed almost completely in the transition region, 1 keV photons are absorbed over a much greater distance interval. The transition region therefore provides a well defined region of partially ionized gas where the ionization pulse’s photons with energy roughly between 30 eV and somewhat less than 1 keV can produce additional ionization and thereby raise the electron density. In reality the H II regions associated with the two periodic methanol maser sources considered here will have ionization structures different from the ideal case discussed above and the energy range of photons responsible for ionization in the transition region may therefore also differ from the above example. We also note that due to the suggested rather high photon energies involved, secondary electrons produced in photoionization may also be a source of ionization associated with the effect of the pulse of ionizing photons.
The time-dependence of the electron density at the position in the partially ionized gas is then given by the solution of
| (1) |
(van der Walt et al., 2009) where is the recombination coefficient, the constant ionization rate at that particular position due to the diffuse ionizing radiation from the H II region and the neutral hydrogen number density also at the same position. is the time dependent ionization rate at the same position due to the ionization pulse. Since the production of secondary electrons is directly related to the ionization pulse, the ionization rate due to secondary electrons can be considered as included in . The first term on the right in Eq. 1 gives the decrease of the electron density due to recombinations and the second term the production of electrons due to photoionizations. Both and are time dependent and are related through with the total hydrogen number density at that position in the H II region. The calculation is done using the “on the spot” approximation implying . Considering the radial dimension of the transition region (of the order of a few times cm), a standard calculation shows that it is optically thin at 12.2 GHz (and frequencies above that) which implies that the emitted flux of free-free emission at 12.2 GHz due to the ionization pulse’s effect is simply proportional to .
Since we have not performed a full calculation of the interaction of the stellar winds and of the physical conditions in the shocked gas, it was necessary to normalize in some way. This was done by setting as initial condition (secondary star located at apastron at ) that at the position of the transition region the ionization rate due to the pulse is given by , with and . Here is the equilibrium electron density as determined by at that position.
The time dependent source of ionizing radiation in the framework of our working hypothesis is the hot shocked gas created by the colliding winds. As noted above, it is assumed that the luminosity of the shocks scales like with the distance between the two stars. The time dependence of the ionization rate, , is therefore the same as that of where is given by
| (2) |
and is the semi-major axis given by
| (3) |
Here, is the universal gravitational constant, and the masses of the two stars, and the period, which is 244 days in the case of G9.62+0.20E and 404 days for G188.95+0.89. The time dependence of was calculated numerically using Kepler’s second law in the form
| (4) |
where
| (5) |
and
| (6) |
is the angular momentum. The time step was taken as one fifth of a day. The orbital parameters were calculated using stellar masses of 17 and 8 following van der Walt et al. (2009).
3 Comparison with observed periodic maser light curves
The free parameters involved in the calculation were , , , and the eccentricity, . To find a fit to the observed light curves it was first of all necessary to find combinations of the above free parameter such that the relative amplitude (= ) equals that of the observed light curve. A preliminary exploration of parameter space showed that there is no unique combination of the free parameters for a given relative amplitude. In fact, for a given there appears to be a continuum of combinations of , , for a given relative amplitude. Since very little or even nothing is really known about the ionization structure and density distributions of the two H II regions, the approach followed here was to fix the total hydrogen density in the volume under consideration and to find the range of combinations of , , and that gives the correct relative amplitude. Typically the correct value of was quite easy to determine. This was then followed by a least squares fitting to find the combination of and that best fits the observed light curve after normalizing the minimum between two flares to the minimum between two flares in the observed time series.
G9.62+0.20E: The best fit to the time series was obtained with fixed at , and with , , and . This best fit solution is compared in Fig. 3 with the observed 12.2 GHz time series of the 1.25 feature. We also show another solution for which , and to illustrate the effect of a lower value of . The eccentricity of 0.9 implies that apastron is at 4.4 AU.
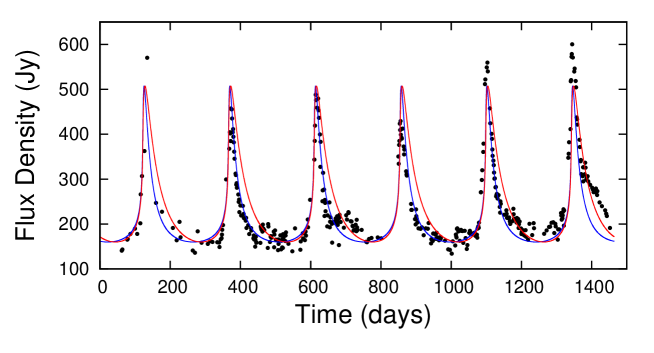
The best fit solution is seen to reproduce the observed time series remarkably well, especially if it is noted that it does so over six flares, spaning about 1400 days. There are obviously other effects present in the data which the very simple model cannot account for. The result for is seen to have the same rise time as for , but to have a slower decay. This is due to the fact that the recombination time for a lower density plasma is longer than for a higher density plasma. We do not show the result for , for example, but merely state that, on the other hand, in this case the decay is significantly shorter than for the best fit with .
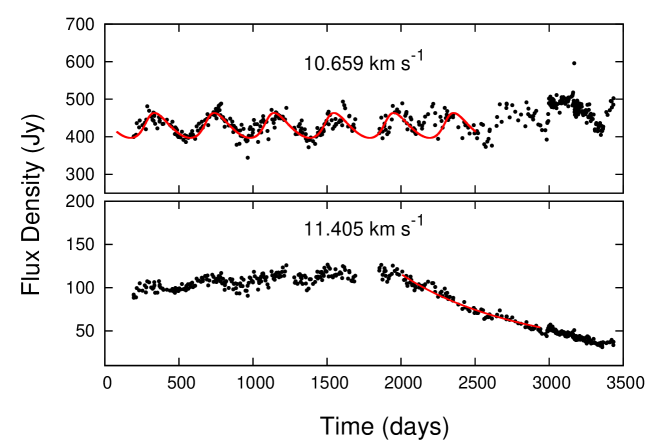
G188.95+0.89: For G188.95+0.89 we used the 10.659 maser feature to fit the model result to. The relative amplitude for this feature is only 0.17 compared to 2.17 for G9.62+0.20E. In this case was fixed at . The best fit was found for , , and and is compared in Fig. 4 with the observed time series. The model reproduces the observed time series reasonably well up to about 2000 days after which, for all the maser features (see Goedhart et al. (2007)) there seems to be some general change in behaviour. In this case the eccentricity of 0.36 and period of 404 days imply apastron to also be 4.4 AU, similar to that of G9.62+0.20E. Periastron is about 2.1 AU. The same masses for the primary and secondary were used as for G9.62+0.20E.
A very interesting aspect of the masers in G188.95+0.89 is that from about day 2000 the 10.483 and 11.405 masers started to become fainter while the other masers stayed more or less at the same flux level (Goedhart et al., 2007). The time series for the 11.405 feature is shown in the bottom panel of Fig. 4. A small amplitude variation which is in phase with the 10.659 maser can been seen for the first almost 1700 days. From about day 2000 there is a decay in the maser flux density.
The obvious question is what causes such different behaviour for the two masers in G188.95+0.89 even though most of the maser features are projected within about 100 AU from each other (Minier et al., 2002a). As already stated, our basic hypothesis is that the periodic flaring of the masers might be due to changes in the background free-free emission. We therefore also tried to fit the decay of the 11.405 maser with the expected change in free-free emission from an optically thin recombining hydrogen plasma as given by Eq. A9 of van der Walt et al. (2009). The data was fitted between days 2007 and 2940 and the result is shown as the solid red line in the bottom panel of Fig. 4. It is seen that for almost 1000 days the decay is described very well by what is expected of the recombination of an optically thin hydrogen plasma. In this case the decay is consistent with the recombination of a plasma with an initial density, , of about recombining to a very low equilibrium value, , of less than .
4 Discussion
What criticism can be raised against the simple model? It certainly is true that it contains only some elements of a CWB system and therefore cannot be regarded as fully realistic. For example, it has been assumed implicitly that the properties of the winds are such that the shocked gas has high enough temperature and sufficient volume emissivity to produce the neccesary ionization at some distant volume in the H II region. Furthermore, it has also been assumed that if the underlying source of the ionization pulse is indeed a CWB, that the shocked gas cools adiabatically. This need not necessarily be the case since radiative cooling can result in faster cooling than in the adiabatic case.
A second point that might be raised against the present explanation for the periodic masers is the presence of dust in hyper- and ultra-compact H II regions. The shell-like morphology for the mid-infrared emission for many compact H II regions as seen, for example, in the work of Phillips & Ramos-Larios (2008) suggests that for compact H II regions some of the dust has been cleared out of the ionized volume either through destruction of the dust or through radiation pressure (see also Tielens (2005)). In the ultra-compact phase, however, there may still be significant amounts of dust inside the H II region. In fact, De Buizer et al. (2003) found mid-infrared emission associated with G9.62+0.20E, suggesting the possible presence of dust inside the ionized region. Since the presence of dust increases the optical depth for ionizing photons, it might be argued that the mechanism proposed here simply might not be realistic since most of the ionizing photons will be absorbed before reaching the transition region.
The best fit solutions for both G9.62+0.20E and G188.95+0.89 however, suggests that even with the above criticism, the simple model must contain some element of reality. Even though the assumption that the shocked gas cools adiabatically has not been justified, it is seen that the rise of the flares are well described by the dependence used for the ionization pulse. Although this cannot be considered as conclusive proof, it is suggestive that the adiabatic assumption might indeed apply in reality. Overall it is quite remarkable that the flares are so well described by the solutions of Eq. 1 that it is difficult to avoid not to conclude that the flaring of the masers is indeed due to changes in the free-free emission from those parts of the background H II region against which the masers are projected.
As for the behaviour of the masers in G188.95+0.89 the question can be asked how it is possible for some of the masers to still show periodic behaviour while for one the periodic behaviour seems to have stopped and its flux density is slowly decreasing, especially when the masers appear to be located within a projected region as small as 100 AU in diameter. This question applies not only if it is assumed that the observed periodic variability and the behaviour of the 11.405 maser are related to changes in the free-free emission from parts of the background H II region but also if assumed that the variability is due to changes in the maser amplification.
In this regard it has to be noted that if the decrease of the flux density of the 11.405 maser is indeed due to changes in the amplification of the maser, the implication is that the well defined decay over 1000 days imposes rather strict constraints on the changes in the maser optical depth. It has already been shown that the decay is consistent with the recombination of the ionized gas with an initial electron density () of about to an equilibrium density () of less than . Thus, , implying, according to Eq. A8 of van der Walt et al. (2009), that for the maser flux density . The observed decay of the maser is therefore approximately exponential. If this decay is due to a change in the amplification of the maser then also , which together with the observed exponential decay requires that has to decrease linearly with time for the 11.405 maser. Since the optical depth depends on the level populations which in turn depends, amongst other things, on the pumping radiation field, it is seen that the exponential decay of the 11.405 maser implicitly imposes rather strict constraints on how the pumping radiation field in the maser environment should depend on time such that decreases linearly with time. It is unclear what physical process or combination of processes in the star forming environment can be tuned so finely to result in the optical depth of one of the masers decreasing linearly over 1000 days. On the other hand, since the decay of the maser follows the behaviour of what can be expected for the free-free emission from a recombining plasma, it seems reasonable to conclude that it reflects the behaviour of the background free-free emission.
It can also be argued that while the 11.405 maser might reflect the behaviour of the free-free emission of the background source, the periodic masers are due to periodic changes in the amplification. Again this would mean that the pumping radiation field should have some very specific time dependence to produce the observed periodicity. Also, since the masers are pumped radiatively by infrared photons at which wavelengths the cloud is most likely internally optically thin on the 100 AU scale, it is hard to envisage a scenario whereby the 11.405 maser is to such an extent shielded from the general time-dependent pumping radiation field to not show any periodic behaviour while the other masers are still subject to the pumping radiation field and continues to show periodic behaviour.
Considering the above it seems that the most probable physical situation to understand the behaviour of all the masers in G188.95+0.89 in a consistent way is that they reflect changes in the background free-free emission amplified by the masers. This means that the underlying cause for the decay of the 11.405 maser should be related to some physical event in the H II region that most probably reduced the flux of ionizing photons reaching the volume of gas against which the maser is projected, thereby leading to the recombination of the ionized gas. Since the masers amplify emission from a relatively small part of the background H II region, this could have been a very local event that did not affect other parts of the H II region. Without any other observational evidence it is, however, not possible to make any conclusive statements as to exactly what kind of event gave rise to the onset of the recombination of the background ionized gas and thus the decay of the maser. In this regard we point out that Franco-Hernández & Rodríguez (2004) detected a decrease in the radio flux density from the lobes of the bipolar H II region NGC 7538 IRS1 and suggested the inflow of gas from a neutral torus into the core region as a possible explanation.
Evaluating whether the circumbinary accretion model proposed by Araya et al. (2010) can also explain the maser flares and other time-dependent behaviour of masers in G9.62+0.20E and G188.95+0.89 as presented above, falls outside the scope of this paper. However, the following two questions are raised. First, if the background free-free emission remains constant and the maser variability is driven by a variable infrared pumping radiation field, it is expected, as already argued above, that all the masers for a specific object will show the same type of variability especially if it is taken into account that, for example in the case of G188.95+0.89, they all lie in a volume with a diameter of about 100 AU. Clearly this is not the case for G188.95+0.89 where the 11.405 maser shows a completely different behaviour compared to the 10.695 maser.
One of the reasons why Araya et al. (2010) proposed the circumbinary accretion model is that the time dependence of the accretion rate seems to be similar to that of the maser flare profiles. The second question concerns to what extent the maser flare profile, even for a saturated maser, will indeed resemble the original time dependence of the accretion rate. In the simple CWB model used here, the ionizing pulse does not resemble the maser flare profile at all, but is “transformed” through its interaction with the partially ionized gas. In view of the fact that a number of different physical processes link the population inversion in the masing region to the accretion process, is it not clear whether there will be a one-to-one correspondence between the final maser flare profile and the time dependence of the accretion rate.
In this regard we note the following: If it is assumed that within the circumbinary model the eccentricity for G188.95+0.89 is the same as within our simple CWB model, the time dependence of the accretion rate should be somewhere between the two cases presented in Fig. 2 by Artymowicz & Lubow (1996). It can therefore be expected that, as in the case for an eccentricity of 0.1, there will still be a significant time lag in the accretion rate onto the two stars. Since the heating of the dust depends on the emission from the accretion shocks associated with both stars, it is necessary to consider the time dependence of the total accretion rate and not that of the individual stars. Due to the time lag between the accretion rates of the two individual stars, the time dependence of the total accretion rate in the system for an eccentricity of 0.1, will therefore not have the sinusoidal-like pattern that applies to the two stars individually but will deviate significantly from it. Although the time lag decreases with increasing eccentricity, it is expected that there will also be a significant time lag for an eccentricity of about 0.35 resulting in the total accretion rate not having a sinusoidal character. The question that obviously follows is how, for low eccentricity binaries, the accretion rate and the maser flare profile are coupled?
5 Conclusions
In view of the comparison between the model results and the observed maser flares we conclude that the simple toy model based on aspects of a CWB system can explain the different flaring behaviour of the masers in G9.62+0.20E and G188.95+0.89. It was also shown that the decay of the 11.405 maser in G188.95+0.89 can be explained very well in terms of the recombination of ionized gas. For G188.95+0.89 it seems as if the behaviour of all the masers in this source can be understood in terms of changes in electron density in different parts of the background H II region. In the case of G9.62+0.20E the simple CWB model reproduce the flares of 12.2 GHz masers for six consecutive flares. Qualitatively the CWB model can also explain the slow increase of some of the 6.7 GHz masers in G9.62+0.20E. Also in this case does it seem that the behaviour of the masers can be understood in terms of changes in the electron density in different parts of the H II region.
The working hypothesis under which the above calculations were made was that both systems are colliding-wind binaries. The question is whether it can be concluded from the above comparisons of the model result with the data that this is indeed the case. Our simple toy model does not really answer this question. Apart from the orbital motion which determines the pulse shape and the physics involved in Eq. 1, we have not truely modeled a CWB system. More detailed modeling involving the interaction of the winds, the temperature distribution of the shocked gas, and the calculation and propagation of the spectral energy distribution of radiation emitted by the hot shocked gas are aspects which still need to be done. The fact that it seems possible to explain widely different masers light curves such as that of G9.62+0.20E and G188.95+0.89, is sufficient motivation to persue such more detailed calculations.
References
- Araya et al. (2010) Araya, E. D., Hofner, P., Goss, W. M., Kurtz, S., Richards, A. M. S., Linz, H., Olmi, L., & Sewiło, M. 2010, ApJ, 717, L133
- Artymowicz & Lubow (1996) Artymowicz, P., & Lubow, S. H. 1996, ApJ, 467, L77+
- De Buizer et al. (2003) De Buizer, J. M., Radomski, J. T., Telesco, C. M., & Piña, R. K. 2003, ApJ, 598, 1127
- Ellingsen (2006) Ellingsen, S. P. 2006, ApJ, 638, 241
- Ferland et al. (1998) Ferland, G. J., Korista, K. T., Verner, D. A., Ferguson, J. W., Kingdon, J. B., & Verner, E. M. 1998, PASP, 110, 761
- Franco-Hernández & Rodríguez (2004) Franco-Hernández, R., & Rodríguez, L. F. 2004, ApJ, 604, L105
- Goedhart et al. (2003) Goedhart, S., Gaylard, M. J., & van der Walt, D. J. 2003, MNRAS, 339, L33
- Goedhart et al. (2004) —. 2004, MNRAS, 355, 553
- Goedhart et al. (2007) Goedhart, S., Gaylard, M. J., & van der Walt, D. J. 2007, in IAU Symposium, Vol. 242, IAU Symposium, ed. J. M. Chapman & W. A. Baan, 97–101
- Goedhart et al. (2009) Goedhart, S., Langa, M. C., Gaylard, M. J., & van der Walt, D. J. 2009, MNRAS, 398, 995
- Hofner et al. (1996) Hofner, P., Kurtz, S., Churchwell, E., Walmsley, C. M., & Cesaroni, R. 1996, ApJ, 460, 359
- Menten (1991) Menten, K. M. 1991, ApJ, 380, L75
- Minier et al. (2002a) Minier, V., Booth, R. S., Burton, M. G., & Pestalozzi, M. R. 2002a, in Proceedings of the 6th EVN Symposium, ed. E. Ros, R. W. Porcas, A. P. Lobanov, & J. A. Zensus, 205–+
- Phillips & Ramos-Larios (2008) Phillips, J. P., & Ramos-Larios, G. 2008, MNRAS, 391, 1527
- Sanna et al. (2009) Sanna, A., Reid, M. J., Moscadelli, L., Dame, T. M., Menten, K. M., Brunthaler, A., Zheng, X. W., & Xu, Y. 2009, ApJ, 706, 464
- Stevens et al. (1992) Stevens, I. R., Blondin, J. M., & Pollock, A. M. T. 1992, ApJ, 386, 265
- Tielens (2005) Tielens, A. G. G. M. 2005, The Physics and Chemistry of the Interstellar Medium
- van der Walt et al. (2009) van der Walt, D. J., Goedhart, S., & Gaylard, M. J. 2009, MNRAS, 398, 961
- van der Walt et al. (2007) van der Walt, D. J., Sobolev, A. M., & Butner, H. 2007, A&A, 464, 1015
- Zhekov et al. (1994) Zhekov, S. A., Palla, F., & Myasnikov, A. V. 1994, MNRAS, 271, 667