The ATLAS3D project – IV: the molecular gas content of early-type galaxies††thanks: Based on observations carried out with the IRAM 30m Telescope. IRAM is supported by INSU/CNRS (France), MPG (Germany) and IGN (Spain).
Abstract
We have carried out a survey for CO J=1-0 and J=2-1 emission in the 260 early-type galaxies of the volume-limited ATLAS3D sample, with the goal of connecting their star formation and assembly histories to their cold gas content. This is the largest volume-limited CO survey of its kind and is the first to include many Virgo Cluster members. Sample members are dynamically hot galaxies with a median stellar mass ; they are selected by morphology rather than colour, and the bulk of them lie on the red sequence. The overall CO detection rate is 56/259 = 0.22 0.03, with no dependence on luminosity and only a modest dependence on dynamical mass. There are a dozen CO detections among the Virgo Cluster members; statistical analysis of their H2 mass distributions and their dynamical status within the cluster shows that the cluster’s influence on their molecular masses is subtle at best, even though (unlike spirals) they seem to be virialized within the cluster. We suggest that the cluster members have retained their molecular gas through several Gyr residences in the cluster. There are also a few extremely CO-rich early-type galaxies with H2 masses , and these are in low density environments. We do find a significant trend between molecular content and the stellar specific angular momentum. The galaxies of low angular momentum also have low CO detection rates, suggesting that their formation processes were more effective at destroying molecular gas or preventing its re-accretion. We speculate on the implications of these data for the formation of various sub-classes of early-type galaxies.
keywords:
galaxies: elliptical and lenticular, cD — galaxies: evolution — galaxies: ISM — galaxies: structure — Radio lines: galaxies.1 INTRODUCTION
Understanding galaxy formation and evolution is at the heart of much of current astrophysics. The task is, however, greatly hindered by the lack of quantitative, physically-driven (as opposed to empirical) models of the regulation of molecular gas and star formation on galactic scales. All galaxies or protogalaxies must have begun as gas-rich entities, and during their first epochs of star formation would have belonged to the “blue cloud” in a galaxy colour-magnitude diagram. In contrast, today there is a clear separation between the blue cloud (composed mainly of star-forming disc and dwarf galaxies) and the red sequence (old and dynamically hot stellar systems). Thus, an outstanding question in galaxy evolution is how the present-day early-type galaxies moved quickly from the blue cloud to the red sequence.
This rapid movement to the red sequence requires, at minimum, an abrupt cessation of star formation at high redshift so that the global colours change from blue to red (Thomas et al., 2005, 2010). Since today’s early-type galaxies are generally rather poor in atomic and molecular gas (Lees et al., 1991), it is often assumed that the cessation of star formation was achieved by removing, destroying, or consuming the cold gas. The most massive early-type galaxies are often rich in hot gas (O’Sullivan et al., 2001), so it is possible that molecular gas is destroyed by heating. An intriguing alternative suggestion is that the cold gas might be retained but rendered unsuitable for star formation activity (Martig et al., 2009). Thus, the story of the development of the red sequence is, to a large extent, a story of what happens to the cold gas in galaxies.
Several mechanisms have been proposed to deplete the cold gas from galaxies and move them onto the red sequence. For example, a major merger between two gas-rich galaxies could (depending on geometry) result in a large-scale loss of angular momentum, dropping gas to the center of the merger remnant (Barnes, 2002). The gas could then be funneled into a black hole and/or consumed in a LIRG-type burst of star formation activity. Alternatively, the energy input into the interstellar medium from an active nucleus or a starburst could hypothetically destroy and/or unbind the cold gas, as well as prevent hot gas from cooling. Environmental effects such as ram pressure stripping, gravitational interactions and galaxy harassment could also be important in at least some early-type galaxies. In fact, it is likely that all of these processes are important at some level, but we do not yet have strong constraints on their relative impacts. The behavior of the cold gas in all of these transformational processes needs to be better understood.
It has also been known for some years that today’s early-type galaxies, while relatively poor in cold gas compared to spirals, are not completely devoid of cold gas. The gas is detected in dusty silhouette discs (e.g. Goudfrooij et al., 1994), HI emission (e.g. Wardle & Knapp, 1986; Huchtmeier, Sage & Henkel, 1995; Morganti et al., 2006; Oosterloo et al., 2010), and CO emission (Lees et al., 1991; Wiklind et al., 1995; Combes et al., 2007; Welch, Sage, & Young, 2010). The origin of this gas is not well understood; it could have come from internal stellar mass loss (e.g. Mathews & Brighenti, 2003; Ciotti, Ostriker & Proga, 2010), or it could have been acquired from an external source such as another galaxy or cold mode accretion. In some early-type galaxies the case for an external origin is very clear because the specific angular momentum of the gas is dramatically different from that of the stars. Cen A (Quillen et al., 1992) and NGC 3032 (Young, Bureau & Cappellari, 2008) exhibit this property, but in many other cases the gas kinematics are consistent with an internal origin. Again, probably both external and internal processes contribute at some level. A quantitative understanding of their contributions would make it possible for the gas to serve as an indicator of the galaxies’ evolutionary histories and the processes that moved these galaxies onto the red sequence.
These considerations motivate a study of correlations between the cold gas content of early-type galaxies and their other properties. For example, the kinematic structures in early-type galaxies (dynamically cold stellar discs, counterrotating cores, or even the absence of a measurable net rotation) preserve clues to their assembly histories. If the cold gas in these galaxies is leftover from the time of their assembly, we might expect the gas content to be correlated with kinematic structure. In addition, it would be useful to test the influence of AGN activity and/or local environment on the gas content. Looking to the future, observations of the cold gas in early-type galaxies can also be used for testing theoretical models of the ISM structure and of star formation processes.
We address these goals through a CO survey of the ATLAS3D sample, a large and complete volume-limited sample of early-type galaxies spanning a variety of environments and AGN activity levels. This is the largest survey to date of CO in early-type galaxies, being factors of 5 to 10 larger than previous studies with similar sensitivity. It is also the first volume-limited sample to have spatially resolved stellar kinematics, stellar populations, and ionized gas data for all target members. And while the smaller CO survey of the SAURON early-type galaxies (Combes et al., 2007) included both Virgo Cluster members and field galaxies, it was not a volume-limited sample. The present paper is the first to allow reliable statistical analyses of gas contents inside and outside the Virgo Cluster.
Section 2 summarizes the selection criteria for the ATLAS3D sample. Section 3 describes the 204 new CO observations obtained for this survey and the literature data collected for the remainder. Section 4 describes global results of the survey, and section 5 analyzes the molecular gas content compared to a variety of galaxy properties including stellar kinematics and environment. Correlations with stellar populations, star formation activity, and AGN activity will be discussed in a future paper. The discussion in section 6 covers implications for the origin of the molecular gas in early-type galaxies, the removal of gas in clusters and the possible transformations of spirals into early-type galaxies.
2 SAMPLE
The ATLAS3D sample is a complete volume-limited sample of early-type galaxies brighter than covering distances out to 42 Mpc, with some restrictions on Declination and Galactic latitude (see Cappellari et al., 2011a, hereafter Paper I). The early-type sample is actually drawn from a parent sample which has no colour or morphological selection, and optical images of the entire parent sample have been inspected by eye for large-scale spiral structure. The presence or absence of spiral structure is, of course, a physically motivated selection criterion because it tests whether the stellar population is dynamically cold (and self-gravitating) or not. The 260 galaxies lacking spiral structure form the basis of the ATLAS3D project. Integral-field optical spectroscopy was obtained with the SAURON instrument on the William Herschel Telescope; it covers a field of at least 33″ 41″, typically extending to one effective (half-light) radius .
Paper I gives additional information on the details of the morphological selection of the sample, assessment of Virgo Cluster membership, the distances of the galaxies and measured optical velocities. Paper I shows that the morphologically-selected ATLAS3D galaxies clearly trace out the red sequence, with a small population of bluer galaxies in the “transition region” between the blue cloud and the red sequence. Krajnović et al. (2011) (Paper II) present a morphological classification of the internal stellar kinematic structure of the galaxies, and Emsellem et al. (2011) (Paper III) analyse the stellar specific angular momentum proxy for the galaxies. Cappellari et al. (2011b) (Paper VII) present measurements of the local galaxy density, which we use for study of environmental effects on cold gas content.
3 DATA
3.1 IRAM 30 m observations and data reduction
The IRAM 30 m telescope at Pico Veleta, Spain, was used for simultaneous observations of 12CO (1-0) and (2-1) during July 2007, March 2008, and November 2008. The beam FWHM is respectively and at the two frequencies. The SIS receivers were used for observations in the wobbler switching mode, with reference positions offset by in azimuth. The MHz filterbank back-end gave an effective total bandwidth of MHz (1330 km s-1) and a raw spectral resolution of 2.6 km s-1 for CO(1-0). The MHz filterbank gave an effective total bandwidth of MHz (also 1330 km s-1) and a raw spectral resolution of 5.2 km s-1 for CO(2-1).
If the CO emission is quite extended, the relatively small wobbler throw could potentially result in some emission being located in the “off” positions. The signature of this problem would be a negative feature, most likely at a velocity different to the optical systemic velocity. There is no strong evidence of this problem in any spectra except for those of NGC 4649, where known CO emission from NGC 4647 (Young et al., 2006) appears as a negative feature offset by 270 km s-1. The effect may possibly be seen in the spectra of NGC 2685, which however is already known to have extended CO emission (see below).
The system temperatures ranged between K and K at mm, and between K and K at mm. A small number of targets had significantly poorer quality data, with system temperatures up to 1400 K for CO(2-1), and for NGC 2698 the system temperatures were so large at 2-1 as to make those data useless. The pointing was checked every to 3 hours on a nearby planet or bright quasar, and focus was checked at the beginning of each night as well as after sunrise or more often if a suitable planet was available. The time on source typically ranged from 12 minutes to 36 minutes and occasionally longer, being weather dependent, interactively adjusted so that the final co-added 12CO (1-0) spectrum for each galaxy had a rms noise level near 3.0 mK () 18 mJy after binning to 31 km s-1 channels.
The individual 6 minute scans were all inspected and those with unusually poor quality baselines or other problems were discarded, to reduce the possibility that a faint emission line feature could be created by baseline instabilities. The good scans were averaged together, weighted by the square of the system temperature. In six cases the CO(2-1) spectrum required a linear (first order) baseline, while in all other cases a simple constant (zero order) baseline was used. If no emission was apparent in the spectrum, all of the channels were used to determine the baseline level. If emission was obvious the baseline was determined using interactively selected line-free regions of the spectrum.
Integrated intensities for each galaxy were computed by summing the spectrum over velocity. In the cases with weak or absent line emission, the velocity range is 300 km s-1 centered on the systemic velocity of stellar absorption lines as measured from our SAURON data (Cappellari et al., 2011a). In most cases our new velocities agree with values listed in the HyperLEDA database. For NGC 4486A our new velocity disagrees by 700 km s-1 due to the presence of a bright foreground star corrupting previous long-slit spectroscopy, and our original use of the LEDA velocity means that we have effectively no CO data for that galaxy. For obvious detections the integrated velocity range covers the real emission. Table The ATLAS3D project – IV: the molecular gas content of early-type galaxies††thanks: Based on observations carried out with the IRAM 30m Telescope. IRAM is supported by INSU/CNRS (France), MPG (Germany) and IGN (Spain). lists the rms noise levels in each spectrum, the velocity ranges summed, and the integrated intensities and . As in Sage et al. (2007), the statistical uncertainty in a sum over channels, each of width and rms noise level , is
| (1) |
A contribution from the uncertainty in estimating the baseline level is included ( is the ratio of the number of channels in the line to the number of channels used for measuring the baseline level). When the integrated intensity is greater than three times its own uncertainty the galaxy is counted as a detection. Detected lines were also fit with Gaussian or double-horned template profiles. The fitted line areas are consistent with the summed areas; specifically, for 30 galaxies with 1-0 integrated intensities K km s-1, the mean ratio (sum area)/(fit area) is 0.96 with a dispersion of 0.04. The properties of the line fits are discussed in greater detail in section 4.2 below.
Figure 1 shows the integrated intensities of all sample galaxies, in units of their own statistical uncertainty (equation 1). The long positive tail represents real detections; the peak symmetric about 0.0 is caused by thermal noise and low level baseline wiggles in the spectra. In general, one would expect the statistical uncertainty of equation 1 to underestimate the true uncertainty in a sum because it does not account for correlated channels (baseline ripples), but Figure 1 suggests this effect is small since the dispersion in the integrated areas is not substantially larger than the theoretical estimate. In our sample there are a total of 56 galaxies with line intensities above the 3 level; four of them have and might be treated with caution. Of these four, NGC 4684 is also detected independently in the CO(2-1) line at a higher level of significance. In 203 empty spectra we would expect to find only 0.26 false positives with and also 0.26 false negative “detections” (noise that looks like an absorption line) with . As usual, the real outlier detection rates are probably larger than that, but the fact that we find so few negative “detections” (Figure 1) suggests that there are also few false positives.

Conversion to main beam brightness temperatures is achieved by dividing the antenna temperatures by the ratio of the beam and forward efficiencies, at mm and at mm. Temperatures quoted in the tables are main beam brightness temperatures (). The conversion from main beam temperature to flux density in Jy is 4.73 for the 30m at both frequencies. The total mass of molecular hydrogen is estimated using a ratio N(H2)/I1-0 cm-2 (K km s-1)-1 (Dickman et al., 1986; Strong et al., 1988, 2004). This ratio converts an integrated intensity to an H2 column density averaged over the beam, and multiplication by the beam area gives the total H2 mass as
A beam size of 21.8″ is assumed and the effective beam area is . The molecular mass thus only refers to the mass within the central 22″ of the galaxy, which corresponds to a diameter of 2.2 kpc at a typical distance of 20 Mpc. The masses will be underestimated if the molecular gas is more extended than the beam of the 30m telescope. Based on previous experience with interferometric imaging of CO in early-type galaxies, this effect can occasionally be as large as a factor of two or more (e.g. Young, 2002, 2005; Young, Bureau & Cappellari, 2008) but it cannot be predicted a priori. The beam of the 30m telescope for CO(1-0) does cover roughly one third of the SAURON field-of-view ( in low-resolution mode), so in most cases the mean stellar parameters are determined over a region of similar size to the CO(1-0) beam. Interferometric observations of the CO detections are being made with the CARMA and Plateau de Bure arrays, and these will find molecular gas which is more extended than the 30m beam.
3.2 Duplicate observations
NGC 3412, NGC 3941, NGC 4026, and NGC 4346 were observed for this project and were also observed with the 30m telescope by Welch & Sage (2003). The two sets of observations have similar noise levels and the results in all four cases are consistent between the two papers. NGC 3941, NGC 4026, and NGC 4346 are non-detections in both papers. In the case of NGC 3412, Welch & Sage (2003) claim a detection in CO(1-0) at about the significance level. We find no detection but have somewhat worse noise so that the flux upper limit we claim is 50% higher than the flux they quote. Similarly, NGC 7332 and NGC 7457 were also observed by Welch & Sage (2003) although using the NRAO 12m telescope, and the non-detections reported here are consistent with those data (our sensitivity is worse for NGC 7457).
NGC 3193, NGC 4494, and NGC 4697 have CO spectra from the 30m telescope both in this paper and in Sage et al. (2007), with similar noise levels. NGC 821, NGC 3226, NGC 3377, NGC 3379, NGC 3640, NGC 4697, and NGC 5845 have CO spectra published both in this paper and in Welch, Sage, & Young (2010). Seven of these 10 (all except NGC 3640, NGC 4494 and NGC 3226) are non-detections in both datasets. For NGC 4494, Sage et al. (2007) claim a detection at about the 3 level in CO(1-0); the feature is weak and broad, and is not duplicated in their 2-1 spectrum. We do not find any suggestive features in our spectrum and so we claim a non-detection at a flux level about 30% smaller than the detection claimed by Sage et al. (2007). For NGC 3640, Welch, Sage, & Young (2010) find a 3 detection in CO(2-1) but not in CO(1-0); we find no emission in somewhat more sensitive data. For NGC 3226, Welch, Sage, & Young (2010) again claim a 3 detection in CO(1-0) at a velocity of 1100 km s-1; however, our new optical spectroscopy indicates the stellar systemic velocity to be 1321 km s-1 Cappellari et al. (2011a) and our formal sum over 300 km s-1 centered on the optical velocity finds no detection. Given the nature of detections, there is no glaring inconsistency between these observations.
As mentioned in Combes et al. (2007), there are a small number of detections which are observed by two teams. NGC 4150 is detected both by Combes et al. (2007) and by Welch & Sage (2003) using the 30m; the CO(1-0) fluxes are entirely consistent, but the CO(2-1) fluxes differ by a factor of two. The difference could easily arise from the telescope pointing, as Young, Bureau & Cappellari (2008) have shown that the CO emission in NGC 4150 is compact and a small pointing offset could mean that much of it is observed at a lower gain. NGC 3489 shows a factor of two difference in both CO lines between those papers, which could again be a pointing problem or inaccurate spectral baselines. Finally, it is worth remembering that the absolute calibration of these millimetre observations is not normally better than 10%–20%. These comparisons suggest that in the fainter detections the flux levels (hence H2 masses) might really be uncertain by up to 50%. This is especially true for the CO(2-1) line where the telescope pointing becomes both more critical and more difficult because of the smaller beam.
Eleven of the ATLAS3D members have also been observed with the BIMA, CARMA, and Plateau de Bure interferometers. Comparisons of the single dish and interferometer total flux measurements for NGC 3032, NGC 4150, NGC 4459 and NGC 4526 are presented by Young, Bureau & Cappellari (2008); for NGC 2768 by Crocker et al. (2008); and for NGC 4550 by Crocker et al. (2009a). Recent observations of NGC 524, NGC 3489, NGC 4477, and NGC 7457 at the Plateau de Bure are reported by Crocker et al. (2010). In general there is reasonable agreement, given the cautionary note mentioned above. Our 30m nondetection of NGC 7457 is confirmed at the Plateau de Bure. NGC 4550, which is a non-detection here, does have a small amount of molecular gas that is quite compact and more easily detected by an interferometer with a smaller synthesized beam. The interferometric flux of NGC 3489 is larger than what was found with the 30m because the molecular gas is extended over an area somewhat larger than the 30m beam. Other detections are consistent in total flux and linewidth between the single dish and the interferometer.
3.3 Literature Data
NGC 3607, NGC 4111, NGC 4143, NGC 4203, NGC 4251, and NGC 5866 were observed with the 30m telescope by Welch & Sage (2003). We use molecular masses derived from their reported CO(1-0) line intensities, scaled to the conversion factor and the distance that we assume. The method used by Welch & Sage (2003) for estimating uncertainties and upper limits is similar to the method used here, with the slight difference that the velocity range used for summing varies between 200 and 400 km s-1 instead of our constant 300 km s-1. Similarly, NGC 3073, NGC 3605, NGC 4283, and NGC 4636 were observed by Sage et al. (2007) and we take results from that paper. The CO emission in NGC 5866 and NGC 3607 seems to be extended, as the line is detected in pointings offset from the galaxy nucleus. However, for consistency with the rest of our observations, only the data from the central pointings are used here. Data for NGC 3522 are taken from Welch, Sage, & Young (2010).
The most recent single dish CO spectrum of NGC 4476 is published by Wiklind et al. (1995), but the signal-to-noise ratio in that spectrum is quite low. We consider the CO(1-0) flux measured by Young (2002) in a map made with the BIMA array to be more reliable and have used that value.
NGC 4278 was observed at the IRAM 30m telescope by both Combes et al. (2007) and Welch, Sage, & Young (2010). The first paper reports a tentative detection of 2.10.41 K km s-1 in the 1-0 line, whereas the second reports a upper limit of 1.9 K km s-1. An observation with the IRAM Plateau de Bure interferometer reports a more sensitive upper limit (Crocker et al., 2010). The nondetection of Welch, Sage, & Young (2010) is used here.
4 RESULTS
4.1 CO detection rate
The derived H2 masses and limits for all ATLAS3D sample members are listed in the last column of Table The ATLAS3D project – IV: the molecular gas content of early-type galaxies††thanks: Based on observations carried out with the IRAM 30m Telescope. IRAM is supported by INSU/CNRS (France), MPG (Germany) and IGN (Spain). . For non-detected galaxies, the quoted mass limits correspond to three times the statistical uncertainty in an integral over the assumed line width. There are 56 detections out of 259 sample members with CO data, giving an overall detection rate of 0.22 0.03. The quoted error is a formal uncertainty assuming a binomial distribution. Thus, the current detection rate is consistent with the value 0.28 0.08 reported by Combes et al. (2007) for the much smaller and somewhat closer SAURON sample. Of the 56 total detections, 46 are detected at greater than in both the CO(1-0) and CO(2-1) lines. Six additional galaxies (NGC 0509, NGC 2685, NGC 3245, NGC 4283, NGC 4476, and NGC 6798) are detected in only the CO(1-0) line, though NGC 4476 does not have high quality data in the 2-1 line. Three galaxies (NGC 3599, NGC 4036, and NGC 4643) are formally detected only in the CO(2-1) line.
The detection rate reported here is a strict lower limit to the true incidence of molecular gas in early-type galaxies. The case of NGC 4550 was already mentioned above. In addition, NGC 2685 (detected here in the 1-0 line but not 2-1) is known to have a significant amount of molecular gas that is located outside of our central pointing position (Schinnerer & Scoville, 2002). For the sake of consistency and homogeneity, we use our own data for these two galaxies in the current analysis and simply bear in mind that we have not yet found all of the molecular gas in early-type galaxies. Due to the finite sensitivity of the observations there is, of course, also a detection bias against broad and weak lines.
Our current detection rate is strikingly inconsistent with the 0.78 0.17 detection rate quoted by Welch & Sage (2003) for a volume-limited sample of S0 galaxies. Even if we exclude from our ATLAS3D sample the 25% with types (ellipticals, as classified in LEDA), our detection rate is still only 0.28 0.03. The sample of Welch & Sage (2003) has a factor of 10 fewer galaxies than are presented here, but the reasons for the difference in detection rate are still not obvious. Welch & Sage (2003) exclude known Virgo Cluster members, though as we will show later, our detection rate is not much lower in the Virgo Cluster. We will also show that our detection rate is not a strong function of stellar luminosity over the range covered here (). Thus, other factors such as selection criteria and sensitivities may contribute to the difference. The luminosity selection of Welch & Sage (2003) is done on a luminosity, which means that at the faint end of the sample the members will be preferentially bluer than other galaxies of similar stellar mass. They could thus have larger molecular content per unit stellar mass. And as we have mentioned above, it is clear that greater sensitivity would produce a greater detection rate. Welch & Sage (2003) have integrated down to a mass limit which is a fixed fraction of the optical luminosity of the galaxy, and in some cases this limit is several times deeper than we have been able to achieve. On the other hand, our limits are deeper for other objects especially at high luminosities. Since the integrated CO properties are not trivially related to the optical properties (Combes et al., 2007), it is not clear which of the two strategies (fixed thermal noise level or fixed CO/ ratio) would be expected to produce a greater detection rate.
4.2 Distribution and temperature of molecular gas
Figure 2 shows the 30m spectra obtained in the CO(1-0) and CO(2-1) lines towards the detected galaxies, along with their optical velocities. The detected lines were fit with a Gaussian to provide estimates of the peak intensity, central velocity, and FWHM (Table The ATLAS3D project – IV: the molecular gas content of early-type galaxies††thanks: Based on observations carried out with the IRAM 30m Telescope. IRAM is supported by INSU/CNRS (France), MPG (Germany) and IGN (Spain). ). In a few cases the detected line is obviously better described by a double-horned spectrum than by a Gaussian, and these were fit with a template which uses a parabolic shape between two sharp line edges. Comparisons of Gaussian and double-horned fits revealed that the two shapes gave almost identical estimates for the CO systemic velocity and line width, so those parameters are robust to the details of the line shape in these cases of moderate signal-to-noise ratio. In many other cases the line is too asymmetric to be well fit by either of these parametrizations, and in these cases the peak intensity, central velocity, and FWHM are measured directly from the spectra.


Galaxies that were fit with a double-horned profile shape include NGC 2764, NGC 3182, NGC 3665, NGC 4429, NGC 4435, NGC 4526, and UGC 06176. Other galaxies that show signs of a double-horned shape such as a flat top and shoulders above the Gaussian, or steeper sides than the Gaussian, include IC 1024, NGC 524, NGC 3626, NGC 4119, NGC 4281, NGC 4596, NGC 4643, NGC 6014, NGC 7465, PGC 058114, and UGC 05408. The classic mechanism for producing a double-horned shape is that in a disc with a flat rotation curve, the material along the major axis (near the line of nodes) all has much the same projected velocity and it is the extreme velocity (Wiklind et al., 1997). Thus we find that almost a third of the detections show signs that the gas is in a regular disc with a flat rotation curve. Profiles that do not show a double-horned shape could indicate that the gas does not extend as far as the flat part of the rotation curve, that the disc is face-on, the gas is not in a disc, or that the signal-to-noise ratio of the line is simply too low. Thus, the true incidence of regular discs is likely to be larger than 30%.
At least 13 of the detected lines are visibly asymmetric, and again that must be a lower limit since the detectability of asymmetries requires relatively high signal-to-noise ratios. These asymmetries could arise from a gas distribution which is intrinsically lopsided (as if the gas were recently acquired and has not yet settled into dynamic equilibrium). They could also arise if the gas’s spatial extent is comparable to or larger than the size of the beam and pointing errors cause some of the gas, even in a regular disc, to fall outside of the beam. Notable examples of asymmetric profiles include IC 1024, NGC 1222, NGC 3626, NGC 3665, NGC 4335, NGC 4573, NGC 4694, NGC 4710, NGC 5173, NGC 7465, PGC 056772, PGC 058114, UGC 05408, and UGC 09519. NGC 3607 and NGC 5866 (Welch & Sage, 2003) also fall into this category, and their gas is known to be spatially extended from detections in multiple pointings.
Systemic velocites for the CO lines (Table The ATLAS3D project – IV: the molecular gas content of early-type galaxies††thanks: Based on observations carried out with the IRAM 30m Telescope. IRAM is supported by INSU/CNRS (France), MPG (Germany) and IGN (Spain). ) are in good agreement with our newly measured optical velocities; the difference between those two velocities has a dispersion of only 16 km s-1. Outliers, for which the velocity difference is greater than 50 km s-1, include only cases in which our central pointing is not expected to have recovered all of the CO emission (NGC 2685) or cases in which the CO line is faint, so that it might be intrinsically asymmetric or double-horned (NGC 6798, NGC 3245). If there were members of the sample that had recently acquired their gas from an external source, they might have revealed themselves via molecular gas which had not yet settled into the center of the galaxy’s potential. However, we find no convincing evidence for any of these cases. More detailed probes of the dynamical status of the molecular gas will require interferometric CO maps.
The integrated CO(2-1)/CO(1-0) emission ratio is listed in Table The ATLAS3D project – IV: the molecular gas content of early-type galaxies††thanks: Based on observations carried out with the IRAM 30m Telescope. IRAM is supported by INSU/CNRS (France), MPG (Germany) and IGN (Spain). , and Figure 6 plots the integrated CO(2-1) intensity against the CO(1-0) intensity when at least one line is detected. Since only one central beam has been observed, the spatial region covered is approximately four times smaller in CO(2-1) than in CO(1-0) and the line ratio is affected by both the excitation temperature and the spatial distribution of the gas. If the CO emission uniformly fills both the CO(1-0) and the CO(2-1) beam and both lines are optically thick, with the same excitation temperature, one expects the integrated intensity in K km/s to be the same in both lines. This result occurs because, by definition, the measured brightness temperature is a specific intensity averaged over the beam area. If, however, the CO emission is compact compared to the beams (point spread functions) then the measured intensity in the CO(2-1) line should be larger by up to a factor of 4. Subthermal excitation (e.g. Braine & Combes, 1992) would decrease the intensity of the J=2-1 line relative to J=1-0, if densities are not large enough to populate the upper rotational levels.

Most data points in Figure 6 have between 1 and 4, suggesting that in most cases the emission does not fill both beams uniformly nor is it extremely compact. Intermediate size scales, in which the extent of the emission is comparable to or smaller than the beams, are probably the most common. Two interesting outliers are NGC 1266 and NGC 4684, which have quite high CO(2-1)/CO(1-0) line ratios (), suggesting compact gas distributions. A few cases show the intensity of the CO(2-1) line to be anomalously low, i.e. below the 1:1 relation. These cases could be due to either subthermal excitation or pointing errors which cause the intensity of the 2-1 line to be underestimated.
Molecular gas in nearby spirals is observed to have surface densities ranging from in some galaxy nuclei to a few tens of in the outer discs (Regan et al., 2006). Indeed, sensitive observations of both HI and CO emission in spirals suggest that a typical cold gas disc in a spiral becomes dominated by molecular gas when the total gas surface density is greater than about 14 (Leroy et al., 2008). For comparison, Figure 7 shows the distribution of the average molecular surface densities among the CO detections of our sample. Since our data consist of a single pointing only, those surface densities are averages over the 30m beam (2 to 4 kpc in diameter), based on the intensity of the 1-0 line. Mass densities are multiplied by a factor of 1.36 to account for helium. The molecular surface densities in the CO-rich ATLAS3D galaxies are well within the range occupied by nearby spirals, and 25% of our detections have average surface densities greater than 50 . Galaxies showing signs of double-horned or asymmetric profiles (Table The ATLAS3D project – IV: the molecular gas content of early-type galaxies††thanks: Based on observations carried out with the IRAM 30m Telescope. IRAM is supported by INSU/CNRS (France), MPG (Germany) and IGN (Spain). ) have a surface density distribution which resembles that of the whole sample, with the caveat that such signs cannot be identified if the signal-to-noise ratio is low. The apparent dearth of double-horned or asymmetric profiles at small surface densities may only be an effect of the noise level. These considerations suggest that the CO discs in early-type galaxies probably have gross characteristics which are not too different from the molecular discs in spirals.

The galaxies with the highest average surface densities are NGC 1266 (230 ) and NGC 4710 (210 ). Since the line ratios for NGC 1266 already indicate that the gas distribution is more compact than the 1-0 beam, this galaxy’s true molecular surface density is even higher than 230 . In fact, high resolution interferometric observations show the molecular gas in the galaxy is so compact that the surface densities are on the order of (Alatalo et al., 2011).
4.3 CO linewidths
As mentioned above, the CO line shapes and widths carry information about the gas kinematics and radial extent, and appropriate analysis of the linewidth distribution can help extract this information at least in a statistical sense. The 1300 km s-1 bandwidth should be large enough to detect all reasonable CO lines, if the signal-to-noise ratio were not a limitation. In practice, of course, for a fixed H2 mass, spreading the emission over a larger velocity range will decrease the amplitude of the peak and make the line more difficult to detect. And since a broad CO line implies a massive host galaxy with a deep potential well, a bias against the detection of broad lines could potentially affect the statistical analysis of molecular mass distributions.
In this context it is useful to consider the effects of our analysis procedures on the detectability of faint emission lines. A line of low amplitude may erroneously be included in the estimate of the spectral baseline level. Then, in searching for detections, we sum the baseline-subtracted spectrum over a 300 km s-1 velocity range, which (of course) will not be the entire line if the linewidth is larger than 300 km s-1. Both of these procedures make the recovered line area systematically smaller than the “true” line area for weak lines. However, for lines of 300 km s-1 or narrower, the recovered area is a constant fraction of the “true” area regardless of the linewidth. Monte Carlo simulations of our analysis procedure confirm this expected result. The simulations also confirm the strong bias against broader lines (at a fixed line area) for linewidths greater than 300 km s-1. For example, typical nondetections in our sample have thermal noise levels such that an integral over 300 km s-1 has an uncertainty of 0.33 K km s-1. A line of 3.3 K km s-1 area and 600 km s-1 width (amplitude 5.5 mK), and a typical thermal noise level, actually has only a 40% chance of being recovered as a detection by our analysis procedures if it is mistakenly included in the baseline estimate, though it has a 97% chance if it isn’t included in the baseline. Thus, for lines of 300 km s-1 or narrower there should be no bias in the detectability as a function of linewidth (for a fixed line area), though for lines broader than 300 km s-1 the effect can be severe at small amplitudes.
Figure 8 shows the observed distribution of CO linewidths in the ATLAS3D sample. As described in section 4.2, these are the FWHM of either a fitted Gaussian or a double-horned profile (in fact both methods give the same width for profiles which are obvious double-horns). Three galaxies which each have two features detected at greater than 3 formal significance in a Gaussian fit are here interpreted as faint double-horned profiles; they are NGC 4281 and NGC 4643 in J=2-1 (634 km s-1 and 366 km s-1 wide, respectively) and NGC 4596 in J=1-0 (231 km s-1 wide). Six detections from Welch & Sage (2003) and Sage et al. (2007) do not have fitted linewidths quoted in their discovery papers, and in these cases the linewidths are estimated from plots of the spectra; four of the six are asymmetric enough that fits would be useless in any case.
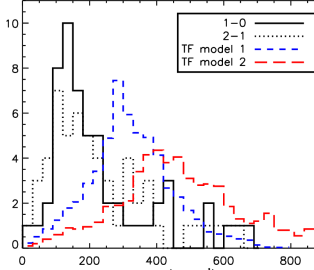
The observed CO linewidths can be compared to simple model distributions generated as follows. In “TF model 1,” an estimated is generated for each ATLAS3D galaxy from its MK via the S0 Tully-Fisher relation of Williams, Bureau & Cappellari (2010). For each member of the sample we then generate 20 model CO linewidths as where the inclinations are random and the probability of an inclination is . The model CO linewidth distribution is scaled down in amplitude by the factor of 20 and by the global detection rate 0.22 to appear as the histogram in Figure 8. In “TF model 2,” a similar procedure is followed except that is generated from the galaxy’s dynamical mass, again using the relations of Williams, Bureau & Cappellari (2010), and in this case only the CO detections are used. Additional details on the dynamical masses are given in Section 5.2.
These models show the expected CO linewidth distributions under some non-trivial assumptions: (1) that the Tully-Fisher relations quoted above are appropriate; (2) that the CO is always in relaxed discs which reach to the flat, asymptotic value of the circular velocity curve; and (3) in the case of model 1, that the CO-rich galaxies have the same MK and circular velocity distribution as the entire sample. The third assumption is addressed in Section 5 below, where we show that the CO detection rate is not dependent on MK. There is a modest bias in the CO detection rate with dynamical mass, but model 2 already corrects for that bias by using only the CO detections. Some justification for the second assumption is suggested by the preponderance of double-horn profiles, but interferometric maps and independently-derived circular velocity profiles will be required in order to check for which galaxies the assumption is not satisfied. Four cases are discussed in detail by Young, Bureau & Cappellari (2008).
It is apparent that we have detected many more relatively narrow lines, of FWHM 100-200 km s-1, than would be expected in either of the simple models. Based on the above analysis of our detection procedures, we believe that the observed peak at around 150 km s-1 and the associated drop in the histogram between 150 km s-1 and 300 km s-1 are not imposed by our methodology. They could be related to a breakdown of the assumptions, which would mean that we don’t have an accurate estimate of or the CO doesn’t extend far enough in radius to trace in some cases. Using the profile full width at 20% of the peak, rather than at 50%, would eliminate some of the discrepancy but not all of it. For Gaussian profiles that change would increase the measured width by a factor of 1.5, but for double-horn profiles it should not affect the measured width. There are also several observational effects which would tend to produce an overabundance of narrow lines. Narrow lines will arise if the CO is extended and pointing errors prevent the detection of one horn of a double-horned profile (as in an extreme version of our CO 2-1 spectrum of NGC 3665). If the CO is in a ring whose radius is larger than the 30m beam, a narrow line may also result. Based on optical images, this effect may be a problem for a galaxy such as NGC 5379. Both of these discrepancies would also be rectified with interferometric maps. One impact of these effects is that care is required when using the CO linewidths for a Tully-Fisher study (Davis et al., 2011).
5 MOLECULAR MASS CORRELATIONS
One of the major unsolved questions concerning the molecular gas in early-type galaxies is its origin – whether it has been present in one form or another since the galaxies were assembled or whether it was more recently acquired from some external source. The ATLAS3D data give a wealth of information on the structural, dynamical, and stellar population properties of the galaxies, or in other words, their assembly and star formation histories. Examination of which types of galaxies are gas-rich and which are gas-poor may help to address the origins of the gas and, by implication, its role in the evolution of different kinds of early-type galaxies. Figures 9 through 17 compare the molecular gas contents to various other properties of the host galaxies. We discuss the implications of these results below.
5.1 Stellar luminosity
Figure 9 shows the distribution of molecular mass with -band luminosity and a histogram of MK for the CO-detected galaxies. CO emission is detected over nearly the entire range of luminosities in the sample, and there is no clear trend in M(H2) versus MK. There is a small hint of a decrease in the detection rate at the highest luminosities. Only one of the 13 galaxies with is detected, whereas 3 would have been expected at the global average detection rate. However, the statistical significance of this difference is low. A stellar mass of corresponds to at a typical stellar mass-to-light ratio of (Bell et al., 2003); the CO detection rate among galaxies brighter than this is 6/25 = 0.24 0.09, consistent with the global average.

A Kolmogorov–Smirnov (KS) test on the distributions of CO detections and nondetections indicates that they are consistent with each other (the probability that those two distributions could have been drawn from the same parent population is 0.52). Thus we infer a constant CO detection rate at all luminosities from to . Refuting that model will require observations of many more galaxies brighter than , but such galaxies are rare in the local universe.
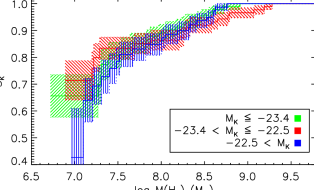
The dependence of molecular mass on galaxy luminosity can also be investigated by comparing the cumulative H2 distribution functions for high, medium, and low luminosity galaxies (Figure 10). Since the bulk of the CO observations produced non-detections (“censored” data) , the appropriate statistical tool is the Kaplan-Meier estimator for the cumulative distribution function of a randomly censored sample. We calculate the Kaplan-Meier estimator using the software packages ASURV version 1.3 (Isobe & Feigelson, 1990; Feigelson & Nelson, 1985) and R (R Development Core Team, 2009), with consistent answers from both packages. Here we divide the ATLAS3D sample approximately into thirds by luminosity, i.e. and The CO detection rate in these bins is 19/92, 17/88, and 20/79, respectively. Figure 10 shows that the M(H2) distributions for these three luminosity bins are all consistent with each other, an impression that is confirmed by the Gehan, logrank, and Peto two-sample tests. Specifically, in the assumption that the H2 mass distributions for the bright and faint galaxies are drawn from the same underlying population, the probability of measuring a difference as large as the one observed is estimated at 0.57 to 0.60. For comparison, the “dichotomy” stellar mass of (Kauffmann et al., 2003) occurs at for (Bell et al., 2003); this stellar mass is in the middle luminosity bin. Our analysis indicates no measurable difference in the H2 content of galaxies as a function of their stellar luminosity.
The use of the Kaplan-Meier methodology merits some discussion, as it assumes the censoring pattern is random (e.g. Wall & Jenkins, 2003). In this case the censoring in brightness temperature is certainly not random, as observations were made to a fixed brightness temperature noise level. However the censoring in H2 mass and M(H2)/LK should be approximately random, for the reasons discussed by Isobe & Feigelson (1992), O’Sullivan et al. (2001), and Wall & Jenkins (2003). Multiplication by the square of distance and division by the optical luminosity effectively serve to randomize the censoring pattern in those derived quantities, since our sample spans a range of distances and there is no hint of a dependence of CO emission on optical luminosity in our sample (Figure 9). Thus we believe the assumption of random censoring is justified. In addition, our objectives are to assess the similarity of the cumulative distribution functions of different subsets of our data and there is no reason to believe that the censoring should differ from one subset to another.
As mentioned above, the practical difficulty of detecting a broad and weak spectral line means that a given mass of molecular gas will be easier to detect in a face-on galaxy or in an edge-on galaxy with a small circular velocity than in an edge-on galaxy with a circular velocity of 200 km s-1 or higher. This effect could cause the H2 mass distribution to be underestimated in the highest luminosity bin. Careful simulations would be required to gauge the magnitude of the effect, but the sense of the correction would be to increase the incidence of molecular gas in the highest luminosity galaxies.
The lack of a correlation between H2 mass and stellar luminosity has been interpreted in the past to mean that the molecular gas is unrelated to internal stellar mass loss (e.g. Knapp & Rupen, 1996; Wiklind et al., 1995). The assumption is that internal mass loss would produce a linear relationship between stellar luminosity and H2 mass. However, if the mass loss material is shock-heated to K or higher by the relative stellar velocities or is otherwise heated by ambient hot gas, it would be difficult to predict how much of it might be able to cool and re-form molecules. Environmental and feedback effects would also complicate the relationship between the stellar luminosity and the amount of molecular gas present in a galaxy. Thus, we argue that one cannot infer either internal or external origin for the gas based on the M(H2)-MK relationship alone (or the lack of one). The value of the ATLAS3D project is, of course, that other structural and kinematic parameters and stellar population information are available for the sample as well.
5.2 Dynamical mass
In spite of the lack of a relationship between CO content and MK, there is some evidence for a modest dependence of the CO content on the dynamical mass and a closely related quantity, the global stellar velocity width . Figure 11 shows that the CO detection rate for galaxies with km s-1 is relatively high, 0.38 0.05, whereas for km s-1 it is 0.14 0.03. The median for CO detections is 99 km s-1, whereas for nondetections it is 137 km s-1. The effect in dynamical mass is more subtle, so that the CO detection rate above a dynamical mass of is 0.19 0.03 and below is 0.25 0.04. A KS test on the dynamical masses of CO detections and nondetections gives a probability of 6.5% that they could have been drawn from the same parent population. However, the Kaplan-Meier estimators show no significant differences in H2 masses of high and low mass galaxies.
For both and dynamical mass the sense of the difference is that lower mass galaxies are more likely to be detected. It is curious that the magnitude of the effect is much stronger in than in dynamical mass. The details of the scaling relations between those two quantities are beyond the scope of this paper, but it is helpful to be precise about their definitions. Cappellari et al. (2006) explain that is the second moment of the galaxy’s luminosity-weighted line of sight velocity distribution (LOSVD). Because it is constructed by fitting a Gaussian to a stack of all spectra within the effective radius, it includes contributions from both the mean stellar rotation and the velocity dispersion approximately as where is the projected mean stellar rotation velocity and is the local stellar velocity dispersion. Cappellari et al. (2006) discusses the use of in the virial mass as The dynamical mass used here is, however, derived from stellar dynamical models of the SAURON stellar kinematics (Cappellari et al., 2010), using the Jeans anisotropic modelling technique of Cappellari (2008). It can be understood as where is the total dynamical mass within a sphere containing half of the galaxy light. In addition, as is generally dominated by the stellar mass, approximates the stellar mass but should not be conflated with the total halo mass out to the virial radius. The quantities and for the ATLAS3D sample will be published in Cappellari et al., in preparation.
Several different effects could be responsible for the dependence of the CO detection rate on and dynamical mass. We note first that molecular gas likely does induce star formation, and the younger stellar populations should be both brighter and dynamically colder than the rest of the stars. Star formation should not affect the dynamical mass or , though, as already includes both the rotation and the dispersion components of the velocity width. Instead, the dependence of the CO detection rate on dynamical mass and could be driven by either or both of (1) an observational bias against the detection of broad CO lines, as described above, and (2) a downsizing or rejuvenation effect in which the more massive galaxies are less likely to contain molecular gas. The observational bias would manifest itself as a deficit of CO detections in edge-on high mass galaxies compared to face-on high mass galaxies. A downsizing effect would be consistent with much other recent work on star formation histories as a function of galaxy mass (e.g. Rogers et al., 2010; Zhu, Blanton & Moustakas, 2010; Thomas et al., 2010).
Of course, regardless of whether the dependence on dynamical mass is an observational bias or a real downsizing effect (or both), something of a ‘conspiracy’ between the mass and the mass-to-light ratio is required in order to reproduce the result that the CO detection rate is completely independent of MK. This issue can also be investigated in greater detail with estimates of the stellar population mass-to-light ratios of the ATLAS3D galaxies.

5.3 Morphological type
There is a significant difference in the CO detection rate between the galaxies traditionally classified as elliptical and lenticular. The ATLAS3D sample contains 68 galaxies whose morphological type in LEDA is (ellipticals). Only 3 of the 56 total CO detections are in this group, for a detection rate of 0.05 0.03. These detections are NGC 2768, NGC 5173, and NGC 4283, and the latter is of marginal quality (Sage et al., 2007). However, we caution that these morphological types are generally based only on photographic imaging and have the limitations (or perhaps “features”) that they carry little kinematic information and that the presence of a dust lane in the optical photographs could cause a galaxy to be classified as lenticular rather than elliptical.
Interferometric imaging shows that the molecular gas in early-type galaxies is invariably associated with dust lanes (Young, 2002, 2005; Young, Bureau & Cappellari, 2008), so that if the morphological classification is indeed biased by the presence of a dust lane then it is nearly a foregone conclusion to find a higher CO detection rate in lenticulars than in ellipticals. Indeed, Paper II tabulates the evidence for dust discs, dusty filaments, and blue regions in optical images of the ATLAS3D galaxies. Of the galaxies with one or more of such features, 3/49 (6%) are classified as elliptical and 46/49 as lenticular; but of the galaxies with no dust or blue features, 64/209 (31%) are elliptical and 145/209 are lenticular. Of course these statistics do not prove a dust- or star formation-bias in morphological classification, but they are consistent with such an interpretation.
From a different point of view, the SAURON observations of kinematics in early-type galaxies have shown that there is often little if any structural difference between lenticulars and ellipticals (Emsellem et al., 2004), so a purely isophotal classification contributes little to our understanding of their formation histories.
5.4 Specific angular momentum
Emsellem et al. (2007) advocate that a more fundamental way to classify early-type galaxies is with the parameter, a simplified and dimensionless version of the luminosity weighted specific angular momentum. It encapsulates some of the information on the degree of ordered vs. random motions (i.e. rotational vs. pressure support) that one gets from the classic ratio. In addition, as some systems show rotation only within a few hundred pc of the nucleus, the parameter also reveals something about the spatial extent of the rotation through the radial contribution to the specific angular momentum. Slow rotators (including galaxies with rotation only at small radii) have small values of . In an update of this earlier work, Paper III demarcates fast and slow rotators at where is the photometric ellipticity and both quantities are measured as luminosity-weighted averages over the effective radius. Paper III also discusses the relationship between the traditional E/S0 and the slow/fast rotator classifications. There is some degree of alignment between the systems, as the slow rotators are mostly classified as ellipticals. However, the converse is not true, as 66% of the ellipticals in ATLAS3D are fast rotators. The consistency between the systems is only strong at the extremes of and .
Figure 12 shows normalized H2 masses and CO detection rates as a function of the ratio , and Table 1 shows that the CO detection rate among slow rotators (0.060.04) is significantly lower than that among fast rotators (0.240.03). The CO detections in slow rotators are NGC 1222 and NGC 4476. Of these two, NGC 1222 is kinematically disturbed due to a recent interaction (Paper II). NGC 4476 also presents a complex structure as its stellar velocities drop towards the outer regions of the SAURON field and show signs of reversing at yet larger radii (A. Crocker, private communication). In short, there are few detections among the slow rotator class.

Both a galaxy’s value of and its projected circular velocity are affected by inclination, of course. However, if a galaxy has small due to being face-on, and if it has molecular gas, it will have a relatively narrow CO line and will be easy to detect. Thus the deficit of CO detections among galaxies of small is not due to inclination effects because they have the wrong sense to reproduce such a deficit.
The deficit of CO detections among galaxies of small is also not driven by the trend with or the dynamical mass. Paper III shows that the slow rotators do tend to be more massive than fast rotators, and they have higher values, but the overlap between fast and slow rotators is sufficient that this effect can be controlled. Of the 36 slow rotators in the ATLAS3D sample, we begin with the subset of 31 which have 260 km s-1 or the 34 which have . These subsets have CO detection rates of 0.06 0.04, consistent with Table 1. We construct a matched sample of fast rotators by selecting (at random) one fast rotator which has within 12 km s-1 or within 0.1 dex of each slow rotator. By design, then, the matched sample of fast rotators has a distribution of or which is statistically indistinguishable from that of the slow rotators. Repeating the process times, we find that the CO detection rate in our matched samples of fast rotators is 0.24 0.07 when the matching is done by or 0.36 0.07 when matched by . Here quoted uncertainties are dispersions in the set of trials. In short, the CO detection rate is still significantly higher among fast rotators than among slow rotators, even after controlling for the and distributions.
5.5 Internal kinematic structure
Paper II documents photometric evidence for internal substructures such as bars, rings, shells, tidal tails, and anemic spiral structures in the ATLAS3D sample. We find no evidence for a difference in CO detection rate between galaxies showing these types of features and galaxies without them (Table 1). Similarly, we measure the misalignment angle between the stellar photometric and kinematic axes, as these misalignments can be indications of non-axisymmetric components like bars. A KS test reveals no significant difference in the misalignment angles of CO detections and nondetections.
Paper II also uses the features in the stellar velocity maps to classify the internal kinematic structure of galaxies. Galaxies are primarily classified as “regular rotators,” or RR, when the velocity field resembles that of a thin, inclined disc such as a spiral galaxy. Others are “non-regular,” or NRR. The RR class has a nearly one-to-one overlap with the fast rotators as defined by ellipticity and , so these are assumed to be the same family of galaxies. Table 1 shows that the CO detection rate is significantly higher in the RR class than in the NRR class, and the ‘matched sample’ technique described in the previous section again confirms this result after controlling for different and dynamical mass distributions of the RR and NRR classes.
In terms of kinematic structure, early-type galaxies are quite heterogeneous (Paper II); they include galaxies with no observable rotation at all (non-rotators like M87), galaxies with kinematically distinct or even counterrotating cores, galaxies comprised of two counterrotating stellar discs, such as IC 0719, and (infrequently) face-on disc-like regular rotators. Table 1 shows no particularly strong evidence that the CO detection rate differs among these subtypes. The CO detections in NRR galaxies are NGC 1222, NGC 3073, IC 0719, and NGC 7465, of which NGC 1222 is also a slow rotator and is discussed in the previous section. Curiously, the “two peak” galaxies made of two counterrotating discs are exceptions to the general rule that the CO detection rate is higher at low . This type has the lowest dispersions of any of the kinematic classes. Their relatively low CO detection rate (compared to the low galaxies in general) should not be an effect of the observational bias against broad lines because, given their small masses, they should not have broad CO lines.
Papers II and III clearly show that early-type galaxies have a variety of different assembly histories. Some general patterns of assembly are conducive to retaining a high specific angular momentum within an effective radius whereas other patterns are not. The patterns which develop low specific angular momentum can include misaligned major mergers, or mergers in which the orbital angular momentum cancels the spin angular momenta of the progenitors (Bois et al. in prep), or a large number of randomly oriented minor mergers. Our analysis suggests that galaxies with these types of assembly histories are least likely to be detected in CO. These may be the cases in which the misaligned angular momenta of gaseous discs coming into the merger caused the gas to drop to the center of the galaxy where it was consumed or destroyed. Alternatively, they may have lost their cold gas prior to their assembly or they may be less likely to acquire cold gas after assembly. Future work on gas kinematics and star formation histories can help to distinguish between these scenarios.
| Type | CO | no CO | Total | CO det. rate |
|---|---|---|---|---|
| Fast | 54 | 169 | 223 | 0.240.03 |
| Slow | 2 | 34 | 36 | 0.060.04 |
| regular rotators | 51 | 162 | 213 | 0.240.03 |
| non-regular | 4 | 40 | 44 | 0.090.04 |
| Ring/bar/shell/tail | 23 | 79 | 102 | 0.230.04 |
| No features | 31 | 122 | 153 | 0.200.03 |
| Kinematic subtypes | ||||
| Non-rotator | 1 | 6 | 7 | 0.140.13 |
| KDC/CRC | 1 | 18 | 19 | 0.050.05 |
| 2 peaks | 2 | 9 | 11 | 0.180.11 |
| NRR/no feature | 1 | 11 | 12 | 0.080.08 |
| RR subtypes | ||||
| RR/2max | 11 | 25 | 36 | 0.300.08 |
| RR/other | 40 | 137 | 177 | 0.230.03 |
Notes: Kinematic classifications are taken from Papers II and III. This table and the next exclude NGC 4486A, for which we have no CO data.
5.6 Environment: Virgo Cluster
The ATLAS3D sample contains 58 galaxies that are within 3.5 Mpc of M87 and are considered members of the Virgo Cluster. Many of these galaxies (including M87) have distance measurements from surface brightness fluctuations (Tonry et al., 2001; Mei et al., 2007; Cappellari et al., 2011a). When a surface brightness distance is available, it is used in the computation of a galaxy’s distance to M87. Where independent distance measurements are not available for known Virgo Cluster members, a distance of 16.5 Mpc is used as that is the adopted mean distance of subclusters A and B (Mei et al., 2007). For comparison, those authors also quote the surface brightness fluctuation distance to M87 as 17.2 Mpc, the typical distance uncertainties for their data are 0.7 Mpc, and the line-of-sight depth of the cluster is 0.6 Mpc 0.1 Mpc (1). We note also that there is no statistically significant difference in the MK, dynamical mass, or distributions of cluster and non-cluster galaxies in ATLAS3D, so there is no detectable mass segregation in this sample.
Twelve of the 57 Virgo Cluster members with CO data are detected, for a cluster detection rate of 0.210.05 or less than 1 lower than the detection rate for the sample as a whole. However, since the Virgo Cluster is relatively nearby and we have observed our sample to a fixed noise level, it is more appropriate to compare the detection rate in Virgo to that of galaxies at a similar distance. The entire ATLAS3D sample contains 89 galaxies at Mpc and 124 galaxies at Mpc; thus, within 24 Mpc, half of the sample galaxies are Virgo Cluster members and half are not. A restricted comparison of galaxies within 24 Mpc mitigates the effect of distance, since the typical H2 mass limit at 24 Mpc is only a factor of 2 higher than at 17 Mpc. Table 2 compares the CO detection statistics inside and outside of the Virgo Cluster for all galaxies within 24 Mpc, and also for the subset of fast rotators within 24 Mpc. The detection rate among cluster members (0.21 0.05) is nominally lower than the detection rate of non-members (0.29 0.06) and the detection rate of the entire sample (0.22 0.03). However, the difference is at only the 1 level in the combined uncertainties so more detailed investigations of the CO luminosity functions are appropriate.
| CO | no CO | Total | CO det. rate | |
| Virgo Cluster | 12 | 45 | 57 | 0.210.05 |
| non-cluster | 19 | 47 | 66 | 0.290.06 |
| Total | 31 | 92 | 123 | 0.250.04 |
| Fast rotators only | ||||
| Virgo Cluster | 11 | 37 | 48 | 0.230.06 |
| non-cluster | 19 | 42 | 61 | 0.310.06 |
| Total | 30 | 79 | 109 | 0.270.04 |
The top two rows of Figure 13 present the normalized masses M(H2)/LK versus the local bright galaxy density, both for the entire ATLAS3D sample and for the subset of galaxies closer than 24 Mpc. Normalized H2 masses are also plotted as a function of the deprojected distance to M87. Paper VII explains the calculation of the local density as the number density of galaxies brighter than MK = , averaged within a sphere which contains 10 such neighbors and quoted in units of Mpc-3. In the ATLAS3D parent sample, which includes all morphological types, all galaxies outside the Virgo Cluster have densities and all but two of the Virgo Cluster members have . A KS test on the distributions of local densities for CO detections and nondetections (both within 24 Mpc; middle row, right side panel of Figure 13) gives a 31% probability that they could be drawn from the same parent population.

The preceding evidence shows that the CO detection rate is nearly the same for early-type galaxies in the Virgo Cluster and outside the cluster. Clearly the galaxies in the cluster are not entirely devoid of molecular gas. However, it is still possible that they may have suffered some modest stripping, which would show up as systematically smaller H2 masses or M(H2)/LK ratios for cluster members than for non-members. In order to test this hypothesis, Figure 14 presents the Kaplan-Meier estimators for the cumulative H2 and M(H2)/LK distribution functions for galaxies inside the Virgo Cluster, galaxies outside the cluster but closer than 24 Mpc, and the entire ATLAS3D sample. In these analyses the null hypothesis is that the cluster and non-cluster galaxies have the same underlying M(H2) and M(H2)/LK distributions, and a test statistic as large as the observed one would be expected 25% to 60% of the time for M(H2) and 46% to 57% of the time for M(H2)/LK. These probabilities are not so small that the null hypothesis can be confidently excluded. In other words, the available data do not show a striking or reliable difference between the M(H2) and M(H2)/LK distribution functions for cluster and non-cluster galaxies.
While there may be a slight decrease in the CO detection rate in the Virgo Cluster compared to field early-type galaxies within 24 Mpc, there is as yet no good evidence that the molecular gas contents are systematically smaller inside the cluster. This result stands in opposition to the situation for atomic gas; HI detection rates for early-type galaxies in the Virgo Cluster are acutely low compared to detection rates in the field (di Serego Alighieri et al., 2007; Grossi et al., 2009; Oosterloo et al., 2010). Additional discussion of galaxy evolution in the cluster can be found in Section 6.
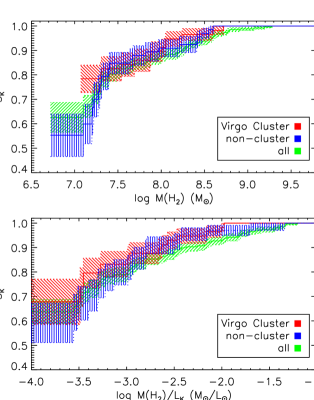
Figure 15 shows the systemic velocities of CO detections and non-detections as a function of projected distance to M87, as well as the velocity distributions of ATLAS3D Virgo Cluster members and CO detections. The Virgo Cluster members have a centrally peaked distribution with a velocity dispersion of 525 km s-1, in good agreement with the value of 573 km s-1 measured for elliptical and lenticular galaxies by Binggelli, Tammann, & Sandage (1987). The 12 Virgo Cluster CO detections have a dispersion of 414 km s-1 and are also peaked about the cluster systemic velocity. This behavior is in marked contrast to the broad, flat velocity distribution of the spirals in the cluster, which are characterized by a dispersion of 888 km s-1 (Binggelli, Tammann, & Sandage, 1987). A more complete characterization of the spirals is provided by Rubin et al. (1999), who find that the disturbed spirals are approaching a relaxed velocity distribution whereas the regular, undisturbed spirals have a broad, flat, non-virialized velocity distribution.

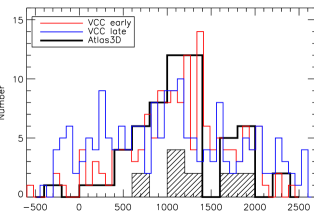
The dynamical status of the CO-detected Virgo Cluster early-type galaxies can be further assessed by comparing their velocity distribution to those of the other early-type galaxies and the late-type galaxies in the cluster. A comparison sample of late-type galaxies in the Virgo Cluster is provided by the Sa-Sm, Im, BCD, Sp, and dS galaxies in the Virgo Cluster Catalog (VCC; Binggelli, Sandage, & Tammann, 1985). For this purpose we select from the VCC only the galaxies identified as cluster members and having measured systemic velocities. The corresponding early-types are the VCC E, S0, dE, and dS0. Velocity distributions for these samples are shown in Figure 16. The results of KS tests on the velocity distributions of these various samples are shown in Table 3. Notably, the velocity distribution of the ATLAS3D Virgo Cluster CO detections is consistent with those of the ATLAS3D Virgo Cluster CO non-detections and the VCC early-types. However, our ATLAS3D cluster CO detections are not consistent with the VCC late-type galaxies; that null hypothesis can be rejected at the 95% confidence level. Thus, while the number of CO detections among the ATLAS3D Virgo Cluster galaxies is still relatively small, the indications are that the dynamical properties of the CO-rich early-type galaxies are more consistent with the virialized early-type galaxies than with the spirals and irregulars. It thus appears unlikely that our CO detections are in new or recently added cluster members.
| Sample | A3D Virgo Cluster | A3D Virgo Cluster |
|---|---|---|
| (all) | (CO detections) | |
| VCC late-types | 0.021 | 0.052 |
| VCC early-types | 0.863 | 0.262 |
| A3D CO nondet. | 0.999 | 0.228 |
Notes— Matrix of probability values for the KS test statistic on the systemic velocity distributions of ATLAS3D galaxies and members of the Virgo Cluster Catalog.
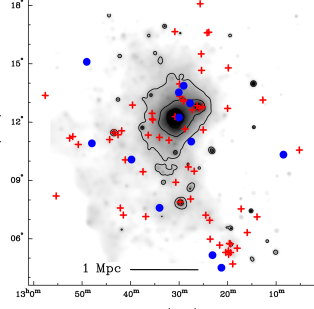
Figure 17 shows the spatial distribution of ATLAS3D targets and CO detections in the Virgo cluster, compared to the location of the hot gas (Böhringer et al., 1994). Several of the CO detections are seen in projection in the central regions occupied by hot gas. Notable among these are NGC 4429, NGC 4476, NGC 4435, NGC 4477, and NGC 4459, all of which are secure CO detections and are within 2° (0.6 Mpc) of M87. NGC 4435 and NGC 4477 are members of the Markarian chain to the northwest of M87. NGC 4435, NGC 4476, and NGC 4459 have distance measurements from surface brightness fluctuations (Mei et al., 2007), and these place them within a true distance of 1.3 Mpc from M87. Thus, they must be physically located within the hot intracluster medium. In combination with the centrally peaked velocity distributions, these data suggest that the CO detections in the Virgo Cluster are indeed a dynamically relaxed population that does not avoid the center of the cluster. This behaviour is markedly different to that of atomic gas in the spirals of the Virgo Cluster, which show strong HI deficiencies near the center of the Cluster (Cayatte et al., 1990; Chung et al., 2009).
5.7 Groups and low density regions
Figure 13 shows possible evidence for an enhanced CO detection rate at the outskirts of the Virgo Cluster, 15–20° (5–8 Mpc) from M87. This result is driven by the galaxies near NGC 4278 (north of M87), the Leo II or NGC 3607 group (northwest of M87), and galaxies near NGC 4684 (south of M87). For the galaxies 5 to 8 Mpc from M87 the CO detection rate is 8/17 = 0.47 0.12, not quite above the global detection rate.
Paper VII also presents measurements of a local density for the ATLAS3D members; this estimate gives the projected density of galaxies within a cylinder of height 600 km s-1 and radius such that 3 neighbors are inside. As discussed in Paper VII, is large both for members of the Virgo Cluster and for galaxies in small, tight groups. A KS test on the distributions of CO detections and nondetections (at distances less than 24 Mpc) gives a probability of 7% that the two distributions could have been drawn from the same parent – not a compelling difference, as we found for the cluster vs. non-cluster comparisons in the previous section. Future studies investigating the effect of the group environment on CO content or pre-processing of molecular gas in galaxies infalling into the cluster will require larger samples.
A strong trend in CO detection rate with local density can only be found when considering the lowest density environments and lowest mass galaxies in this sample. The CO detection rate rises to 0.55 0.09 for galaxies of km s-1 and density Mpc, or 0.41 0.11 for galaxies of dynamical mass in the same density regime. However, as Figure 13 suggests, the lowest density environments primarily occur at large distances in our sample and they drop out of the subsamples limited to 24 Mpc. In addition, the trend with local density is not significant for galaxies of km s-1 or mass . Thus, this increase in the CO detection rate of low mass, relatively isolated early-type galaxies did not manifest itself in the previous discussions of environmental effects.
The half-dozen most CO-rich galaxies of the sample do tend to be in relatively low density environments, which is undoubtedly an important clue to their formation histories. This CO-rich subsample includes NGC 1266, NGC 2764, NGC 1222, NGC 3665, UGC 09519, and NGC 6014. These galaxies are all more distant than 20 Mpc, in regions where the local luminosity density is a factor of 10 to 200 lower than that in the Virgo cluster, and the distances to their nearest neighbors are 1 Mpc. If the accretion of cold gas is most efficient in these kinds of poor environments, such accretion might provide a natural explanation for the most CO-rich ATLAS3D galaxies. Signatures of the accretion could be sought in the CO kinematics (through interferometric imaging) or in the gas-phase metallicity.
5.8 Young stellar populations
As one might expect, the molecular gas content of early-type galaxies is tightly correlated with dust and young stellar populations, which are indicated for the ATLAS3D sample in Paper II. The CO detection rate is 37/48 (0.77 0.06) in galaxies with dust discs, dusty filaments, or blue regions, but only 17/208 (0.08 0.02) in galaxies with none of those features.
Figure 18 shows that the galaxies that are rich in molecular gas also have evidence of young stars, as traced by the H absorption line strength index in the classic Lick/IDS system from our SAURON spectroscopy (McDermid et al. in prep). Here the H absorption line strength is measured in an aperture of radius which has a median value of 9.3″ for the sample so is similar to the spatial region in which we have searched for CO J=1-0 emission. However, the trend is not qualitatively different when apertures of radius or are used. Naturally, as H is an equivalent width measure, both it and M(H2)/LK are roughly normalized to the total stellar luminosity.
There is a clear trend for galaxies with strong H absorption to exhibit higher M(H2)/LK ratios, indicating that higher gas fractions are found in galaxies with larger proportions of young stars. Intuitively, the trend makes sense, since the H2 reservoir is thought to fuel any ongoing star-formation. However, the relation is not especially tight, with more than an order of magnitude variation in M(H2)/LK at a given line strength. This spread probably reflects the differences between these two tracers. The mass of H2 should trace the instantaneous star-formation activity, with some caveats noted below; H, in combination with metal indices, traces a weighted average age which is strongly biased towards recent star formation activity. Differences in recent star formation histories (especially bursty or merger-driven activity) could produce some of the scatter. Some scatter is also probably due to the fact that H is degenerate for a broad range of possible star formation histories and does not exclusively trace recent ( Gyr) events.
Another cause of scatter in the H-H2 trend could be differing star formation efficiencies, driven by several mechanisms. For example, the shape and depth of the potential can affect the stability of the cold gas disc embedded within it (Martig et al., 2009). It may also be that the molecular gas reservoir is prevented from forming stars in some galaxies due to some form of heating, e.g. from AGN activity or hot phases of stellar evolution. Crocker et al. (2010) explore the latter in some detail, proposing connections to the optical emission from the ionized gas. We postpone such analysis using the full ATLAS3D data complement for future papers in this series.
There are a number of CO upper limits found in galaxies with strong H absorption ( Å). At face value, these facts could indicate the presence of a significant young stellar population without any associated molecular gas, perhaps immediately following exhaustion of the gas after a significant star-formation event. However, those H2 upper limits are quite high because the galaxies are distant. These non-detections may be comparable in their H2 properties to the detected galaxies, simply falling just below our sensitivity level. At the other extreme, while there are many objects with intermediate values of H that are both CO-detected and undetected, there are no CO detections in objects with H Å. The galaxies showing no evidence for young stellar populations also show no evidence of molecular gas within our detection thresholds.

6 DISCUSSION
6.1 Rejuvenation
Thomas et al. (2010) have used SDSS spectroscopy to measure luminosity-weighted simple stellar population (SSP) ages for a sample of low redshift, morphologically selected early-type galaxies. They interpret a population of younger galaxies as examples of a rejuvenation phenomenon driven by recent ( Gyr) star formation. They also argue that this rejuvenation phenomenon is mass- and density-dependent, being more common (or perhaps stronger?) in low mass galaxies in low density environments.
This picture is at least qualitatively consistent with what we find for the molecular gas content of early-type galaxies, with a few important caveats. For example, the results presented above suggest that the environmental density dependence of the H2 content is extremely subtle except at the lowest densities. We do detect molecular gas in galaxies covering the full range of densities and dynamical masses probed in our sample. Thus, if the rejuvenation episodes are indeed connected to the present-day H2 content, we should expect that they are not exclusively limited to low mass galaxies in low density environments. A model which fits all of this data should also allow for significant rejuvenation rates in high mass galaxies and in high density environments.
6.2 Molecular masses of early-type galaxies
The cumulative H2 and M(H2)/LK distribution functions in Figures 10 and 14 remind us that the majority of the galaxies studied here are not detected in CO emission, so that we are really only studying the gas-rich ends of the distribution functions.
Given that the galaxies studied here are early-type galaxies, the molecular masses detected are surprisingly high in some cases. Three of the sample galaxies have molecular masses greater than (assuming their true CO-H2 conversions are not too different from that used here). These galaxies have comparable amounts of molecular gas to the Milky Way and several times more than in M31 (Dame et al., 1993), yet they are clearly not spirals. The highest molecular masses found in this sample are also comparable to that of the merger remnant NGC 7252 (Dupraz et al., 1990) and of some lenticular polar ring galaxies (Galletta et al., 1997). Nine of the sample have molecular masses greater than , which is comparable to the molecular mass of the radio galaxy Fornax A (NGC 1316; Horellou et al., 2001). The mass of molecular gas in Cen A (NGC 5128) is also a few (Morganti, 2010), at an assumed distance of 4.2 Mpc (Tonry et al., 2001). These two galaxies meet all of the ATLAS3D selection criteria except for the Declination limit, so they could have been in the sample if they were elsewhere on the sky. The comparison to Cen A is especially notable because, in spite of its most flamboyant optical appearance, Cen A would not have been the most CO-rich galaxy in the sample. At M(H2)/LK , it would also have been solidly in the middle of our detected M(H2)/LK values ( to /). Evidently the molecular gas content of a galaxy does not serve as a reliable predictor of its optical morphology, nor does the optical morphology reliably predict the molecular content.
The molecular gas masses detected here are, however, not quite in the same league as that of Perseus A (NGC 1275), which has some of cold H2 (Salome et al., 2006). NGC 1275 is the central galaxy of the Perseus Cluster, and Lim, Ao, & Dinh-V-Trung (2008) have recently shown that its molecular gas is distributed in filaments which are free-falling towards the center of the potential. The behaviour is kinematically consistent with the molecular gas having cooled and condensed out of the galaxy’s X-ray halo. But this behaviour is probably not taking place in the bulk of the CO-detected ATLAS3D galaxies, since the preponderance of double-peaked CO profiles suggests relaxed discs in regular rotation. If the molecular gas in the ATLAS3D galaxies did originate through condensation, it must have happened at least a crossing time ago, so that the gas has settled.
Both the CO detection rate and the H2 mass distribution function are independent of the stellar luminosity, for early-type galaxies. When considering all types of galaxies, of course, there is a very strong dependence of galaxy properties on the stellar mass; galaxies with stellar masses above tend to be old spheroids, hence poor in cold gas, and less massive galaxies tend to be HI- and CO-rich young discs (e.g. Kauffmann et al., 2003). Among the red sequence galaxies, van der Wel et al. (2009) argue that a stellar mass of is a watershed above which there are very few flattened, disc-like systems. However, among the red sequence galaxies, we find no evidence that a stellar mass of or has any particular significance for a galaxy’s molecular content.
6.3 On the origin of the molecular gas in early-type galaxies
Our results show that at least 22% of all early-type galaxies contain molecular gas, and Figure 14 presents the inferred M(H2)/LK distribution for M(H2)/LK /. It is worthwhile to recall that this volume-limited survey, complete down to , has no selection on either FIR luminosity or magnitude, so that it finally eliminates selection bias towards the galaxies which are more likely to have star formation activity.
Using interferometric HI observations, Oosterloo et al. (2010) have recently argued that ongoing accretion of cold atomic gas is common for field early-type galaxies. In some cases the atomic gas retains a large angular momentum and forms structures which are tens of kpc in extent, but in other cases the atomic gas is found in the central few kpc of the galaxy, coincident with a molecular disc. Oosterloo et al. (2010) thus propose that at least some of the molecular gas in early-type galaxies may have been accreted in this manner, possibly in the form of atomic gas, settling into a regular disc and converting into molecular gas as its density increases. Future comparisons of molecular, atomic, ionized gas and stellar kinematics in the ATLAS3D galaxies should help quantify the role of cold accretion as an origin for the molecular gas.
There is a notable decrease in the CO detection rate of the slow or “non-regular” rotators. Since this effect remains even after controlling for the mass distributions of slow and fast rotators, it must be driven by rather than by mass. In other words, the molecular content is more strongly correlated with the types of orbits the stars occupy than with the number of stars.
The rate of internal stellar mass loss in a galaxy should naturally be independent of the angular momentum of the stars. However, the mass loss material should retain some memory of the specific angular momentum of its progenitor stars. If the material suffers shock heating, cooling, and condensation to form molecular gas, it may lose some specific angular momentum in the process, but we would generally expect the mass loss material in a slowly rotating galaxy to have smaller specific angular momentum than that in a fast rotator. If this scenario accounts for the bulk of the molecular gas in early-type galaxies, then, we might expect the molecular gas discs in the galaxies of small (intrinsic) to be more compact than in the large- galaxies. Indeed, the molecular gas in the galaxies of small might have dropped to the nucleus and been consumed, instead of forming a kpc-scale disc. From a different perspective, if the formation processes of slow rotators are different from those of fast rotators, it might also be the case that the formation of a slow rotator inevitably destroys any cold gas disc. In short, there are at least two scenarios which can explain a lack of cold gas in the slow rotators.
The detection of CO in Virgo Cluster early-type galaxies provides a useful perspective on the issue of the origin of the molecular gas. We have argued above that the CO detection rate among ATLAS3D Virgo Cluster members may be modestly lower than the detection rate outside the cluster, but the statistical significance of the result is not great. Furthermore, the M(H2) and M(H2)/LK distributions inside and outside the cluster are consistent. We have also argued that the CO-detected galaxies are virialized in the cluster potential and deeply embedded within the hot intracluster gas. Despite a long residence in the cluster, their molecular content is not much lower than in early-type galaxies outside the cluster.
Both the internal and external scenarios for the origin of molecular gas seem significantly more problematic when galaxies are already deep in the cluster potential. Cold mode accretion of gas through filaments may be viable for relatively isolated galaxies, but gas falling into the cluster should more likely end up as hot gas in the general cluster potential than as cold gas in a specific galaxy. Acquisition of molecular gas through major or minor mergers also should be rare, both because the cluster’s high velocity dispersion decreases the merger rate and because mergers tend to fling gas to large radii (Barnes, 2002) where it would be highly vulnerable to stripping. These general expectations are supported by the N-body plus hydrodynamical simulations of Tonnesen et al. (2007), which find that galaxies commonly accrete gas when they are far in the outskirts of a cluster but rarely accrete gas after they pass through the cluster’s virial radius. In addition, the internal stellar mass loss scenario also seems difficult because that material is expected to shock heat to X-ray temperatures (e.g. Mathews & Brighenti, 2003) and the concomitant low densities will again make the material vulnerable to stripping. More detailed simulations of the evolution of hot gas in cluster members (not cluster-dominant or cluster-centered galaxies) would help to quantify this impression. In short, these considerations suggest that the CO-detected Virgo Cluster early-type galaxies probably did not acquire their cold gas after entering the cluster. This in turn suggests that they have retained their molecular gas since they fell into the cluster, and that the gas has not cycled through a low density phase in that time.
6.4 On the removal of H2
If the CO-rich Virgo Cluster early-type galaxies are indeed virialized, so that they have been in the cluster for at least a relaxation time yet have still retained their molecular gas, we conclude that it must be difficult to remove the molecular gas entirely. For a cluster such as Virgo, with several hundreds to thousands of galaxies, the relaxation time is at least 10 crossing times (Binney & Tremaine, 2008) and the crossing times are on the order of a Gyr. Thus we infer that the virialized, CO-rich early-type galaxies have probably retained their gas over at least several Gyr in the cluster.
It has been suspected for many years that it would be more difficult to remove the molecular gas from cluster galaxies than to remove the atomic gas. The reasoning is straightforward: the molecular gas has much higher volume and surface densities than atomic gas, and in addition it tends to be deeper in the galaxy’s potential well, both of which make it more tightly bound. Individual galaxies do sometimes show evidence that their molecular hydrogen is being stripped (Sivanandam, Rieke & Rieke, 2010; Vollmer et al., 2008), but in general the observations of molecular gas in Virgo Cluster spirals have suggested that H2 deficiencies are subtle, even when HI deficiencies are strong (Kenney & Young, 1989). The same now appears to be true for Virgo Cluster early-type galaxies, where H2 deficiencies are subtle to nonexistent whereas HI deficiencies are strong (di Serego Alighieri et al., 2007; Grossi et al., 2009). In this context, the Virgo Cluster early-type galaxies provide a useful perspective because (as we argued above) they have been residing in the cluster longer than the spirals. They therefore provide longer time-baseline views into the gas removal processes than spirals do.
Recent adaptive-mesh hydrodynamical simulations of Tonnesen & Bryan (2009) suggest that when a galaxy first falls into the intracluster medium, it suffers a brief but intense period of stripping when most of the loosely-bound material is removed. In the simulations, dense molecular gas can be retained through this period, in agreement with the implications of our work. Quantitatively, the standard Gunn & Gott (1972) stripping criterion requires a ram pressure For typical values we take a circular velocity of 200 km s-1, molecular gas surface density at 100 , and a radius of 1 kpc, based on the interferometric CO observations of Crocker et al. (2010). The ram pressure needed is then dyne cm-2. Vollmer (2009) finds that these kinds of pressures require a galaxy to approach within kpc of the Virgo Cluster center even if the velocity at closest approach is 2000 km s-1. Thus the molecular gas should be retained except on very high eccentricity orbits within the cluster. Tonnesen & Bryan (2009) also mention that angular momentum transfer to the non-rotating cluster gas can gradually drive the remaining molecular gas towards the center of its host galaxy. For all of these reasons, the CO-rich Virgo Cluster early-type galaxies could motivate longer simulation runs in an attempt to test whether these processes can transform an exponential gas disc (typical of spirals) into a rather compact, sharp-edged molecular disc such as those observed in NGC 4459, NGC 4526, and NGC 4477 (Young, Bureau & Cappellari, 2008; Crocker et al., 2010).
6.5 On the formation of fast rotators
While our early-type galaxies are today rather red in colour, they must have been blue during the epoch when their stars were forming. The mass distributions and morphologies of their progenitors are, however, the subjects of much debate. One major question is whether or not the fast rotator galaxies passed through a stage as spiral galaxies. Some authors suggest not. For example, Dekel et al. (2009) propose that if the matter accreting through cold streams into a protogalactic halo is highly clumped, the dynamical interactions between the clumps will counteract the tendency of cold gas to settle into a disc. In this manner a spheroid-dominated galaxy could form without ever passing through a disc-dominated stage, even if the bulk of the accreted baryons are in the form of cold gas.
Other popular scenarios propose to form fast rotator early-type galaxies by converting spirals. One aspect of the conversion must involve quenching the star formation activity (so as to redden and age the stellar population); another aspect is to effect the morphological change (dispersal of the spiral structure, disc thickening and/or bulge growth). It is often assumed that the removal of the cold gas will accomplish these objectives. Turning off new star formation would remove the continuous input of a dynamically cold stellar population, so that dynamical heating and thickening would naturally erase the non-axisymmetric spiral structures. Removal of the cold gas may not be necessary for this conversion process, though. Bournaud et al. (2007) have suggested that multiple minor mergers (with mass ratios of 10:1 and greater) will gradually thicken a spiral’s stellar disc and increase its central concentration (Sersic index). Martig et al. (2009) also remind us that if the gravitational potential can be sufficiently deepened, a cold gas disc could be simply rendered incapable of star formation activity. Our current work suggests that, indeed, some cluster galaxies can retain significant amounts of molecular gas even after being resident in the cluster for several Gyr.
We cannot, at present, confirm or refute the speculation that fast rotator early-type galaxies in the Virgo Cluster are the stripped, heated, and/or quenched remnants of spirals. We simply comment that if this is the case, the paradigm should not necessarily require all of the molecular gas to be removed in the conversion process. In a purely hydrodynamic stripping scenario, it would be interesting to test whether the star formation quenching and morphological change can be accomplished quickly enough by removing only some of the molecular gas and simply rearranging the rest. In the merger, morphological quenching, and clumpy accretion scenarios, it would be valuable to have statistical predictions for the properties (masses and spatial extents) of any cold gas discs which might remain.
7 SUMMARY
We present a 12CO J=1-0 and J=2-1 search in the galaxies of the ATLAS3D sample, a complete volume-limited sample of early-type galaxies with and with morphologies verified by inspection of optical (mostly SDSS) images. CO data from the IRAM 30m telescope are collected for 259 of the 260 members, including 204 new observations and the remainder collected from the literature. The upper limit for a sum over a 300 km s-1 linewidth corresponds to an H2 mass for the nearby sample members (11 Mpc) and a mass for the most distant members (40 Mpc). A few targets are observed significantly more deeply than that.
The detected CO line intensities correspond to H2 masses of = 7.10 to 9.29 and M(H2)/LK= to 0.063 /. The CO detection rate is 56/259 = 0.220.03, a rate known to be a lower limit since (1) molecular gas outside the central 22″ has not been observed, (2) we expect to be incomplete for linewidths greater than 300 km s-1, and (3) compact distributions suffer strong beam dilution. Many of the detections are brighter in CO(2-1) than in CO(1-0). The line profiles are often double-horned and/or asymmetric. These observations collectively suggest that the molecular gas is often found in regular rotating discs. It is sometimes in compact structures (smaller than the 12″ CO(2-1) beam, which is 1.1 kpc at 20 Mpc) and sometimes in structures comparable to or larger than the CO(1-0) beam (2.2 kpc at 20 Mpc). The linewidth distribution peaks at smaller widths than expected, suggesting that we have some cases in which the molecular gas reaches the galaxy’s asymptotic circular velocity and some in which it doesn’t. Molecular surface densities, averaged over the inner 2 to 4 kpc of the galaxies, are comparable to those found in spirals. Interferometric observations will be necessary in order to quantify those general impressions about the typical gas distributions.
There is a strong correlation between the presence of molecular gas and the presence of dust, blue features, and young stellar ages seen in H absorption. Thus, the molecular gas that we detect is often engaged in star formation.
The CO detection rate is not a function of luminosity over the range , and the H2 mass distribution function is also independent of stellar luminosity. The CO detection rate is a strong function of the global velocity width , with galaxies of km s-1 more than twice as likely to be detected. However, the dependence on the dynamical mass inferred from modelling the stellar kinematics is considerably more subtle. These considerations suggest that the effect is probably a combination of a downsizing trend and an observational bias in favor of detecting CO in face-on galaxies.
The CO detection rate is strongly correlated with the stellar specific angular momentum and internal kinematic substructure, such that slow rotators and non-regular rotators have much less molecular gas than their fast and regular rotating counterparts. This result remains true after controlling for the and dynamical mass dependences noted above. We suggest that either the assembly processes which built the slow rotators also destroyed or removed their molecular gas, or they are less likely to re-acquire molecular gas after assembly.
Approximately half of the fast rotators at distances less than 24 Mpc are members of the Virgo Cluster and half are not. The CO detection rate is modestly lower in cluster members than in non-members; however, it is important to note that the drop in detection rate is only a effect. There is no measurable difference in the H2 or M(H2)/LK distribution functions of cluster and non-cluster galaxies within 24 Mpc. CO-rich Virgo Cluster early-type galaxies are virialized in the cluster potential and they do not avoid the center of the cluster (unlike cluster spirals). Apparently they have retained their molecular gas through extended residences in the cluster.
The rarest, most gas-rich galaxies (M(H2)/LK /) are found in relatively low-density environments at distances beyond 24 Mpc. These results suggest that the CO-detected Virgo Cluster galaxies have CO-detected analogs of the same M(H2)/LK in the field, but there is in addition a small population of CO-rich objects in the field that is not found in the Virgo Cluster.
Acknowledgments
Thanks to Aeree Chung for providing the ROSAT Virgo cluster image in FITS format. The research was partially supported by grant NSF-0507432 to LMY, who also gives hearty thanks to the University of Oxford sub-department of astrophysics for hospitality under the STFC visitor grant. MC acknowledges support from a STFC Advanced Fellowship (PP/D005574/1) and a Royal Society University Research Fellowship. This work was supported by the rolling grants ‘Astrophysics at Oxford’ PP/E001114/1 and ST/H002456/1 and visitors grants PPA/V/S/2002/00553, PP/E001564/1 and ST/H504862/1 from the UK Research Councils. RLD acknowledges travel and computer grants from Christ Church, Oxford and support from the Royal Society in the form of a Wolfson Merit Award 502011.K502/jd. RLD also acknowledges the support of the ESO Visitor Programme which funded a 3 month stay in 2010. SK acknowledges support from the the Royal Society Joint Projects Grant JP0869822. RMcD is supported by the Gemini Observatory, which is operated by the Association of Universities for Research in Astronomy, Inc., on behalf of the international Gemini partnership of Argentina, Australia, Brazil, Canada, Chile, the United Kingdom, and the United States of America. TN and MBois acknowledge support from the DFG Cluster of Excellence ‘Origin and Structure of the Universe’. MS acknowledges support from a STFC Advanced Fellowship ST/F009186/1. NS and TD acknowledge support from an STFC studentship. The authors acknowledge financial support from ESO. LMY was assisted by statistician Marge Inovera, courtesy of T. and R. Magliozzi.
References
- Alatalo et al. (2011) Alatalo K., Blitz L., Young L. M., et al., 2011, ApJ, submitted
- Barnes (2002) Barnes J. E., 2002, MNRAS, 333, 481
- Bell et al. (2003) Bell E., et al., 2003, ApJS, 149, 289
- Binggelli, Sandage, & Tammann (1985) Binggelli B., Sandage A., Tammann G., 1985, AJ, 90, 1681
- Binggelli, Tammann, & Sandage (1987) Binggelli B., Tammann G., Sandage A. 1987, AJ, 94, 251
- Binney & Tremaine (2008) Binney J., Tremaine S. 2008, Galactic Dynamics, 2nd ed. (Princeton, NJ: Princeton University Press)
- Bournaud et al. (2007) Bournaud F., Jog C. J., Combes F., 2007, A&A, 476, 1179
- Böhringer et al. (1994) Böhringer, H., Briel, U. G., Schwarz, R. A., et al., 1994, Nature, 368, 828
- Braine & Combes (1992) Braine J., Combes F., 1992, A&A, 264, 433
- Cappellari (2008) Cappellari M., 2008, MNRAS, 390, 71
- Cappellari et al. (2006) Cappellari M., et al. 2006, MNRAS, 366, 1126
- Cappellari et al. (2007) Cappellari M., et al. 2007, MNRAS, 379, 418
- Cappellari et al. (2011a) Cappellari M., et al. 2011, MNRAS, in press (arXiv:1012.1551) (Paper I)
- Cappellari et al. (2011b) Cappellari M., et al. 2011, MNRAS, submitted (Paper VII)
- Cappellari et al. (2010) Cappellari M., et al. 2010, Highlights of Astronomy, 15, 81
- Cayatte et al. (1990) Cayatte V., van Gorkom J. H., Balkowski C., & Kotanyi C., 1990, AJ, 100, 604
- Ciotti, Ostriker & Proga (2010) Ciotti L., Ostriker J. P., Proga D., 2010, ApJ, 717, 708
- Chung et al. (2009) Chung A., van Gorkom J. H., Kenney J. D. P., Crowl H., & Vollmer B., 2009, AJ, 138, 1741
- Ciotti et al. (1991) Ciotti L., d’Ercole A., Pellegrini S., Renzini A., 1991, ApJ, 376, 380
- Combes et al. (2007) Combes F., Young L. M., Bureau M., MNRAS, 377, 1795
- Crocker et al. (2009a) Crocker A. F., Jeong H., Komugi S., et al., 2009, MNRAS, 393, 1255
- Crocker et al. (2008) Crocker A. F., Bureau M., Young L. M., Combes F., 2008, MNRAS, 386, 1811
- Crocker et al. (2010) Crocker A. F., Bureau M., Young L. M., Combes F., 2010, MNRAS, in press (arXiv:1007.4147)
- Dame et al. (1993) Dame T. M., Koper, E., Israel, F. P., & Thaddeus, P. 1993, ApJ, 418, 730
- Davis et al. (2011) Davis T. A., Bureau M., Young L. M., et al., 2011, MNRAS, submitted
- Dekel et al. (2009) Dekel A., Sari R., Ceverino D. 2009, ApJ, 703, 785
- Dickman et al. (1986) Dickman R. L., Snell R. L., Schloerb F. P., 1986, ApJ, 309, 326
- di Serego Alighieri et al. (2007) di Serego Alighieri S., Gavazzi G., Giovanardi C., Giovanelli R., et al, 2007, A&A, 474, 851
- Dupraz et al. (1990) Dupraz C., Casoli F., Combes F., Kazes I., 1990, A&A, 228, 5
- de Zeeuw et al. (2002) de Zeeuw P.T., et al., 2002, MNRAS, 329, 513
- Emsellem et al. (2004) Emsellem E., et al., 2004, MNRAS, 352, 721
- Emsellem et al. (2007) Emsellem E., et al., 2007, MNRAS, 379, 401
- Emsellem et al. (2011) Emsellem E., et al., 2011, MNRAS, in press (Paper III)
- Faber et al. (1997) Faber S. M., et al., 1997, AJ, 114, 1771
- Feigelson & Nelson (1985) Feigelson E. D., Nelson P. I. 1985, ApJ, 293, 192
- Galletta et al. (1997) Galletta G., Sage L. J., Sparke L. S., 1997, MNRAS, 284, 773
- Goudfrooij et al. (1994) Goudfrooij, P., Hansen, L., Jorgensen, H. E., & Norgaard-Nielsen, H. U. 1994, A&AS, 105, 341
- Grossi et al. (2009) Grossi M., di Serego Alighieri S., Giovanardi C., Gavazzi G., et al, 2009, A&A, 498, 407
- Gunn & Gott (1972) Gunn, J. E., Gott, J. R., III 1972, ApJ, 176, 1
- Horellou et al. (2001) Horellou C., Black J. H., van Gorkom J. H., Combes F., van der Hulst J. M., & Charmandaris V., 2001, A&A, 376, 837
- Huchtmeier, Sage & Henkel (1995) Huchtmeier W. K., Sage L. J., Henkel C., A&A, 300, 675
- Isobe & Feigelson (1990) Isobe T., Feigelson E. D. 1990, BAAS, 22, 917
- Isobe & Feigelson (1992) Isobe T., Feigelson E. D. 1992, ApJS, 79, 197
- Jeong et al. (2007) Jeong H., Bureau M., Yi S. K., Krajnović D., Davies R. L., 2007, MNRAS, in press
- Jesseit et al. (2005) Jesseit, R., Naab, T., Burkert, A. 2005, MNRAS, 360, 1185
- Kauffmann et al. (2003) Kauffmann G., Heckman T., et al. 2003, MNRAS, 341, 54
- Kenney & Young (1989) Kenney J. D. P., Young J. S., 1989, ApJ, 344, 171
- Knapp & Rupen (1996) Knapp G. R., Rupen M. P., 1996, ApJ, 460, 271
- Krajnović et al. (2011) Krajnović D., et al., 2011, MNRAS, in press (arXiv:1102.3801) (Paper II)
- Kuntschner et al. (2006) Kuntschner H., et al., 2006, MNRAS, 369, 497
- Lees et al. (1991) Lees J. F., Knapp G. R., Rupen M. P., Phillips T. G., 1991, ApJ, 379, 177
- Leon et al. (1998) Leon S., Combes F., Menon T. K., 1998, A&A, 330, 37
- Leroy et al. (2008) Leroy A., Walter F., Brinks E., et al. 2008, AJ, 136, 2782
- Lim, Ao, & Dinh-V-Trung (2008) Lim J., Ao Y., Dinh-V-Trung, 2008, ApJ, 672, 252
- Martig et al. (2009) Martig M., Bournaud F., Teyssier R., Dekel A., 2009, ApJ, 707, 250
- Mathews & Brighenti (2003) Mathews W. G., Brighenti F., 2003, ARA&A, 41, 191
- McDermid et al. (2006) McDermid R. M., et al., 2006, MNRAS, 373, 906
- Mei et al. (2007) Mei S., Blakeslee J. P., Côté P., et al. 2007, ApJ, 655, 144
- Morganti et al. (2006) Morganti R., et al., 2006, MNRAS, 371, 157
- Morganti (2010) Morganti R., 2010, PASA, in press (arXiv:1003.5568)
- Naab et al. (2006) Naab T., Jesseit R., Burkert A., 2006, MNRAS, 372, 839
- Oosterloo et al. (2010) Oosterloo T., Morganti R., Crocker A., Jütte E., 2010, MNRAS, in press (arXiv:1007.2059)
- O’Sullivan et al. (2001) O’Sullivan E., Forbes D. A., Ponman T. J., 2001, MNRAS, 328, 461
- Quillen et al. (1992) Quillen A. C., de Zeeuw P. T., Phinney E. S., Phillips T. G., 1992, ApJ, 391, 121
- R Development Core Team (2009) R Development Core Team, 2009, R: A language and environment for statistical computing. (Vienna: R Foundation for Statistical Computing) http://www.R-project.org
- Regan et al. (2006) Regan M. W., Thornley M. D., Vogel S. N., et al. 2006, ApJ, 652, 1112
- Rubin et al. (1999) Rubin V., Waterman, Kenney J. D. P., 1999, AJ, 118, 236
- Rogers et al. (2010) Rogers B., Ferreras I., Pasquali A., et al., 2010, MNRAS, 405, 329
- Sage & Welch (2006) Sage L. J., Welch G. A., 2006, ApJ, 644, 850
- Sage et al. (2007) Sage L. J., Welch G. A., Young L. M., 2007, ApJ, 657, 232
- Salome et al. (2006) Salomé P., Combes F., Edge A. C., et al., 2006, A&A, 454, 437
- Sarzi et al. (2006) Sarzi M., et al., 2006, MNRAS, 366, 1151
- Schinnerer & Scoville (2002) Schinnerer E., Scoville N., 2002, ApJ, 577, L103
- Sivanandam, Rieke & Rieke (2010) Sivanandam S., Rieke M. J., Rieke G. H., 2010, ApJ, 717, 147
- Strong et al. (1988) Strong A. W., Bloemen J. B. G. M., Dame T. M., et al., 1988, A&A, 207, 1
- Strong et al. (2004) Strong A. W., Moskalenko I. V., Reimer O., Digel S., Diehl R., 2004, 422, L47
- Thomas et al. (2005) Thomas D., Maraston C., Bender R., Mendes de Oliveira C., 2005, ApJ, 621, 673
- Thomas et al. (2010) Thomas D., Maraston C., et al., 2010, MNRAS, 404, 1775
- Tonnesen & Bryan (2009) Tonnesen S., Bryan G. L., 2009, ApJ, 694, 789
- Tonnesen et al. (2007) Tonnesen S., Bryan G. L., van Gorkom J., 2007, ApJ, 671, 1434
- Tonry et al. (2001) Tonry J. L., Dressler A., Blakeslee J. P., et al. 2001, ApJ, 546, 681
- van der Wel et al. (2009) van der Wel A., Rix H. W., Holden B. P., Bell E. F., Robaina A. R., 2009, ApJ, 706, L120
- Vollmer et al. (2008) Vollmer B., Braine J., Pappalardo C., Hily-Blant P., 2008, A&A, 491, 455
- Vollmer (2009) Vollmer B., 2009, A&A, 502, 427
- Wall & Jenkins (2003) Wall J. V., Jenkins C. R., Practical Statistics for Astronomers. Cambridge University Press, Cambridge
- Wardle & Knapp (1986) Wardle M., Knapp G. R., 1986, AJ, 91, 23
- Welch & Sage (2003) Welch G. A., Sage L. J., 2003, ApJ, 584, 260
- Welch, Sage, & Young (2010) Welch G. A., Sage L. J., Young L. M., 2010, ApJ, 725, 100
- Wiklind & Henkel (2001) Wiklind T., Henkel C., 2001, A&A, 375, 797
- Wiklind et al. (1995) Wiklind T., Combes F., Henkel C., 1995, A&A, 297, 643
- Wiklind et al. (1997) Wiklind T., Combes F., Henkel C., Wyrowski F., 1997, A&A 323, 727
- Williams, Bureau & Cappellari (2010) Williams M. J., Bureau M., Cappellari M., 2010, MNRAS, 409, 1330
- Yi et al. (2005) Yi S. K., et al., 2005, ApJL, 619, L111
- Young (2002) Young L. M., 2002, AJ, 124, 788
- Young (2005) Young L. M., 2005, AJ, 634, 258
- Young et al. (2006) Young L. M., Rosolowsky E., van Gorkom J. H., Lamb S. A., ApJ, 650, 166
- Young, Bureau & Cappellari (2008) Young L. M., Bureau M., Cappellari M. 2008, ApJ, 676, 317
- Zhu, Blanton & Moustakas (2010) Zhu G., Blanton M. R., Moustakas J. 2010, ApJ, 722, 491
| Galaxy | rms (1-0) | rms (2-1) | Vel. range | Ratio | Source | log M(H2) | |||
|---|---|---|---|---|---|---|---|---|---|
| mK | mK | km s-1 | K km s-1 | K km s-1 | (2-1)/(1-0) | ||||
| IC0560 | 3.86 | 9.40 | 1703.0 | 2003.0 | 0.106 ( 0.347) | -0.830 ( 0.758) | 1 | 7.67 | |
| IC0598 | 4.19 | 5.72 | 2106.0 | 2406.0 | -0.007 ( 0.457) | -0.340 ( 0.525) | 1 | 8.02 | |
| IC0676 | 4.84 | 4.92 | 1310.0 | 1516.0 | 11.641 ( 0.429) | 16.654 ( 0.343) | 1.43 (0.06) | 1 | 8.63 (0.02) |
| IC0719 | 2.80 | 2.74 | 1619.0 | 2022.0 | 3.472 ( 0.361) | 5.798 ( 0.311) | 1.67 (0.20) | 1 | 8.26 (0.04) |
| IC0782 | 3.05 | 3.86 | 2274.0 | 2574.0 | 0.337 ( 0.343) | 0.072 ( 0.333) | 1 | 7.92 | |
| IC1024 | 4.75 | 6.35 | 1359.0 | 1619.0 | 11.419 ( 0.428) | 15.631 ( 0.401) | 1.37 (0.06) | 1 | 8.61 (0.02) |
| IC3631 | 3.23 | 3.17 | 2672.0 | 2972.0 | 0.213 ( 0.268) | -0.006 ( 0.235) | 1 | 7.94 | |
| NGC0448 | 3.72 | 4.57 | 1758.0 | 2058.0 | -0.399 ( 0.345) | -0.767 ( 0.395) | 1 | 7.74 | |
| NGC0474 | 2 | 7.68 | |||||||
| NGC0502 | 3.08 | 3.57 | 2374.0 | 2674.0 | -0.344 ( 0.320) | 0.110 ( 0.291) | 1 | 7.88 | |
| NGC0509 | 3.50 | 4.27 | 2232.0 | 2323.0 | 0.477 ( 0.155) | 0.348 ( 0.165) | 1.04 | 1 | 7.48 (0.12) |
| NGC0516 | 3.31 | 5.71 | 2287.0 | 2587.0 | -0.150 ( 0.303) | 0.544 ( 0.442) | 1 | 7.82 | |
| NGC0524 | 3.07 | 3.65 | 2192.0 | 2618.0 | 2.843 ( 0.348) | 4.829 ( 0.414) | 1.70 (0.25) | 1 | 7.97 (0.05) |
| NGC0525 | 3.69 | 4.13 | 1989.0 | 2289.0 | 0.017 ( 0.330) | 0.658 ( 0.367) | 1 | 7.75 | |
| NGC0661 | 3.54 | 4.84 | 3665.0 | 3965.0 | 0.469 ( 0.329) | -0.126 ( 0.428) | 1 | 7.75 | |
| NGC0680 | 3.14 | 4.00 | 2778.0 | 3078.0 | -0.306 ( 0.291) | 0.030 ( 0.364) | 1 | 7.87 | |
| NGC0770 | 2.89 | 3.91 | 2393.0 | 2693.0 | 0.048 ( 0.319) | 0.028 ( 0.306) | 1 | 7.89 | |
| NGC0821 | 2.94 | 2.86 | 1568.0 | 1868.0 | -0.040 ( 0.331) | -0.056 ( 0.246) | 1 | 7.52 | |
| NGC0936 | 3.36 | 2.94 | 1279.0 | 1579.0 | -0.654 ( 0.324) | 0.108 ( 0.276) | 1 | 7.47 | |
| NGC1023 | 2 | 6.79 | |||||||
| NGC1121 | 3.36 | 4.30 | 2408.0 | 2708.0 | 0.367 ( 0.283) | 0.823 ( 0.346) | 1 | 7.81 | |
| NGC1222 | 4.41 | 6.13 | 2253.0 | 2603.0 | 17.354 ( 0.524) | 28.760 ( 0.560) | 1.66 (0.06) | 1 | 9.07 (0.01) |
| NGC1248 | 3.11 | 3.55 | 2067.0 | 2367.0 | 0.307 ( 0.287) | 0.055 ( 0.281) | 1 | 7.68 | |
| NGC1266 | 5.82 | 4.33 | 1750.0 | 2500.0 | 34.959 ( 1.068) | 104.397 ( 0.926) | 2.99 (0.09) | 1 | 9.28 (0.01) |
| NGC1289 | 3.41 | 4.49 | 2642.0 | 2942.0 | 0.263 ( 0.285) | -0.003 ( 0.343) | 1 | 7.89 | |
| NGC1665 | 3.62 | 5.53 | 2595.0 | 2895.0 | 0.506 ( 0.349) | 0.112 ( 0.394) | 1 | 7.95 | |
| NGC2481 | 3.36 | 5.79 | 2007.0 | 2307.0 | 0.030 ( 0.326) | 0.136 ( 0.492) | 1 | 7.79 | |
| NGC2549 | 2 | 7.06 | |||||||
| NGC2577 | 3.51 | 5.45 | 1912.0 | 2212.0 | -0.113 ( 0.294) | -0.350 ( 0.377) | 1 | 7.71 | |
| NGC2592 | 3.55 | 4.10 | 1829.0 | 2129.0 | 0.319 ( 0.305) | 0.905 ( 0.348) | 1 | 7.54 | |
| NGC2594 | 3.83 | 3.18 | 2212.0 | 2512.0 | 0.294 ( 0.302) | 0.046 ( 0.258) | 1 | 7.83 | |
| NGC2679 | 2 | 7.87 | |||||||
| NGC2685 | 2.78 | 7.20 | 746.0 | 931.0 | 1.158 ( 0.225) | 0.679 ( 0.425) | 1.10 | 1 | 7.29 (0.08) |
| NGC2695 | 2 | 8.01 | |||||||
| NGC2698 | 2.94 | 0.00 | 1750.0 | 2050.0 | -0.003 ( 0.237) | 0.000 ( 0.000) | 1 | 7.50 | |
| NGC2699 | 2 | 7.54 | |||||||
| NGC2764 | 5.21 | 7.18 | 2514.0 | 2944.0 | 16.198 ( 0.580) | 24.398 ( 0.847) | 1.51 (0.08) | 1 | 9.19 (0.02) |
| NGC2768 | 2 | 7.64 (0.07) | |||||||
| NGC2778 | 3.66 | 5.21 | 1875.0 | 2175.0 | 0.183 ( 0.330) | -0.719 ( 0.412) | 1 | 7.48 | |
| NGC2824 | 1.95 | 5.23 | 2552.0 | 2996.0 | 4.460 ( 0.334) | 6.175 ( 0.528) | 1.38 (0.16) | 1 | 8.65 (0.03) |
| NGC2852 | 4.15 | 4.37 | 1631.0 | 1931.0 | 0.176 ( 0.325) | 0.615 ( 0.359) | 1 | 7.68 | |
| NGC2859 | 3.71 | 4.73 | 1540.0 | 1840.0 | 0.319 ( 0.309) | 0.220 ( 0.364) | 1 | 7.61 | |
| NGC2880 | 3.43 | 7.69 | 1404.0 | 1704.0 | -0.088 ( 0.336) | -0.271 ( 0.511) | 1 | 7.44 | |
| NGC2950 | 3.54 | 4.89 | 1172.0 | 1472.0 | -0.115 ( 0.347) | -0.020 ( 0.465) | 1 | 7.12 | |
| NGC2962 | 3.73 | 8.97 | 1817.0 | 2117.0 | 0.074 ( 0.336) | -0.309 ( 0.712) | 1 | 7.85 | |
| NGC2974 | 2 | 7.65 | |||||||
| NGC3032 | 2 | 8.41 (0.01) | |||||||
| NGC3073 | 4 | 7.52 (0.07) | |||||||
| NGC3098 | 3.59 | 4.03 | 1247.0 | 1547.0 | 0.854 ( 0.305) | 0.222 ( 0.341) | 1 | 7.47 | |
| NGC3156 | 2 | 7.67 (0.09) | |||||||
| NGC3182 | 3.52 | 2.81 | 1942.0 | 2239.0 | 3.007 ( 0.346) | 4.166 ( 0.265) | 1.39 (0.18) | 1 | 8.33 (0.05) |
| NGC3193 | 4.04 | 4.19 | 1231.0 | 1531.0 | -0.081 ( 0.405) | -0.383 ( 0.315) | 1 | 7.91 | |
| NGC3226 | 3.52 | 3.72 | 1165.0 | 1465.0 | 0.306 ( 0.271) | 0.635 ( 0.294) | 1 | 7.41 | |
| NGC3230 | 3.52 | 7.08 | 2645.0 | 2945.0 | -0.374 ( 0.328) | -1.105 ( 0.571) | 1 | 8.00 | |
| NGC3245 | 3.67 | 4.76 | 1320.0 | 1495.0 | 0.736 ( 0.228) | 0.125 ( 0.256) | 1.04 | 1 | 7.27 (0.12) |
| NGC3248 | 3.47 | 5.34 | 1331.0 | 1631.0 | 0.095 ( 0.321) | -0.672 ( 0.483) | 1 | 7.55 | |
| NGC3301 | 3.57 | 3.13 | 1189.0 | 1489.0 | 0.526 ( 0.301) | 0.163 ( 0.271) | 1 | 7.46 | |
| NGC3377 | 2 | 6.96 | |||||||
| NGC3379 | 2 | 6.72 | |||||||
| NGC3384 | 2 | 7.11 | |||||||
| NGC3400 | 3.94 | 3.90 | 1291.0 | 1591.0 | -0.363 ( 0.384) | -0.090 ( 0.309) | 1 | 7.63 | |
| NGC3412 | 4.41 | 3.36 | 710.0 | 1010.0 | -0.238 ( 0.413) | -0.283 ( 0.269) | 1 | 6.96 | |
| NGC3414 | 2 | 7.19 | |||||||
| NGC3457 | 3.41 | 4.58 | 998.0 | 1298.0 | 0.489 ( 0.303) | -0.070 ( 0.306) | 1 | 7.35 | |
| NGC3458 | 4.06 | 3.04 | 1727.0 | 2027.0 | -0.674 ( 0.307) | 0.215 ( 0.223) | 1 | 7.73 | |
| NGC3489 | 2 | 7.20 (0.06) | |||||||
| NGC3499 | 3.57 | 3.21 | 1385.0 | 1685.0 | 0.861 ( 0.325) | 0.220 ( 0.249) | 1 | 7.62 | |
| NGC3522 | 7 | 7.28 | |||||||
| NGC3530 | 4.14 | 3.99 | 1744.0 | 2044.0 | 0.724 ( 0.341) | -0.398 ( 0.305) | 1 | 7.78 | |
| NGC3595 | 3.24 | 2.67 | 2027.0 | 2327.0 | 0.873 ( 0.311) | -0.043 ( 0.235) | 1 | 7.84 | |
| NGC3599 | 2.70 | 3.07 | 687.0 | 893.0 | 0.638 ( 0.221) | 0.959 ( 0.183) | 1.44 | 1 | 7.36 (0.08) |
| NGC3605 | 4 | 7.48 | |||||||
| NGC3607 | 3 | 8.42 (0.05) | |||||||
| NGC3608 | 2 | 7.58 | |||||||
| NGC3610 | 3.46 | 5.04 | 1557.0 | 1857.0 | -0.103 ( 0.320) | 0.026 ( 0.470) | 1 | 7.40 | |
| NGC3613 | 3.37 | 3.98 | 1901.0 | 2201.0 | -0.356 ( 0.309) | 0.312 ( 0.293) | 1 | 7.66 | |
| NGC3619 | 3.84 | 4.12 | 1303.0 | 1885.0 | 4.318 ( 0.510) | 3.806 ( 0.677) | 0.88 (0.19) | 1 | 8.28 (0.05) |
| NGC3626 | 5.25 | 4.25 | 1202.0 | 1731.0 | 6.998 ( 0.658) | 11.285 ( 0.569) | 1.61 (0.17) | 1 | 8.21 (0.04) |
| NGC3630 | 3.67 | 4.06 | 1349.0 | 1649.0 | -0.476 ( 0.350) | 0.482 ( 0.345) | 1 | 7.60 | |
| NGC3640 | 2.85 | 3.24 | 1148.0 | 1448.0 | 0.291 ( 0.306) | 0.382 ( 0.265) | 1 | 7.59 | |
| NGC3641 | 3.72 | 4.77 | 1630.0 | 1930.0 | 0.729 ( 0.373) | 0.036 ( 0.378) | 1 | 7.66 | |
| NGC3648 | 3.51 | 5.38 | 1820.0 | 2120.0 | -0.135 ( 0.319) | 0.008 ( 0.372) | 1 | 7.77 | |
| NGC3658 | 3.93 | 4.14 | 1889.0 | 2189.0 | 0.233 ( 0.339) | 0.582 ( 0.360) | 1 | 7.82 | |
| NGC3665 | 3.48 | 4.41 | 1737.0 | 2432.0 | 12.159 ( 0.656) | 14.247 ( 0.836) | 1.17 (0.09) | 1 | 8.91 (0.02) |
| NGC3674 | 3.70 | 3.73 | 1905.0 | 2205.0 | 0.125 ( 0.298) | 0.272 ( 0.258) | 1 | 7.78 | |
| NGC3694 | 3.63 | 5.17 | 2093.0 | 2393.0 | 0.340 ( 0.360) | 0.488 ( 0.435) | 1 | 7.91 | |
| NGC3757 | 3.88 | 3.02 | 1095.0 | 1395.0 | -0.177 ( 0.326) | -0.686 ( 0.248) | 1 | 7.48 | |
| NGC3796 | 2.49 | 3.16 | 1110.0 | 1410.0 | -0.150 ( 0.340) | -0.001 ( 0.270) | 1 | 7.51 | |
| NGC3838 | 4.32 | 3.45 | 1158.0 | 1458.0 | -0.547 ( 0.338) | -0.016 ( 0.272) | 1 | 7.53 | |
| NGC3941 | 3.17 | 3.55 | 780.0 | 1080.0 | 0.090 ( 0.300) | -0.010 ( 0.272) | 1 | 6.89 | |
| NGC3945 | 4.07 | 2.98 | 1131.0 | 1431.0 | -0.122 ( 0.320) | 0.046 ( 0.241) | 1 | 7.50 | |
| NGC3998 | 3.62 | 3.57 | 898.0 | 1198.0 | 0.053 ( 0.338) | -0.033 ( 0.270) | 1 | 7.06 | |
| NGC4026 | 3.03 | 2.82 | 835.0 | 1135.0 | -0.169 ( 0.310) | 0.015 ( 0.208) | 1 | 6.99 | |
| NGC4036 | 2.79 | 2.29 | 1169.0 | 1670.0 | 0.372 ( 0.492) | 3.676 ( 0.323) | 2.49 | 1 | 8.13 (0.04) |
| NGC4078 | 4.51 | 7.41 | 2396.0 | 2696.0 | -0.088 ( 0.360) | -1.343 ( 0.573) | 1 | 7.98 | |
| NGC4111 | 3 | 7.22 (0.09) | |||||||
| NGC4119 | 4.22 | 7.34 | 1543.0 | 1767.0 | 4.537 ( 0.320) | 5.787 ( 0.435) | 1.28 (0.13) | 1 | 7.88 (0.03) |
| NGC4143 | 3 | 7.20 | |||||||
| NGC4150 | 2 | 7.82 (0.03) | |||||||
| NGC4168 | 3.61 | 6.51 | 2136.0 | 2436.0 | 0.217 ( 0.314) | -0.219 ( 0.514) | 1 | 7.74 | |
| NGC4179 | 3.95 | 5.57 | 1150.0 | 1450.0 | 0.519 ( 0.383) | 0.534 ( 0.388) | 1 | 7.28 | |
| NGC4191 | 3.40 | 4.11 | 2496.0 | 2796.0 | 0.493 ( 0.310) | -0.005 ( 0.263) | 1 | 7.94 | |
| NGC4203 | 3 | 7.39 (0.05) | |||||||
| NGC4215 | 3.85 | 4.36 | 1861.0 | 2161.0 | -0.007 ( 0.370) | -0.451 ( 0.385) | 1 | 7.83 | |
| NGC4233 | 4.16 | 9.28 | 2156.0 | 2456.0 | 0.109 ( 0.367) | 0.417 ( 0.734) | 1 | 7.89 | |
| NGC4249 | 3.84 | 3.47 | 2468.0 | 2768.0 | 0.264 ( 0.340) | 0.168 ( 0.281) | 1 | 7.97 | |
| NGC4251 | 3 | 7.11 | |||||||
| NGC4255 | 3.63 | 3.57 | 1845.0 | 2145.0 | 0.220 ( 0.340) | 0.250 ( 0.252) | 1 | 7.78 | |
| NGC4259 | 4.11 | 7.04 | 2347.0 | 2647.0 | 0.523 ( 0.368) | 0.996 ( 0.589) | 1 | 7.97 | |
| NGC4261 | 2 | 7.68 | |||||||
| NGC4262 | 2 | 7.07 | |||||||
| NGC4264 | 3.54 | 3.42 | 2368.0 | 2668.0 | 0.194 ( 0.342) | -0.024 ( 0.272) | 1 | 7.94 | |
| NGC4267 | 4.18 | 4.80 | 871.0 | 1171.0 | 0.198 ( 0.314) | -0.450 ( 0.432) | 1 | 7.16 | |
| NGC4268 | 3.72 | 4.31 | 1884.0 | 2184.0 | 0.140 ( 0.372) | -0.223 ( 0.347) | 1 | 7.83 | |
| NGC4270 | 2 | 7.79 | |||||||
| NGC4278 | 7 | 7.45 | |||||||
| NGC4281 | 3.12 | 3.78 | 2302.0 | 3073.0 | 1.286 ( 0.693) | 1.572 ( 0.602) | 1 | 7.88 | |
| NGC4283 | 4 | 7.10 (0.09) | |||||||
| NGC4324 | 3.57 | 3.71 | 1536.0 | 1852.0 | 2.955 ( 0.334) | 1.977 ( 0.290) | 0.67 (0.12) | 1 | 7.69 (0.05) |
| NGC4339 | 3.70 | 3.82 | 1116.0 | 1416.0 | 0.238 ( 0.305) | -0.632 ( 0.286) | 1 | 7.15 | |
| NGC4340 | 4.17 | 4.74 | 783.0 | 1083.0 | -0.004 ( 0.349) | -0.466 ( 0.371) | 1 | 7.33 | |
| NGC4342 | 3.93 | 3.67 | 611.0 | 911.0 | 0.121 ( 0.346) | 0.326 ( 0.297) | 1 | 7.24 | |
| NGC4346 | 3.79 | 4.11 | 682.0 | 982.0 | 0.037 ( 0.374) | -0.534 ( 0.308) | 1 | 7.12 | |
| NGC4350 | 3.77 | 3.85 | 1060.0 | 1360.0 | 0.350 ( 0.352) | 0.501 ( 0.349) | 1 | 7.18 | |
| NGC4365 | 2 | 7.62 | |||||||
| NGC4371 | 3.58 | 6.85 | 783.0 | 1083.0 | -0.396 ( 0.370) | -0.711 ( 0.634) | 1 | 7.29 | |
| NGC4374 | 2 | 7.23 | |||||||
| NGC4377 | 3.95 | 3.78 | 1193.0 | 1493.0 | 0.424 ( 0.315) | -0.458 ( 0.276) | 1 | 7.26 | |
| NGC4379 | 3.64 | 6.74 | 924.0 | 1224.0 | -0.455 ( 0.338) | 0.071 ( 0.503) | 1 | 7.19 | |
| NGC4382 | 2 | 7.39 | |||||||
| NGC4387 | 2 | 7.39 | |||||||
| NGC4406 | 5 | 7.40 | |||||||
| NGC4417 | 3.14 | 3.45 | 678.0 | 978.0 | -0.357 ( 0.359) | -0.681 ( 0.306) | 1 | 7.22 | |
| NGC4425 | 2.87 | 3.16 | 1758.0 | 2058.0 | 0.027 ( 0.318) | 0.562 ( 0.294) | 1 | 7.20 | |
| NGC4429 | 3.03 | 5.14 | 808.0 | 1405.0 | 6.769 ( 0.497) | 7.334 ( 0.747) | 1.08 (0.14) | 1 | 8.05 (0.03) |
| NGC4434 | 3.77 | 5.20 | 920.0 | 1220.0 | -0.119 ( 0.431) | -0.045 ( 0.526) | 1 | 7.60 | |
| NGC4435 | 2.47 | 5.36 | 569.0 | 1022.0 | 4.361 ( 0.389) | 5.667 ( 0.686) | 1.30 (0.20) | 1 | 7.87 (0.04) |
| NGC4442 | 3.84 | 7.72 | 397.0 | 697.0 | 0.297 ( 0.311) | 0.678 ( 0.574) | 1 | 7.12 | |
| NGC4452 | 3.94 | 3.45 | 38.0 | 338.0 | 0.020 ( 0.346) | 0.364 ( 0.262) | 1 | 7.19 | |
| NGC4458 | 2 | 7.31 | |||||||
| NGC4459 | 2 | 8.24 (0.02) | |||||||
| NGC4461 | 3.72 | 4.74 | 1774.0 | 2074.0 | -0.256 ( 0.319) | 0.333 ( 0.399) | 1 | 7.20 | |
| NGC4472 | 4.12 | 5.03 | 831.0 | 1131.0 | -0.472 ( 0.330) | 0.050 ( 0.417) | 1 | 7.25 | |
| NGC4473 | 2 | 7.07 | |||||||
| NGC4474 | 3.47 | 7.41 | 1461.0 | 1761.0 | 0.359 ( 0.329) | 0.365 ( 0.482) | 1 | 7.16 | |
| NGC4476 | 6 | 8.05 (0.04) | |||||||
| NGC4477 | 2 | 7.54 (0.06) | |||||||
| NGC4478 | 2.91 | 4.31 | 1225.0 | 1525.0 | -0.379 ( 0.363) | -0.109 ( 0.377) | 1 | 7.28 | |
| NGC4483 | 3.82 | 3.17 | 756.0 | 1056.0 | 0.644 ( 0.314) | -0.153 ( 0.226) | 1 | 7.20 | |
| NGC4486 | 2 | 7.17 | |||||||
| NGC4486A | 0 | 0.00 | |||||||
| NGC4489 | 4.03 | 5.25 | 811.0 | 1111.0 | 0.215 ( 0.324) | 0.708 ( 0.431) | 1 | 7.15 | |
| NGC4494 | 3.51 | 4.81 | 1192.0 | 1492.0 | -0.133 ( 0.349) | -0.937 ( 0.368) | 1 | 7.25 | |
| NGC4503 | 4.00 | 3.40 | 1184.0 | 1484.0 | -0.083 ( 0.333) | 0.092 ( 0.257) | 1 | 7.22 | |
| NGC4521 | 3.79 | 4.44 | 2361.0 | 2661.0 | -0.030 ( 0.321) | -0.081 ( 0.342) | 1 | 7.97 | |
| NGC4526 | 2 | 8.59 (0.01) | |||||||
| NGC4528 | 3.27 | 4.04 | 1228.0 | 1528.0 | -0.236 ( 0.311) | 0.420 ( 0.292) | 1 | 7.15 | |
| NGC4546 | 2 | 6.97 | |||||||
| NGC4550 | 4.22 | 5.16 | 309.0 | 609.0 | 0.234 ( 0.396) | 0.667 ( 0.571) | 1 | 7.24 | |
| NGC4551 | 3.66 | 6.17 | 1026.0 | 1326.0 | 0.100 ( 0.371) | -0.289 ( 0.495) | 1 | 7.24 | |
| NGC4552 | 2 | 7.28 | |||||||
| NGC4564 | 4.00 | 6.58 | 1005.0 | 1305.0 | -0.020 ( 0.387) | 0.468 ( 0.497) | 1 | 7.25 | |
| NGC4570 | 2 | 7.47 | |||||||
| NGC4578 | 3.27 | 6.63 | 2142.0 | 2442.0 | 0.384 ( 0.323) | -0.202 ( 0.558) | 1 | 7.20 | |
| NGC4596 | 3.36 | 4.78 | 1715.0 | 2057.0 | 1.246 ( 0.294) | 1.667 ( 0.390) | 1.34 (0.44) | 1 | 7.31 (0.09) |
| NGC4608 | 3.38 | 4.37 | 1700.0 | 2000.0 | 0.039 ( 0.401) | -0.078 ( 0.359) | 1 | 7.30 | |
| NGC4612 | 3.13 | 4.19 | 1625.0 | 1925.0 | -0.441 ( 0.313) | -0.098 ( 0.331) | 1 | 7.20 | |
| NGC4621 | 3.94 | 2.38 | 317.0 | 617.0 | 0.289 ( 0.336) | -0.141 ( 0.200) | 1 | 7.13 | |
| NGC4623 | 2.95 | 4.16 | 1657.0 | 1957.0 | -0.394 ( 0.294) | -0.230 ( 0.289) | 1 | 7.21 | |
| NGC4624 | 3.46 | 7.32 | 762.0 | 1062.0 | 0.242 ( 0.400) | 0.092 ( 0.653) | 1 | 7.30 | |
| NGC4636 | 4 | 6.87 | |||||||
| NGC4638 | 3.73 | 5.29 | 1002.0 | 1302.0 | -0.352 ( 0.357) | 0.384 ( 0.334) | 1 | 7.30 | |
| NGC4643 | 3.76 | 3.29 | 1220.0 | 1673.0 | 0.317 ( 0.481) | 1.111 ( 0.356) | 0.77 | 1 | 7.27 (0.12) |
| NGC4649 | 8.94 | 8.87 | 960.0 | 1260.0 | 0.249 ( 0.508) | 0.214 ( 0.711) | 1 | 7.44 | |
| NGC4660 | 3.73 | 6.11 | 937.0 | 1237.0 | 0.131 ( 0.381) | -0.050 ( 0.522) | 1 | 7.19 | |
| NGC4684 | 3.86 | 5.34 | 1420.0 | 1844.0 | 1.544 ( 0.439) | 6.188 ( 0.638) | 4.01 (1.21) | 1 | 7.21 (0.11) |
| NGC4690 | 3.45 | 4.06 | 2615.0 | 2915.0 | -0.724 ( 0.350) | -0.186 ( 0.327) | 1 | 8.01 | |
| NGC4694 | 6.02 | 4.80 | 1083.0 | 1264.0 | 6.182 ( 0.372) | 6.566 ( 0.301) | 1.06 (0.08) | 1 | 8.01 (0.03) |
| NGC4697 | 3.86 | 3.84 | 1102.0 | 1402.0 | 0.466 ( 0.305) | -0.414 ( 0.269) | 1 | 6.86 | |
| NGC4710 | 8.40 | 6.89 | 896.0 | 1368.0 | 31.696 ( 0.923) | 40.130 ( 0.766) | 1.27 (0.04) | 1 | 8.72 (0.01) |
| NGC4733 | 4.66 | 3.96 | 775.0 | 1075.0 | -0.001 ( 0.499) | 0.580 ( 0.308) | 1 | 7.28 | |
| NGC4753 | 4.51 | 3.75 | 863.0 | 1513.0 | 11.169 ( 0.679) | 14.203 ( 0.576) | 1.27 (0.09) | 1 | 8.55 (0.03) |
| NGC4754 | 3.39 | 3.64 | 1201.0 | 1501.0 | -0.595 ( 0.319) | -0.177 ( 0.273) | 1 | 7.18 | |
| NGC4762 | 4.14 | 7.64 | 836.0 | 1136.0 | 0.087 ( 0.321) | 0.171 ( 0.517) | 1 | 7.48 | |
| NGC4803 | 3.80 | 3.71 | 2495.0 | 2795.0 | -0.467 ( 0.337) | 0.018 ( 0.294) | 1 | 7.98 | |
| NGC5103 | 4.13 | 3.44 | 1123.0 | 1423.0 | -0.043 ( 0.383) | -0.222 ( 0.285) | 1 | 7.58 | |
| NGC5173 | 3.32 | 2.51 | 2276.0 | 2568.0 | 2.134 ( 0.288) | 3.109 ( 0.228) | 1.46 (0.22) | 1 | 8.28 (0.06) |
| NGC5198 | 2 | 7.89 | |||||||
| NGC5273 | 2.90 | 2.87 | 961.0 | 1214.0 | 1.303 ( 0.226) | 3.309 ( 0.203) | 2.54 (0.47) | 1 | 7.31 (0.07) |
| NGC5308 | 2 | 7.88 | |||||||
| NGC5322 | 3.26 | 4.92 | 1630.0 | 1930.0 | 0.054 ( 0.341) | -0.083 ( 0.379) | 1 | 7.76 | |
| NGC5342 | 2.57 | 3.48 | 2039.0 | 2339.0 | -0.131 ( 0.265) | -0.567 ( 0.262) | 1 | 7.79 | |
| NGC5353 | 3.37 | 5.23 | 1910.0 | 2633.0 | 1.358 ( 0.581) | 2.409 ( 0.891) | 1 | 8.12 | |
| NGC5355 | 3.95 | 7.37 | 2194.0 | 2494.0 | 0.854 ( 0.343) | 1.017 ( 0.587) | 1 | 7.94 | |
| NGC5358 | 3.47 | 4.84 | 2262.0 | 2562.0 | -0.308 ( 0.317) | -0.052 ( 0.365) | 1 | 7.92 | |
| NGC5379 | 4.82 | 7.80 | 1683.0 | 1911.0 | 3.914 ( 0.345) | 3.075 ( 0.610) | 0.79 (0.17) | 1 | 8.33 (0.04) |
| NGC5422 | 4.10 | 7.52 | 1688.0 | 1988.0 | -0.326 ( 0.349) | -0.162 ( 0.628) | 1 | 7.78 | |
| NGC5473 | 3.27 | 5.99 | 1872.0 | 2172.0 | 0.062 ( 0.349) | 0.591 ( 0.477) | 1 | 7.85 | |
| NGC5475 | 3.80 | 4.35 | 1521.0 | 1821.0 | 0.437 ( 0.353) | 0.237 ( 0.384) | 1 | 7.72 | |
| NGC5481 | 3.02 | 5.44 | 1839.0 | 2139.0 | 0.133 ( 0.325) | 0.485 ( 0.451) | 1 | 7.60 | |
| NGC5485 | 3.07 | 3.99 | 1777.0 | 2077.0 | 0.121 ( 0.342) | 0.300 ( 0.318) | 1 | 7.60 | |
| NGC5493 | 3.62 | 4.33 | 2515.0 | 2815.0 | -0.436 ( 0.347) | 0.669 ( 0.369) | 1 | 7.98 | |
| NGC5500 | 3.67 | 4.82 | 1764.0 | 2064.0 | -0.696 ( 0.363) | -0.019 ( 0.428) | 1 | 7.82 | |
| NGC5507 | 4.23 | 2.50 | 1701.0 | 2001.0 | -0.129 ( 0.334) | 0.335 ( 0.247) | 1 | 7.70 | |
| NGC5557 | 3.42 | 2.54 | 3069.0 | 3369.0 | -0.566 ( 0.300) | -0.078 ( 0.238) | 1 | 7.92 | |
| NGC5574 | 3.79 | 4.06 | 1439.0 | 1739.0 | 0.016 ( 0.327) | -0.392 ( 0.288) | 1 | 7.51 | |
| NGC5576 | 3.06 | 3.57 | 1356.0 | 1656.0 | 0.081 ( 0.354) | -0.168 ( 0.272) | 1 | 7.60 | |
| NGC5582 | 3.99 | 3.75 | 1280.0 | 1580.0 | 0.499 ( 0.336) | -0.052 ( 0.274) | 1 | 7.67 | |
| NGC5611 | 3.78 | 4.72 | 1818.0 | 2118.0 | 0.675 ( 0.338) | -0.141 ( 0.353) | 1 | 7.57 | |
| NGC5631 | 3.13 | 4.51 | 1794.0 | 2094.0 | 0.166 ( 0.357) | 0.744 ( 0.341) | 1 | 7.68 | |
| NGC5638 | 3.08 | 3.27 | 1502.0 | 1802.0 | -0.019 ( 0.331) | 0.026 ( 0.251) | 1 | 7.60 | |
| NGC5687 | 3.71 | 2.96 | 1993.0 | 2293.0 | 0.454 ( 0.323) | 0.419 ( 0.261) | 1 | 7.64 | |
| NGC5770 | 3.73 | 3.80 | 1321.0 | 1621.0 | -0.250 ( 0.347) | -0.250 ( 0.305) | 1 | 7.34 | |
| NGC5813 | 2 | 7.69 | |||||||
| NGC5831 | 2 | 7.85 | |||||||
| NGC5838 | 2 | 7.56 | |||||||
| NGC5839 | 3.94 | 2.92 | 1070.0 | 1370.0 | 0.382 ( 0.269) | 0.246 ( 0.217) | 1 | 7.38 | |
| NGC5845 | 2 | 7.50 | |||||||
| NGC5846 | 2 | 7.78 | |||||||
| NGC5854 | 3.53 | 2.67 | 1513.0 | 1813.0 | 0.020 ( 0.314) | 0.114 ( 0.225) | 1 | 7.60 | |
| NGC5864 | 3.71 | 5.07 | 1724.0 | 2024.0 | 0.070 ( 0.354) | -0.468 ( 0.359) | 1 | 7.74 | |
| NGC5866 | 3 | 8.47 (0.01) | |||||||
| NGC5869 | 3.67 | 4.25 | 1915.0 | 2215.0 | -0.357 ( 0.376) | 0.066 ( 0.317) | 1 | 7.63 | |
| NGC6010 | 3.69 | 3.76 | 1872.0 | 2172.0 | -0.082 ( 0.352) | -0.061 ( 0.272) | 1 | 7.78 | |
| NGC6014 | 5.28 | 5.07 | 2266.0 | 2570.0 | 7.482 ( 0.430) | 10.732 ( 0.413) | 1.43 (0.10) | 1 | 8.77 (0.02) |
| NGC6017 | 4.00 | 3.66 | 1638.0 | 1938.0 | 0.885 ( 0.347) | 0.613 ( 0.283) | 1 | 7.73 | |
| NGC6149 | 3.80 | 4.22 | 2277.0 | 2577.0 | 0.614 ( 0.312) | -0.082 ( 0.354) | 1 | 7.90 | |
| NGC6278 | 3.34 | 3.26 | 2682.0 | 2982.0 | -0.233 ( 0.287) | 0.325 ( 0.335) | 1 | 7.98 | |
| NGC6547 | 3.45 | 5.21 | 2527.0 | 2827.0 | -0.400 ( 0.332) | 0.796 ( 0.418) | 1 | 8.00 | |
| NGC6548 | 2 | 7.58 | |||||||
| NGC6703 | 3.70 | 7.12 | 2223.0 | 2523.0 | -0.384 ( 0.344) | -0.158 ( 0.563) | 1 | 7.62 | |
| NGC6798 | 2.61 | 2.79 | 2210.0 | 2510.0 | 0.795 ( 0.205) | 0.601 ( 0.204) | 0.77 | 1 | 7.83 (0.10) |
| NGC7280 | 2.91 | 3.55 | 1695.0 | 1995.0 | 0.401 ( 0.298) | 0.427 ( 0.273) | 1 | 7.49 | |
| NGC7332 | 2.93 | 3.44 | 1047.0 | 1347.0 | 0.350 ( 0.283) | 0.445 ( 0.259) | 1 | 7.41 | |
| NGC7454 | 3.31 | 3.46 | 1870.0 | 2170.0 | -0.037 ( 0.250) | 0.247 ( 0.271) | 1 | 7.39 | |
| NGC7457 | 3.00 | 3.71 | 694.0 | 994.0 | -0.195 ( 0.299) | 0.199 ( 0.271) | 1 | 6.96 | |
| NGC7465 | 5.45 | 5.23 | 1827.0 | 2117.0 | 11.887 ( 0.446) | 21.320 ( 0.478) | 1.79 (0.08) | 1 | 8.79 (0.02) |
| NGC7693 | 3.48 | 4.04 | 2352.0 | 2652.0 | 0.515 ( 0.320) | 0.491 ( 0.311) | 1 | 7.86 | |
| NGC7710 | 3.59 | 4.73 | 2257.0 | 2557.0 | 0.070 ( 0.296) | -0.206 ( 0.351) | 1 | 7.80 | |
| PGC016060 | 3.28 | 4.14 | 2556.0 | 2947.0 | 2.105 ( 0.317) | 1.661 ( 0.363) | 0.79 (0.21) | 1 | 8.26 (0.06) |
| PGC028887 | 3.53 | 7.42 | 2683.0 | 2983.0 | 0.609 ( 0.346) | 1.463 ( 0.642) | 1 | 8.03 | |
| PGC029321 | 4.08 | 5.76 | 2747.0 | 2902.0 | 3.335 ( 0.284) | 4.762 ( 0.296) | 1.43 (0.15) | 1 | 8.53 (0.04) |
| PGC035754 | 3.55 | 5.17 | 2384.0 | 2684.0 | -0.285 ( 0.285) | -0.353 ( 0.358) | 1 | 7.90 | |
| PGC042549 | 3.76 | 3.89 | 2672.0 | 2972.0 | 0.203 ( 0.388) | 0.341 ( 0.295) | 1 | 8.07 | |
| PGC044433 | 3.53 | 4.52 | 2525.0 | 2825.0 | 0.230 ( 0.328) | 0.165 ( 0.329) | 1 | 7.98 | |
| PGC050395 | 3.21 | 3.44 | 2172.0 | 2472.0 | 0.188 ( 0.294) | 0.042 ( 0.274) | 1 | 7.87 | |
| PGC051753 | 2.79 | 4.12 | 2268.0 | 2568.0 | 0.253 ( 0.308) | 0.369 ( 0.314) | 1 | 7.92 | |
| PGC054452 | 3.60 | 4.66 | 1768.0 | 2068.0 | -0.410 ( 0.335) | 0.088 ( 0.368) | 1 | 7.73 | |
| PGC056772 | 2.13 | 2.69 | 2508.0 | 2821.0 | 1.620 ( 0.201) | 2.049 ( 0.203) | 1.26 (0.20) | 1 | 8.19 (0.05) |
| PGC058114 | 4.52 | 3.60 | 1383.0 | 1768.0 | 11.425 ( 0.450) | 21.487 ( 0.315) | 1.88 (0.08) | 1 | 8.60 (0.02) |
| PGC061468 | 2.83 | 3.31 | 2282.0 | 2496.0 | 1.260 ( 0.211) | 0.949 ( 0.214) | 0.75 (0.21) | 1 | 8.00 (0.07) |
| PGC071531 | 2.39 | 2.63 | 1880.0 | 2180.0 | 0.333 ( 0.262) | -0.116 ( 0.206) | 1 | 7.65 | |
| PGC170172 | 3.97 | 4.53 | 2412.0 | 2712.0 | -0.066 ( 0.373) | 0.240 ( 0.376) | 1 | 7.97 | |
| UGC03960 | 2.69 | 6.08 | 2105.0 | 2405.0 | -0.310 ( 0.318) | 0.031 ( 0.481) | 1 | 7.81 | |
| UGC04551 | 3.26 | 5.28 | 1578.0 | 1878.0 | -0.060 ( 0.292) | -0.317 ( 0.501) | 1 | 7.62 | |
| UGC05408 | 2.96 | 3.39 | 2868.0 | 3123.0 | 1.633 ( 0.259) | 3.409 ( 0.241) | 2.09 (0.36) | 1 | 8.32 (0.06) |
| UGC06062 | 4.02 | 4.72 | 2484.0 | 2784.0 | -0.038 ( 0.314) | -0.486 ( 0.366) | 1 | 7.93 | |
| UGC06176 | 3.71 | 4.79 | 2540.0 | 2870.0 | 3.918 ( 0.380) | 8.503 ( 0.455) | 2.17 (0.24) | 1 | 8.58 (0.04) |
| UGC08876 | 3.02 | 4.12 | 1935.0 | 2235.0 | 0.450 ( 0.299) | 0.059 ( 0.306) | 1 | 7.80 | |
| UGC09519 | 4.73 | 4.01 | 1501.0 | 1818.0 | 12.662 ( 0.436) | 13.857 ( 0.327) | 1.09 (0.05) | 1 | 8.77 (0.01) |
| Observed, but not members of ATLAS3D | |||||||||
| IC2099 | 2.92 | 4.71 | 2649.0 | 2944.0 | 0.813 ( 0.266) | 1.861 ( 0.354) | 2.29 (0.87) | 1 | 7.82 (0.12) |
| IC3102 | 3.67 | 8.13 | 2085.0 | 2385.0 | 0.256 ( 0.338) | 1.736 ( 0.613) | 1 | 7.23 | |
| NGC2697 | 4.20 | 10.85 | 1670.0 | 1979.0 | 4.365 ( 0.461) | 5.144 ( 0.965) | 1.18 (0.25) | 1 | 8.25 (0.04) |
| NGC4292 | 3.50 | 7.21 | 2151.0 | 2397.0 | 2.923 ( 0.315) | 2.607 ( 0.512) | 0.89 (0.20) | 1 | 7.66 (0.04) |
| NGC4309 | 4.79 | 8.25 | 951.0 | 1173.0 | 6.828 ( 0.390) | 7.342 ( 0.564) | 1.08 (0.10) | 1 | 8.05 (0.02) |
| NGC4352 | 2.93 | 4.83 | 1932.0 | 2232.0 | 0.048 ( 0.330) | -0.416 ( 0.397) | 1 | 7.03 | |
| NGC4479 | 3.92 | 5.35 | 726.0 | 1026.0 | -0.453 ( 0.438) | -0.656 ( 0.391) | 1 | 7.33 | |
| NGC4620 | 4.45 | 7.92 | 994.0 | 1294.0 | -0.277 ( 0.420) | -0.680 ( 0.706) | 1 | 7.52 | |
| NGC7743 | 5.72 | 4.80 | 1561.0 | 1805.0 | 5.673 ( 0.381) | 10.746 ( 0.339) | 1.89 (0.14) | 1 | 8.14 (0.03) |
| PGC2800919 | 3.02 | 4.03 | 2773.0 | 3086.0 | 1.230 ( 0.316) | 2.495 ( 0.282) | 2.03 (0.57) | 1 | 8.10 (0.10) |
| UGC01756 | 4.09 | 6.02 | 2862.0 | 3162.0 | 0.860 ( 0.331) | -0.536 ( 0.507) | 1 | 8.00 | |
| UGC05467 | 4.13 | 6.40 | 2815.0 | 2986.0 | 4.055 ( 0.290) | 3.399 ( 0.385) | 0.84 (0.11) | 1 | 8.61 (0.03) |
Note. — Intensities are quoted as main beam brightness temperatures . The rms noise values are for channels binned to 31 km s-1. The velocity range is either 300 km s-1 (for nondetections) or the actual range used in the sums (for detections). All quoted uncertainties are ; H2 mass upper limits are . Where the line ratio is a limit, it is computed using the upper limit on the undetected line. H2 masses assume the distances listed in Cappellari et al. (2011a). For galaxies taken from the literature, we give only the H2 mass corrected to our assumed distance and other quantities may be found in the original sources. Data sources: 1 = this paper, 2 = Combes et al. (2007), 3 = Welch & Sage (2003), 4 = Sage et al. (2007), 5 = Wiklind et al. (1995), 6 = Young (2002), 7 = Welch, Sage, & Young (2010). The table is available in its entirety from the project website http://purl.com/atlas3d.
Note. — Columns: (1) Source name; (2)–(3) line area in CO(1-0) and CO(2-1); (4)–(5) central velocity in CO(1-0) and CO(2-1); (6)–(7) FWHM in CO(1-0) and CO(2-1); (8)–(9) peak brightness temperature in CO(1-0) and CO(2-1). Formal 1 uncertainties in each quantity are quoted in parentheses. Comment ‘a’ in column (10) indicates the line profile is notably asymmetric, and ‘a*’ indicates the line is sufficiently asymmetric that the peak brightness temperature (and area, systemic velocity and width, for NGC 3665 in 2-1) has been measured directly off the profile rather than with a fit. Comment ‘2h’ indicates a double-horned line profile. Notes on specific galaxies: NGC 1266 - the 1-0 line is, formally speaking, adequately fit with one Gaussian component but the 2-1 line has broad, low-level wings which require two Gaussian components of the same center and different widths. NGC 6014 - the line profile is neither a double horn nor a Gaussian, but the central dip suggests a ringlike CO distribution. NGC 4281, 5638 and 7454 - the spectrum shows hints of two peaks. The peaks were fitted independently and both velocities are listed. Formally the Gaussian fit detects each of these with an integrated area greater than 3, but as there is no emission within 300 km s-1 of the optical velocity it is a nondetection in Table The ATLAS3D project – IV: the molecular gas content of early-type galaxies††thanks: Based on observations carried out with the IRAM 30m Telescope. IRAM is supported by INSU/CNRS (France), MPG (Germany) and IGN (Spain). and it is NOT counted as a detection the rest of the analysis. NGC 4643 is formally detected via the integrated intensity in the central 300 km s-1 of the 2-1 spectrum and its line is also suggestive of two peaks. As for NGC 4281, the two velocities listed are those of the two peaks (rather than the systemic velocity that one would infer from assuming those are two horns).