A Compton-thick AGN at in the 4 Ms Deep Field South
Abstract
We report the discovery of a Compton-thick Active Galactic Nucleus (AGN) at in the 4 Ms Deep Field South. This object was selected as a -band dropout in HST/ACS images and previously recognized as an AGN from optical spectroscopy. The 4 Ms observations show a significant () X-ray detection at the -band dropout position. The X-ray source displays a hardness ratio of HR=, which, for a source at , is highly suggestive of Compton-thick absorption. The source X-ray spectrum is seen above the background level in the energy range of keV, i.e., in the rest-frame energy range of keV. When fixing the photon index to , the measured column density is cm-2, which is Compton-thick. To our knowledge, this is the most distant heavily obscured AGN, confirmed by X-ray spectral analysis, discovered so far. The intrinsic (de-absorbed), rest-frame luminosity in the 2-10 keV band is erg s-1, which places this object among type-2 quasars. The Spectral Energy Distribution shows that massive star formation is associated with obscured black hole accretion. This system may have then been caught during a major co-eval episode of black hole and stellar mass assembly at early times. The measure of the number density of heavily obscured AGN at high redshifts will be crucial to reconstruct the BH/galaxy evolution history from the beginning.
Subject headings:
galaxies: active — galaxies: high-redshift — X-rays: galaxies1. Introduction
While optically bright quasars are the most spectacular expression of accretion onto supermassive black holes (SMBHs) at galaxy centers, it is widely believed that SMBHs grow most of their mass during obscured phases, in which the detection of the nuclear power becomes challenging (e.g., Fabian, 1999). Large amounts of gas and dust are found to hide the majority of Active Galactic Nuclei (AGN) in the nearby and distant Universe, as demonstrated by deep and wide X-ray surveys over different sky fields (see e.g., Brandt & Hasinger 2005 for a review). From 30 to 50% of all AGN are believed to be obscured by extreme gas column densities above cm-2. These objects are dubbed “Compton-thick” and represent the most elusive members of the AGN population. The evidence for an abundant population of local Compton-thick objects is compelling: up to of nearby Seyfert 2s contain a Compton-thick nucleus (Risaliti et al., 1999; Akylas & Georgantopoulos, 2009); about 50 objects - mostly local - have been certified as “bona-fide” Compton-thick AGN by X-ray spectral analysis (Comastri, 2004).
Synthesis models of the X-ray background (XRB) suggest that Compton-thick AGN must be abundant at least up to to explain the peak of the XRB at 30 keV (see e.g., Gilli et al., 2007; Treister et al., 2009, and references therein). A population of distant, Compton-thick AGN, as abundant as that predicted by XRB synthesis models, is also required to match the SMBH mass function measured in nearby galaxies with that of “relic” SMBHs grown by accretion (e.g., Marconi et al., 2004). In recent years it has been proposed that Compton-thick AGN represent a key phase of the BH/galaxy coevolution, during which the BH is producing most of its feedback into the host galaxy (e.g., Daddi et al., 2007; Menci et al., 2008), and it has also been suggested that their number density steeply increases with redshift (Treister et al., 2009).
The observation of heavily obscured AGN at high-, , remains challenging and it is very difficult to estimate their abundance since they produce only a small fraction of the XRB emission and are thus poorly constrained by synthesis models. Deep X-ray surveys have proven effective in revealing a few “bona fide” Compton-thick AGN at high-z. For instance, four such objects at have been discovered in the - Deep field South (CDFS; see Norman et al., 2002; Comastri et al., 2011; Feruglio et al., 2011). Other examples of candidate Compton-thick AGN at high-z have been reported (e.g., Tozzi et al., 2006; Polletta et al., 2008), even up to z=5.8 (Brandt et al., 2001), albeit with poorer X-ray photon statistics. Selection techniques based on the strength of the mid-IR emission with respect to the optical and X-ray emission have also been developed and applied to select large populations of candidate Compton-thick AGN up to (Daddi et al., 2007; Alexander et al., 2008a; Fiore et al., 2009; Bauer et al., 2010). Once more, however, the lack of X-ray spectra prevents an unambiguous determination of the absorbing column density, making the measurements by these works largely uncertain.
In this paper we report the discovery of a “bona-fide” Compton-thick AGN at =4.76 in the 4 Ms CDFS. A concordance cosmology with km s-1 Mpc-1, , is adopted throughout this paper.
2. Source selection and Observations
We searched for band dropout objects in the HST/ACS v2.0 data of GOODS-South (Giavalisco et al., 2004) associated with X-ray emission in the 4 Ms image. We used the -dropout selection criteria from Oesch et al. (2007), which effectively pick sources at 111An object is defined as a -dropout if , 2], , , and .. Details on the production of the -dropout catalog are given in Su et al. (2011). Additionally, we required a stellarity parameter (CLASS_STAR) greater than 0.9 in the band to choose point-like sources. This led to 21 star-like -dropouts with , among which there are four z5 galaxies, eleven stars, three lower-redshift galaxies, and one z5 AGN, which is the only object detected in X-rays (XID403 in the 4 Ms CDFS catalog of Xue et al. 2011). The remaining two candidates have not been identified spectroscopically. The measured AB magnitudes of XID403 in ACS images are: . The 5 detection limit in the -band is 28.4 AB mag.
XID403 (=03:32:29.29, =-27:56:19.5) was recognized as an AGN at based on FORS-2 spectroscopy (Vanzella et al., 2006). Its optical spectrum exhibits a narrow (FWHM km s-1) Ly emission line and a broader (FWHM km s-1) NV1240 emission line, with an integrated flux similar to Ly. A more recent spectrum with DEIMOS/Keck confirms both features (Coppin et al., 2009). The Spectral Energy Distribution of XID403 was published by Coppin et al. (2009). Based on a LABOCA detection at 870m, they showed that this source is a bright submillimeter galaxy with SFR1000 yr-1. A large reservoir of molecular gas () was also identified through CO(2-1) observations (Coppin et al., 2010).
We considered the same optical to mid-IR datasets used by Coppin et al. (2009) and improved on the SED by adding the detection at 1.1 mm by AzTec/ASTE (mJy; Scott et al. 2010) and the , and magnitudes from the deep NIR imaging by HAWK-I/VLT (, , ; Castellano et al. 2010). This object is also detected (at ) at 1.4 GHz with a peak flux of 22.3 Jy (N. Miller priv. comm). Unfortunately, it falls just outside the areas covered by the m Spitzer/IRS mosaic (Teplitz et al., 2011) and GOODS-Herschel (PI D. Elbaz). XID403 is not detected in the 3 Ms image of the CDFS.

3. X-ray data analysis
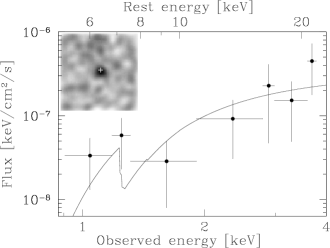
A total exposure of Ms has been accumulated on the CDFS as a result of 54 individual observations with ACIS-I performed during three different time periods: Ms in 2000, Ms in 2007 and Ms in 2010. X-ray data products, including event files for each observation and also for the merged dataset are publicly available222 http://cxc.harvard.edu/cda/Contrib/CDFS.html. In this paper we use the data products by Xue et al. (2011) who derived X-ray source catalogs from a full reprocessing and astrometric recalibration of the event files. We used CIAO v4.1 and the Funtools package333https://www.cfa.harvard.edu/j̃ohn/funtools to perform X-ray aperture photometry at the position of XID403. The separation between the optical and X-ray centroids is , which is well within the X-ray source positional uncertainty (0.47”). To maximize the S/N ratio, we measured the source counts in different bands within a small aperture of 3” radius, which encloses 50% of the PSF at 1.5 keV at the source location ( arcmin off-axis). We measured net counts in the 0.9-4 keV band, corresponding to a detection444XID403 has net counts in the 0.5-8 keV band (100% PSF) in Xue et al. (2011), in agreement with our estimate.. We verified that similar results are obtained when using different local background regions. The hardness ratio, defined as HR = (H-S)/(H+S), where S and H are the net counts observed in the 0.5-2 keV and 2-7 keV bands, respectively, is HR= (not corrected for vignetting). This value, for an AGN at with a standard intrinsic spectrum (i.e., ) is highly suggestive of heavy obscuration. For comparison, an AGN at with cm-2 is expected to have HR at the source position. We extracted the X-ray spectrum in the 0.5-7 keV band using the same 3” radius aperture and verified that below 0.9 keV and above 4 keV the source emission is indistinguishable from the background. The spectrum and response files were created using the psextract script in CIAO. Since psextract does not account for the PSF fraction when building up the effective area file, we multiplied the 0.5-2 keV and 2-10 keV fluxes as obtained from the spectral fit by a factor of 2 and 2.5, respectively, to recover the full aperture-corrected X-ray fluxes. We found consistent results either using spectral responses extracted from individual observations, or those obtained as an exposure-weighted mean over all individual responses. To double check the reliability of this procedure we also built spectral response files for one of the exposures (ObsID=8594) using the ACIS-Extract software (Broos et al., 2010) which allows proper construction of effective area files at any PSF fraction. Again, consistent results are found when using the ACIS-Extract responses. We analyzed the X-ray spectrum with XSPEC v11.3.2 using the Cash statistic (Cash, 1979) to estimate the best-fit parameters. Errors are quoted at confidence level. We first fitted the data using a powerlaw spectrum modified by galactic absorption, which returns . We then used the plcabs model (Yaqoob, 1997), which follows the propagation of X-ray photons within a uniform, spherical obscuring medium, accounting for both photoelectric absorption and Compton scattering. This model can be used in the case of heavy absorption (up to cm-2) and up to rest-frame energies of keV. When fixing the photon index to , we derived a Compton-thick column density of cm-2 (see Fig. 1). If we conservatively assume , which is off the average intrinsic AGN value, we still obtain cm-2. The measured absorption should be interpreted as a lower limit, since a cold reflection model (pexrav), corresponding to cm-2, provides an equally good fit. 555 When grouping to a minimum of 1 count per bin, the value of the C-statistic over the degrees of freedom is 54.7/59 and 55.2/60 for the plcabs and pexrav model, respectively. Fitting the data with the recent MYTorus model (Murphy & Yaqoob, 2009), which accounts for a toroidal distribution of the obscuring matter, again returns cm-2. No prominent iron K line is observed at 1.1 keV (i.e., 6.4 keV rest-frame), but this is not in conflict with the Compton-thick scenario. Indeed, the EW scales with , so that EW1-2 keV, as is typical of Compton-thick AGN, would translate into EW170-340 eV. We verified that such a weak line can be easily accomodated in the fit and that only loose upper limits can be derived for the equivalent width (EW keV at 90% c.l.). The aperture-corrected X-ray fluxes, as extrapolated from the X-ray fit, are erg cm-2 s-1 and erg cm-2 s-1. The intrinsic (de-absorbed), rest-frame 2-10 keV luminosity is erg s-1, which places XID403 at the low end of the X-ray luminosity range for type-2 quasars. Admittedly, the uncertainties in the geometry of the obscuring (and reprocessing) material might substantially affect the derivation of the intrinsic luminosity. However, we note that, if the spectrum were produced by pure reflection and a typical reflection efficiency of is assumed (Gilli et al., 2007), the intrinsic luminosity would be even higher.
XID403 was detected in the 1 Ms CDFS catalog by Giacconi et al. (2002, XID=618), with erg cm-2 s-1 and erg cm-2 s-1. The times larger soft X-ray flux is likely due to contamination from high background fluctuations over the larger (8” radius) extraction region adopted in that catalog. We checked the photometry of the 2000, 2007 and 2010 periods separately using a smaller 3” radius: no significant source variability is detected in any band. XID403 was below the detection thresholds of the 1 Ms CDFS catalog by Alexander et al. (2003) and 2Ms CDFS catalogs by Luo et al. (2008).
4. Discussion and Conclusions
4.1. SED fitting
We searched for additional indicators of heavy obscuration by considering data at other wavelengths. We first investigated the observed (i.e., not corrected for absorption), rest-frame 2-10 keV to luminosity diagnostic ratio (X/IR, e.g., Alexander et al. 2008a). We derived the X-ray luminosity from the spectral fit and used the rest-frame luminosity (derived from the Spitzer/MIPS datapoint at 24m) as a proxy for the luminosity. The X/IR ratio of would place XID403 in the region populated by Compton-thick AGN (Alexander et al., 2008a). When considering the vs color diagram elaborated by Fiore et al. (2009), XID403 would fall in “cell E” , where a significant fraction () of galaxies is found to host a heavily obscured, candidate Compton-thick AGN.
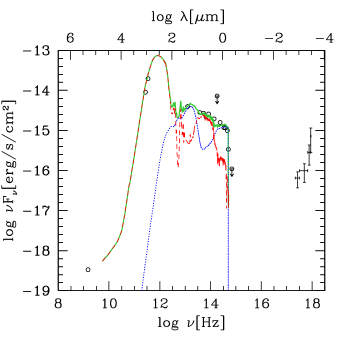
We then built the Spectral Energy Distribution (SED) from the X-rays to the radio regime (see Fig.2). As already shown by Coppin et al. (2009), the radio to FIR emission of this source is dominated by dusty star formation, at a rate of 1000 yr-1. We note that X-ray binaries associated to such a high SFR would produce erg s-1 (Ranalli et al. 2003; Lehmer et al. 2010), similar to the value. However, X-ray binaries have on average much softer spectra (, Remillard & McClintock 2006) than observed (). If absorption is invoked to explain such a spectral hardness, then intrinsic luminosities of erg s-1 are derived, which are incompatible with X-ray binary emission.
A reasonable match with the MIR to UV datapoints could be obtained with a reddened QSO template with (adopting the extinction curve of Gaskell & Benker 2007). When converting the measured optical extinction into an equivalent hydrogen column density by applying the relation valid for the Milky Way ISM (), we find cm-2, which is three dex smaller than what is estimated from the X-ray spectral fit. A mismatch between the X-ray and the optically estimated column density, in the range of , is observed in local AGN, calling for a number of interpretations (e.g., low dust-to-gas ratio; Maiolino et al., 2001). The mismatch observed in XID403 is 1000, which would make this object extreme.
In their SED analysis Coppin et al. (2009) suggest a different, stellar origin for the optical/UV rest frame emission. Following the parameterization used by Vignali et al. (2009) and Pozzi et al. (2010) for obscured AGN, we fitted the SED of XID403 with a stellar component, an AGN torus component, and a dusty starburst component. The dusty starburst is responsible for the bulk of the FIR to radio emission, while the AGN torus produces the entire emission at 24m (4m rest-frame). A galaxy template with , and a 1-Gyr-old constant star formation rate nicely fits the optical/UVrest data. However, a possible problem in interpreting the optical/UVrest emission as stellar light is that XID403 is pointlike in the deep HST/ACS images (CLASS_STAR=0.99 in and ), which would imply a half-light radius of kpc. Although very compact morphologies have been observed in a fraction of distant sub-mm galaxies (Ricciardelli et al., 2010), the pointlike nature of XID403, coupled to the presence of broad NV emission, might suggest that the optical/UVrest light has a nuclear origin. In particular, we could be looking at a fraction () of nuclear radiation that leaks out without being absorbed or is scattered towards us and thus would be polarized. If true, the effective extinction to the nucleus would be much higher than that estimated by fitting the whole MIR to UV emission with a reddened QSO template, being more in line with the large X-ray column density. This interpretation has been already proposed by Polletta et al. (2008) to explain the relatively blue optical/UV emission and broad line components of two sub-mm galaxies at hosting heavily obscured AGN, similar to XID403. Also, although the stellarity parameter is uncertain for the faint -band detection, the decrease of CLASS_STAR from 0.95 in to 0.74 in may also suggest that the host galaxy contributes significantly only at Å. In Fig.2 we show a possible SED decomposition for XID403 obtained by adding an AGN torus component and a scattering component (corresponding to of the AGN intrinsic UV emission666The intrinsic AGN UV emission is estimated by normalizing the QSO template of Elvis et al. (1994) to the Spitzer/MIPS datapoint.) to the SED of Arp220. In summary, the full SED analysis shows that XID403 is not a classic, type-2 QSO (i.e., a narrow-line, X-ray obscured AGN whose physical properties can be explained within the standard, geometry-based Unified Model; Norman et al. 2002), but points to a complex physical picture likely related to its active assembly phase.
4.2. Black hole and stellar mass growth
The IR emission from the AGN torus and the measured X-ray emission are used (see e.g., Vignali et al. 2009; Pozzi et al. 2010) to derive an AGN bolometric power of erg s-1. Assuming that the BH is radiating at the Eddington limit, as might be expected during these active BH and galaxy build-up phases, would imply . This in turn gives , which is a factor of 5 smaller than the local value. It would then seem that both BH and stellar mass are rapidly growing towards their final values, but the BH is lagging behind as seen in sub-mm galaxies at (Alexander et al., 2008b) and expected by recent semi-analytic models of BH/galaxy formation (Lamastra et al., 2010). However, since the estimated BH mass is a lower limit (accretion might be sub-Eddington) and the stellar mass derived in the previous section might be an upper limit (the AGN likely contributes to the optical/UVrest light), this ratio might well be equal to the local value.
4.3. Expectations for high-z Compton-thick AGN
While the space density of luminous, unobscured and moderately obscured QSOs declines exponentially at (e.g., Brusa et al., 2009; Civano et al., 2011), the behaviour of heavily obscured objects has still to be properly determined. Semi-analytic models of BH/galaxy evolution linking the obscuration on nuclear scales to the gas availability in the host galaxy (e.g., Menci et al., 2008), would predict an increasing abundance of obscured AGN towards high redshifts, and some observational evidence of this trend has been reported (Treister et al. 2009 and references therein).
We considered the number of Compton-thick AGN as expected from the synthesis model by Gilli et al. (2007). XID403 is detected with a 2-10 keV flux times larger than the detection limit at its position. The mean limiting flux over the 160 arcmin2 GOODS-S area is erg cm-2 s-1. Using the Gilli et al. (2007) model, one would expect from 0.06 to 0.6 Compton-thick AGN in the range of with erg cm-2 s-1 in GOODS-S, depending on whether their space density undergoes the same high-z decline as observed for less obscured QSOs or stays nearly constant. Clearly, any firm conclusion is prevented by the low statistics. However, the mere presence of a Compton-thick AGN at in such a small area (and this could be a lower limit since we did not investigate the whole X-ray source catalog) might suggest that the space density of Compton-thick AGN is not rapidly declining towards high redshifts. This shows that the detection of even a small number of heavily obscured AGN at in ultra-deep X-ray surveys would have a strong leverage on our understanding of early BH evolution.
X-ray spectral analysis is the only unambiguous way to determine whether an AGN is shrouded by Compton-thick matter. Observations at energies above 10 keV are an obvious way to identify Compton-thick AGN, but the current high-energy instrumentation and that foreseen in the near future (, ) will not allow sampling objects beyond . Below 10 keV, sensitive observations with limiting fluxes of erg cm-2 s-1 over wide sky areas, such as those from the proposed missions (White et al., 2010) and (Murray et al., 2010), would be required. The only concrete way to detect and unambiguously recognize high-z Compton-thick AGN in the near future is through even deeper observations with .
References
- Akylas & Georgantopoulos (2009) Akylas, A., & Georgantopoulos, I. 2009, A&A, 500, 999
- Alexander et al. (2003) Alexander, D. M., et al. 2003, AJ, 126, 539
- Alexander et al. (2008a) —. 2008a, ApJ, 687, 835
- Alexander et al. (2008b) —. 2008b, AJ, 135, 1968
- Bauer et al. (2010) Bauer, F. E., Yan, L., Sajina, A., & Alexander, D. M. 2010, ApJ, 710, 212
- Brandt et al. (2001) Brandt, W. N., Guainazzi, M., Kaspi, S., Fan, X., Schneider, D. P., Strauss, M. A., Clavel, J., & Gunn, J. E. 2001, AJ, 121, 591
- Brandt & Hasinger (2005) Brandt, W. N., & Hasinger, G. 2005, ARA&A, 43, 827
- Broos et al. (2010) Broos, P. S., Townsley, L. K., Feigelson, E. D., Getman, K. V., Bauer, F. E., & Garmire, G. P. 2010, ApJ, 714, 1582
- Brusa et al. (2009) Brusa, M., et al. 2009, ApJ, 693, 8
- Cash (1979) Cash, W. 1979, ApJ, 228, 939
- Castellano et al. (2010) Castellano, M., et al. 2010, A&A, 524, A28+
- Civano et al. (2011) Civano, F., et al. 2011, ApJ, submitted
- Comastri (2004) Comastri, A. 2004, in Astrophysics and Space Science Library, Vol. 308, Supermassive Black Holes in the Distant Universe, ed. A. J. Barger, 245–+
- Comastri et al. (2011) Comastri, A., et al. 2011, A&A, 526, L9+
- Coppin et al. (2009) Coppin, K. E. K., et al. 2009, MNRAS, 395, 1905
- Coppin et al. (2010) —. 2010, MNRAS, 407, L103
- Daddi et al. (2007) Daddi, E., et al. 2007, ApJ, 670, 173
- Elvis et al. (1994) Elvis, M., et al. 1994, ApJS, 95, 1
- Fabian (1999) Fabian, A. C. 1999, MNRAS, 308, L39
- Feruglio et al. (2011) Feruglio, C., Daddi, E., Fiore, F., Alexander, D. M., Piconcelli, E., & Malacaria, C. 2011, ArXiv e-prints
- Fiore et al. (2009) Fiore, F., et al. 2009, ApJ, 693, 447
- Gaskell & Benker (2007) Gaskell, C. M., & Benker, A. J. 2007, ArXiv e-prints
- Giacconi et al. (2002) Giacconi, R., et al. 2002, ApJS, 139, 369
- Giavalisco et al. (2004) Giavalisco, M., et al. 2004, ApJ, 600, L93
- Gilli et al. (2007) Gilli, R., Comastri, A., & Hasinger, G. 2007, A&A, 463, 79
- Lamastra et al. (2010) Lamastra, A., Menci, N., Maiolino, R., Fiore, F., & Merloni, A. 2010, MNRAS, 405, 29
- Lehmer et al. (2010) Lehmer, B. D., Alexander, D. M., Bauer, F. E., Brandt, W. N., Goulding, A. D., Jenkins, L. P., Ptak, A., & Roberts, T. P. 2010, ApJ, 724, 559
- Luo et al. (2008) Luo, B., et al. 2008, ApJS, 179, 19
- Maiolino et al. (2001) Maiolino, R., Marconi, A., & Oliva, E. 2001, A&A, 365, 37
- Marconi et al. (2004) Marconi, A., Risaliti, G., Gilli, R., Hunt, L. K., Maiolino, R., & Salvati, M. 2004, MNRAS, 351, 169
- Menci et al. (2008) Menci, N., Fiore, F., Puccetti, S., & Cavaliere, A. 2008, ApJ, 686, 219
- Murphy & Yaqoob (2009) Murphy, K. D., & Yaqoob, T. 2009, MNRAS, 397, 1549
- Murray et al. (2010) Murray, S. S., et al. 2010, in Presented at the Society of Photo-Optical Instrumentation Engineers (SPIE) Conference, Vol. 7732, Society of Photo-Optical Instrumentation Engineers (SPIE) Conference Series
- Norman et al. (2002) Norman, C., et al. 2002, ApJ, 571, 218
- Oesch et al. (2007) Oesch, P. A., et al. 2007, ApJ, 671, 1212
- Polletta et al. (2008) Polletta, M., et al. 2008, A&A, 492, 81
- Pozzi et al. (2010) Pozzi, F., et al. 2010, A&A, 517, A11+
- Ranalli et al. (2003) Ranalli, P., Comastri, A., & Setti, G. 2003, A&A, 399, 39
- Remillard & McClintock (2006) Remillard, R. A., & McClintock, J. E. 2006, ARA&A, 44, 49
- Ricciardelli et al. (2010) Ricciardelli, E., Trujillo, I., Buitrago, F., & Conselice, C. J. 2010, MNRAS, 406, 230
- Risaliti et al. (1999) Risaliti, G., Maiolino, R., & Salvati, M. 1999, ApJ, 522, 157
- Su et al. (2011) Su, J., et al. 2011, ApJ, submitted
- Teplitz et al. (2011) Teplitz, H. I., et al. 2011, AJ, 141, 1
- Tozzi et al. (2006) Tozzi, P., et al. 2006, A&A, 451, 457
- Treister et al. (2009) Treister, E., Urry, C. M., & Virani, S. 2009, ApJ, 696, 110
- Vanzella et al. (2006) Vanzella, E., et al. 2006, A&A, 454, 423
- Vignali et al. (2009) Vignali, C., et al. 2009, MNRAS, 395, 2189
- White et al. (2010) White, N. E., Parmar, A., Kunieda, H., Nandra, K., Ohashi, T., & Bookbinder, J. 2010, in American Institute of Physics Conference Series, Vol. 1248, American Institute of Physics Conference Series, ed. A. Comastri, L. Angelini, & M. Cappi, 561–566
- Xue et al. (2011) Xue, Y. Q., et al. 2011, ApJS, submitted
- Yaqoob (1997) Yaqoob, T. 1997, ApJ, 479, 184