The Evolution of Isotope Ratios in the Milky Way Galaxy
Abstract
Isotope ratios have opened a new window into the study of the details of stellar evolution, supernovae, and galactic chemical evolution. We present the evolution of the isotope ratios of elemental abundances (from C to Zn) in the solar neighbourhood, bulge, halo, and thick disk, using chemical evolution models with updated yields of Asymptotic Giant Branch (AGB) stars and core-collapse supernovae. The evolutionary history of each element is different owing to the effects of the initial progenitor mass and metallicity on element production. In the bulge and thick disk the star formation timescale is shorter than in the solar neighbourhood, leading to higher [/Fe] ratios. Likewise, the smaller contribution from Type Ia supernovae in these regions leads to lower [Mn/Fe] ratios. Also in the bulge, the abundances of [(Na, Al, P, Cl, K, Sc, Cu, Zn)/Fe] are higher because of the effect of metallicity on element production from core-collapse supernovae. According to our predictions, it is possible to find metal-rich stars ([Fe/H] ) that formed in the early Universe as a result of rapid star formation. The chemical enrichment timescale of the halo is longer than in the solar neighbourhood, and consequently the ratios of [(C, F)/Fe] and 12C/13C are higher owing to a significant contribution from low-mass AGB stars. While the [/Fe] and [Mn/Fe] ratios are the same as in the solar neighbourhood, the [(Na, Al, P, Cl, K, Sc, Cu, Zn)/Fe] ratios are predicted to be lower. Furthermore, we predict that isotope ratios such as 24Mg/25,26Mg are larger because of the contribution from low-metallicity supernovae. Using isotopic ratios it is possible to select stars that formed in a system with a low chemical enrichment efficiency such as the satellite galaxies that were accreted onto our own Milky Way Galaxy.
keywords:
Galaxy: abundances — Galaxy: evolution — stars: abundances — stars: AGB and post-AGB — stars: supernovae1 Introduction
Elemental and isotopic abundances are the fossils of galactic archaeology. Different elements are produced from stars on different timescales, therefore elemental and isotopic abundance ratios provide independent information on the “age” of a system and can be used as a form of “cosmic clock”. The formation and evolutionary history of galaxies can be constrained in theoretical models by using the information contained in the elemental abundances observed in stars (e.g., Tinsley, 1980; Pagel, 1997; Matteucci, 2001). The space astrometry missions (e.g., GAIA) and large-scale surveys (e.g., the high-resolution multi-object spectrograph HERMES on the Anglo-Australian Telescope) will produce unprecedented information on the chemodynamical structure of the Milky Way Galaxy. Theoretically Kobayashi et al. (2006, hereafter K06) succeeded in reproducing the average evolution of major elements (except for Ti) in the solar neighbourhood (see also the recent study by Romano et al. 2010), and Kobayashi & Nakasato (2010, hereafter KN11) predicted the frequency distribution of elements in the Milky Way Galaxy depending on the location.
Isotope ratios of elemental abundances can provide more constraints not only on galaxy formation and evolution, but also on the detailed physics of Asymptotic Giant Branch (AGB) stars and supernovae. The isotopic ratios of C, N, O, and Si have been measured in ancient meteorites and provide information on conditions in the proto-solar nebula (e.g., Anders & Zinner, 1993), as well as the composition of stellar winds from pre-solar grains (e.g., Zinner, 1998). Attempts have been made to use meteoritic data to trace the chemical enrichment history of the Milky Way, although this has been done only for a limited number of elements including O, Mg (Nittler et al., 2008; Nittler, 2009), and Si (Lugaro, 1999; Zinner et al., 2006). The determination of isotopic ratios from stellar spectra requires very high quality data, and isotopic determinations are only available for a small number of elements including Li, C (e.g., Spite et al., 2006), O (Smith & Lambert, 1990), Mg (Yong, Lambert, & Ivans, 2003; Meléndez & Cohen, 2007), Ti (Hughes et al., 2008), Ba (Gallagher et al., 2010), and Eu (Sneden et al., 2002). It should be noted however that from that list only the carbon isotope ratio is relatively easy to obtain. For this reason there is data for the carbon isotope ratio for stars in many different evolutionary states, metallicities, and locations (including in external galaxies such as the Large and Small Magellanic Cloud). For this reason, the 13C/12C ratio is used to study the internal mixing and evolution of the observed stars since this ratio changes with time. These changes are predicted for low and intermediate-mass stars as well as for massive stars that evolve through the Wolf-Rayet phase. With the next generation of telescopes, the study of isotopes will expand beyond the Milky Way and neighbouring Magellanic Clouds toward the brightest stars in the outer halo or in neighbouring dwarf spheroidal galaxies. This will allow us to gain deeper insights into the galactic archaeology beyond our own local neighbourhood.
However, there are only a small number of theoretical predictions of the evolution of the isotopes including the studies by Timmes, Woosley, & Weaver (1995), Romano & Matteucci (2003), Fenner et al. (2003), Chiappini et al. (2006), and Hughes et al. (2008). In this paper we present predictions for the time evolution of isotope ratios of elemental abundances (from C to Zn) in the Milky Way Galaxy. We do this by using the most up-to-date nucleosynthesis yields of core-collapse supernovae and AGB stars that are available. In §2, we describe our chemical evolution models, and present new and updated supernovae yields. These new yields are then compared to the AGB yields from Karakas (2010). In §3, we show the time/metallicity evolution of elemental abundances and isotope ratios for the solar neighbourhood, bulge, halo, and thick disk. We focus on the average evolution of abundances in the Galaxy and assume that the abundances of the carbon-enhanced metal-poor stars (CEMP, Beers & Christlieb, 2005) are explained with other effects such as inhomogeneous enrichment, faint supernovae, and binary effects. We end with conclusions in §4.
2 The Model
2.1 Chemical Enrichment Sources
We include the latest chemical enrichment input into our chemical evolution models as follows. The basic equations of galactic chemical evolution are described in Kobayashi, Tsujimoto & Nomoto (2000, hereafter K00) and K06, where the instantaneous recycling approximation is not applied, i.e., the contributions from stars of all mass ranges are computed as a function of the initial masses and metallicities of stars.
Stellar winds — The envelope mass and pre-existing heavy elements are returned by stellar winds from all dying stars. From stars with initial masses of , it is assumed that no new metals are ejected, and that only the material outside the He core is returned to the interstellar medium (ISM), which contains elements with the abundance pattern of the Galaxy at the time when the stars formed. The He core mass is set as and for and , respectively.
Asymptotic Giant Branch (AGB) stars — Stars with initial masses between about (depending on metallicity) pass through the thermally-pulsing AGB phase. The He-burning shell is thermally unstable and can drive mixing between the nuclearly processed core and envelope. This mixing is known as the third dredge-up (TDU), and is responsible for enriching the surface in 12C and other products of He-burning, as well as elements heavier than Fe produced by the slow neutron capture process (Busso, Gallino, & Wasserburg, ; Herwig, 2005). Importantly, the TDU can result in the formation of a C-rich envelope, where the C/O ratio in the surface layers exceeds unity. In AGB stars with initial masses , the base of the convective envelope becomes hot enough to sustain proton-capture nucleosynthesis (hot bottom burning, HBB). HBB can change the surface composition because the entire envelope is exposed to the hot burning region a few thousand times per interpulse period. The CNO cycles operate to convert the freshly synthesized 12C into primary 14N, and the NeNa and MgAl chains may also operate to produce 23Na and Al. AGB stars with HBB have short lifetimes ( Myr) and are one of the stellar sites proposed as the polluters of globular clusters (e.g., Cottrell & Da Costa, 1981; Renzini, 2008), even if quantitative problems with the models exist (e.g., Fenner et al., 2004). Overall a large fraction of light elements such as C, N and F are produced by AGB stars, while the contribution toward heavier elements (from Na to Fe) is negligible, except perhaps for specific isotopes (e.g., 22Ne, 25,26Mg), in the context of galactic chemical evolution. AGB stars are also an important source of elements heavier than Fe (Travaglio et al., 2001, 2004).
The nucleosynthesis yields of Karakas (2010) were calculated from detailed stellar models, where the structure was computed first and the nucleosynthesis calculated afterward using a post-processing algorithm. Yields are included for 77 nuclei including all stable isotopes from H to 34S, and for a small group of Fe-peak nuclei. The details of this procedure and the codes used to compute the models have been previously described in some detail, see for example Karakas et al. (2009) and references therein. All models were evolved from the zero-age main sequence to near the tip of the thermally pulsing AGB. The TDU efficiency governs the nucleosynthesis in the lower mass models; this was found to vary as a function of H-exhausted core mass, metallicity, and envelope mass (see Karakas et al., 2002, for details). For example, in the models, no TDU was found for . For the intermediate-mass models, the TDU was found to be efficient and the occurrence of HBB also played a strong role in determining the final yields. The occurrence of HBB also strongly depends on the initial mass and metallicity, with HBB occurring in lower mass stars with a decrease in metallicity (at 3 at whereas it only starts at at ). Furthermore, HBB is eventually shut off by the action of mass loss.
The main uncertainties affecting the nucleosynthesis yields of AGB stars involve convection and mass loss. The models employ the mixing-length theory of convection with . On the first giant branch, Reimer’s mass loss is adopted with . On the AGB, Vassiliadis & Wood (1993) mass loss is used for most models, with the exception of the intermediate-mass 3 to 6 with models, where we adopt Reimer’s mass loss (see Karakas, 2010, for details).
The main difference between the Karakas & Lattanzio (2007) and Karakas (2010) yields is the choice of reaction rates used in the post-processing algorithm. Karakas (2010) used an updated set of proton and -capture rates that include some of the latest experimental results for important reactions involved in the CNO cycle, NeNa and MgAl chains. Furthermore, Karakas (2010) assumed scaled-solar initial abundances for the and models. In contrast, Karakas & Lattanzio (2007) adopted initial abundances for the Large and Small Magellanic Clouds from Russell & Dopita (1992) which are sub-solar for C, N, and O. The updated reaction rates of the , , and reactions result in to 30 times less Na is produced by intermediate-mass models with HBB. Note that with the updated yields the Na overproduction problem found by Fenner et al. (2004) may be solved (but not the O depletion required stars in globular clusters, although see models by Ventura & D’Antona (2009)).
We take the AGB yields for , 1.25, 1.5, 1.75, 1.9, 111 model is provided for and 0.008., 2.25, 2.5, 3.0, 3.5, 4.0, 4.5, 5.0, 5.5, 6.0, and 222 model is available only for . and , 0.004, 0.008, and 0.02 from Karakas (2010). We use the yields for at . The yields of the radioactive isotopes 26Al and 60Fe are added to 26Mg and 60Ni yields, respectively. The masses of white dwarfs, , are also taken from Karakas (2010), and the material outside the white dwarfs () is returned to the ISM via stellar winds, which contains the newly produced metals (processed metals) and the initial metals that existed in the progenitor stars (unprocessed metals).
The AGB yields () are defined as the difference between the amount of the species in the wind and the initial amount in the progenitor star. Therefore, the yields of some isotopes (e.g., 15N) are negative because they are destroyed during stellar evolution. However, in chemical evolution models, it is possible that the abundances of such elements at time is lower than the adopted initial abundances, which causes numerical problems. This is often the case for 15N, and we set the 15N yield to be 0 if it is negative. In chemical evolution models, we define the mass of ejecta as the summation of processed metals . The rest () contains unprocessed metals, of which the abundance pattern is not scaled with the solar abundance, but is the abundance pattern of the galaxy at the time when the stars formed.
For , theoretical models of stars undergo violent evolutionary episodes not seen at higher metallicities. The ingestion of hydrogen leads to an H flash, followed by a “normal” He-shell burning phase. We take the yields and remnant masses from Campbell & Lattanzio (2008) for , and . For Na, we assume that the yield is reduced by a factor of 10 because the old reaction rates were adopted in the calculations. At , no metals are produced. This assumption may not be valid but does not affect the average chemical evolution of galaxies.
Super AGB stars — The fate of stars with initial masses between about is uncertain. The upper limit of AGB stars, , is defined as the minimum mass for carbon ignition, and is estimated to be larger at high metallicity and also at low metallicity than at (Gil-Pons et al., 2007; Siess, 2007). At , stars may produce some heavy elements and may explode as so-called Type 1.5 supernovae, although no such supernovae has yet been observed (K06). Above this mass range, stars may explode as electron-capture supernovae (Nomoto, 1984; Kitaura, Janka, & Hillebrandt, 2006), but the metal production (lighter than Fe) is predicted to be very small. In our models, we set , and for , 0.0001, 0.004, 0.008, and 0.02, respectively, and assume that no metals are produced from 333The remnant mass at is extrapolated for . to . The remnant mass is set as , and for , and , respectively.
Core-collapse supernovae — Although a few groups have presented feasible calculations of exploding stars (Marek & Janka, 2009; Bruenn et al., 2009), the explosion mechanism of core-collapse supernovae (Type II, Ib, and Ic Supernovae) is still uncertain. However, the ejected explosion energy and 56Ni mass (which decays to 56Fe) can be directly estimated from the observations, i.e., from the light curve and spectral fitting of individual supernova. As a result, it is found that many core-collapse supernovae () have an explosion energy that is more than 10 times that of a regular supernova (, Nomoto et al. 2006), as well as producing more iron and elements (O, Mg, Si, S, Ca, and Ti). These are called as hypernovae (HNe). The fraction of HNe is uncertain and we set at .
Kobayashi et al. (2006) presented the nucleosynthesis yields of SNe II and HNe as a function of the progenitor mass (, 15, 18, 20, 25, 30, and ) and metallicity (, 0.001, 0.004, and ). In terms of isotope ratios, three models, [, ] and [, ] for SNe II and HNe, showed a relatively large production of 13C and N. This was caused by the convective mixing of hydrogen into the He-burning layer. The cause of this mixing is uncertain and it does not always manifest itself in the stellar models. For this reason, we re-calculated the progenitor star models and explosive nucleosynthesis. The results of these new calculations without such mixing are presented in Table 2 and shown in Figs. 1-10. While the updated yields of 13C and N are reduced compared to the results of K06, the yields of other major isotopes are not significantly different.
As in K06, the yield tables provide the amount of processed metals () in the ejecta (in ). The mass of the ejecta is given as . Stellar winds reduce the stellar mass to at the onset of the supernova explosion, with the central mass falling onto the remnant. The stellar winds with the mass of contains unprocessed metals, which are not included in the tables but are included in the chemical evolution models. The contribution from the stellar winds are added (Eq.8 in K00) to the supernova ejecta (Eq.9 in K00). The abundance pattern of the stellar winds is not scaled with the solar abundance but is the abundance pattern of the galaxy at the time when the stars formed. Note that newly synthesized 4He in the winds is not included and thus we will leave the evolution of helium to a future study.
The upper limit of core-collapse supernovae, , is not well known owing to uncertainties in the physics of blackhole formation. We set , which is constrained from the [/Fe] plateau at [Fe/H] (K06). Because the envelope mass that contains elements is larger for massive stars, a larger results in higher [/Fe] ratios. For , we assume that no metals are produced because the central part of the progenitor is likely to collapse to form a blackhole.
Rotating massive stars — The rotation of stars induces the mixing of C into the H-burning shell, which produces a large amount of primary nitrogen (Meynet & Maeder, 2002; Hirschi, 2007). Rotation also affects the CO core mass, and a few groups are calculating the stellar evolution of rotating stars from the main sequence through to the final explosive supernova stage, although the yields are not yet available. The rotational velocity of these stars is typically a free parameter. To show the effect of rotation, in one of our models we include the yields of 3,4He, 12,13C, 14N, 16,17,18O, and 22Ne from Hirschi (2007) for with [, 600 km s], [, 700 km s], and [, 800 km s], with .
Pair-Instability supernovae — Stars with encounter the electron-positron pair instability and do not reach the temperature of iron photodisintegration. Pair-instability supernovae (PISNe) are predicted to produce a large amount of metals such as S and Fe. This contribution is not included in our chemical evolution models because the number of such stars are expected to be very small and because no signature of PISNe has been detected in metal-poor stars (Umeda & Nomoto, 2002, 2005). Recently, Kobayashi, Tominaga, & Nomoto (2010) showed that the observed elemental abundance pattern of very metal-poor Damped Lyman systems is inconsistent with the yields of PISNe, and is instead consistent with the yields of faint core-collapse supernovae.
Type Ia Supernovae (SNe Ia) — The progenitors of the majority of SNe Ia are most likely Chandrasekhar (Ch) mass white dwarfs (WDs). For the evolution of accreting CO WDs toward the Ch mass, two scenarios have been proposed. One is the double-degenerate scenario, i.e., the merging of double CO WDs with a combined mass surpassing the Ch mass limit. However, it has been theoretically suggested that this leads to accretion-induced collapse rather than SNe Ia (Nomoto & Kondo, 1991), and the lifetimes are too short to reproduce the chemical evolution in the solar neighbourhood (Kobayashi et al. 1998, hereafter K98; Kobayashi & Nomoto 2009, hereafter KN09). The other is the single-degenerate (SD) scenario, i.e., the WD mass grows by accretion of hydrogen-rich matter via mass transfer from a binary companion. The mass accretion rate is limited to trigger carbon deflagration (Nomoto, 1982), but the allowed parameter space of binary systems can be significantly increased by the WD wind effect if the metallicity is higher than [Fe/H] (K98).
In our models, based on the SD scenario, the lifetime distribution function of SNe Ia is calculated with Eq.[2] in KN09, taking into account the metallicity dependence of the WD winds (K98) and the mass-stripping effect on the binary companion stars (KN09). There are two kinds of progenitor systems. One is the main-sequenceWD system with timescales of Gyr, which are dominant in star-forming galaxies (the so-called prompt population). The other is the red-giantsWD system with lifetimes of Gyr, which are dominant in early-type galaxies. Although the metallicity effect of SNe Ia has not yet been confirmed by supernova surveys, it is required to account for the presence of a young population of SNe Ia, which in turn are required by chemical evolution of the Milky Way Galaxy (KN09). Note that the observed elemental abundance pattern (e.g., the low [Mn/Fe] ratios) in dwarf spheroidal galaxies are more consistent with the enrichment from low-mass SNe II than that from the SN Ia enrichment (K06).
For SNe Ia we take the nucleosynthesis yields from Nomoto et al. (1997). The metallicity dependence of the progenitors is not included but is not expected to be very large (H. Umeda, K. Nomoto, et al., private communication). Note that Ni is overproduced at [Fe/H] compared to the observations in the solar neighbourhood, but this can be solved by tuning the propagation speed of the burning front and the central density of the white dwarf (Iwamoto et al., 1999).
2.2 Yields
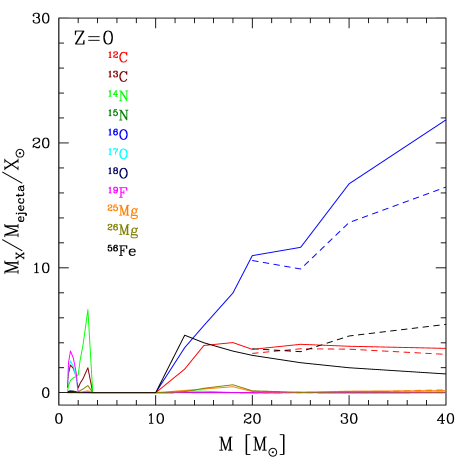
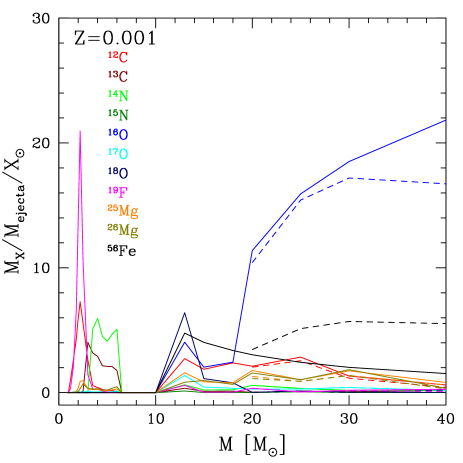
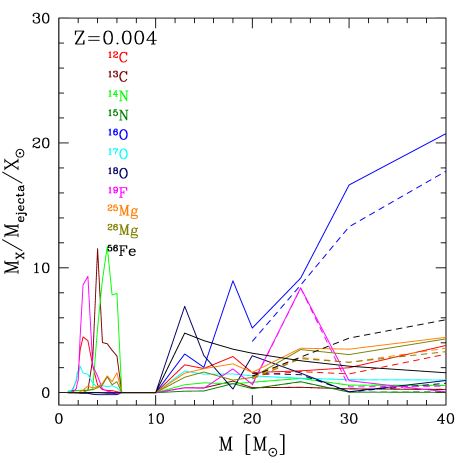
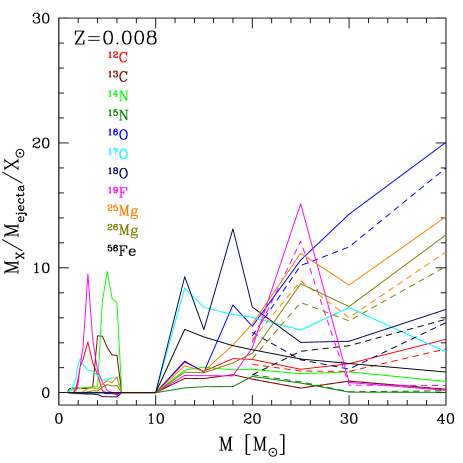
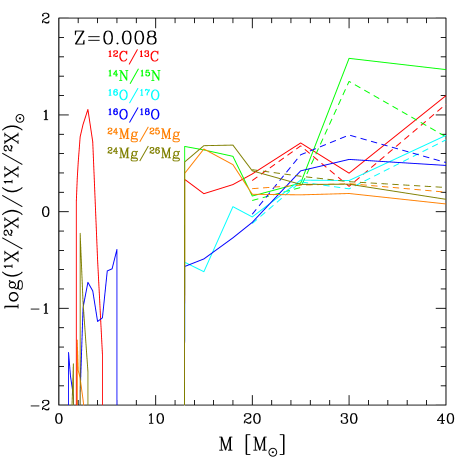
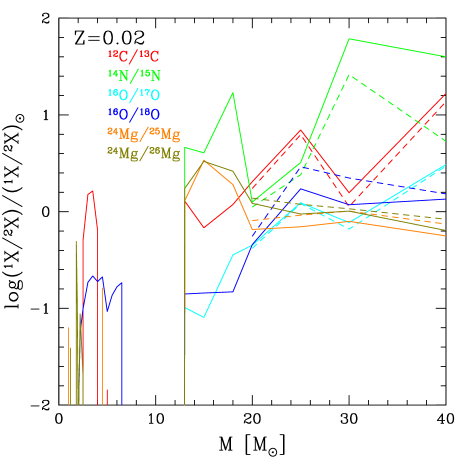
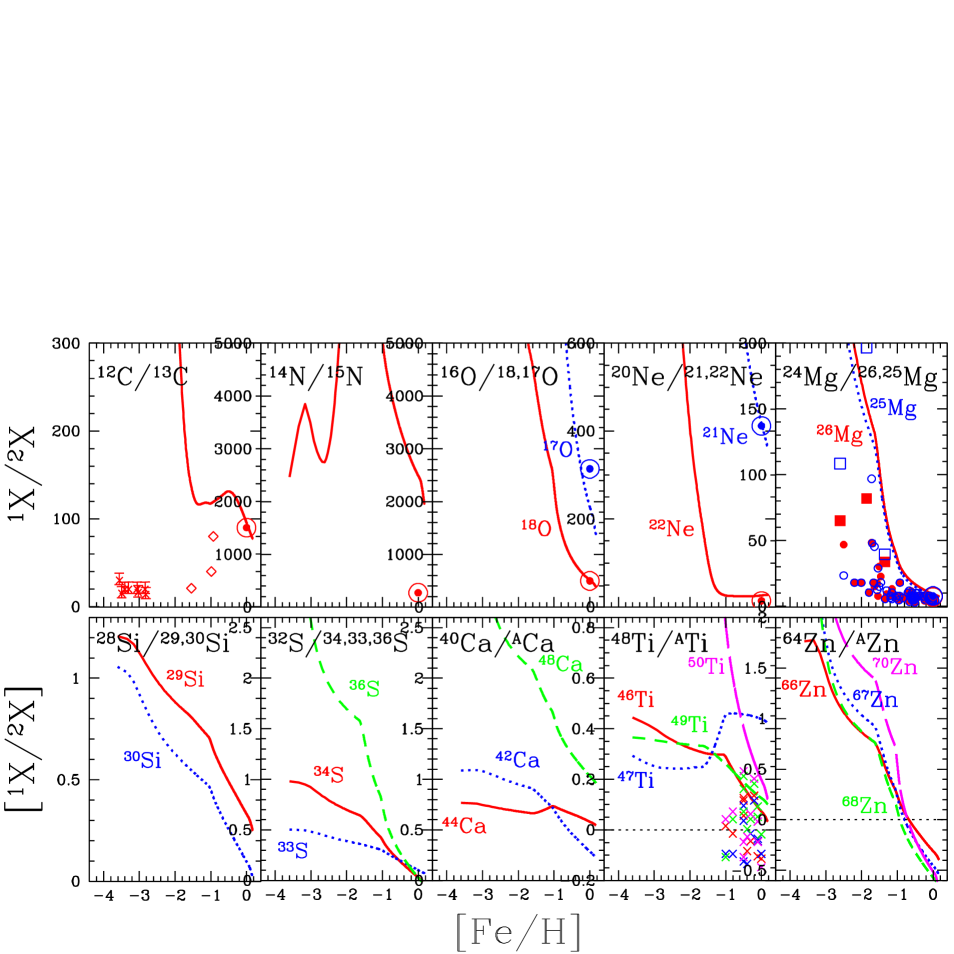
Figures 1-5 and Figures 6-10 show the yields and the isotope ratios as a function of the mass and metallicity, normalized to the solar abundance (Anders & Grevesse, 1989, hereafter AG89). The yields are also normalized to the mass of the ejecta , which are much smaller for AGB stars than for supernovae. However, the AGB yields of C, N, and F are comparable to those of supernovae.
CNO cycling at K results in the production of 13C, 14N, and 17O. Core and shell He-burning results in the synthesis of 12C, 16O, and 19F at K. The heavy isotope of oxygen, 18O, is destroyed by proton captures in stellar interiors by CNO cycling, and produced and then destroyed again by -captures via followed by (e.g., Arnett, 1996). Further secondary He-burning reactions can synthesize 25,26Mg via and , which follow after . The majority of 18O and elements heavier than fluorine up to the Fe peak are produced by hydrostatic burning ( K) and explosive nucleosynthesis ( K) in massive stars ().
The AGB yields show that 12C and 19F are significantly produced in low-mass stars () whereas 13C, 14N, 25Mg, and 26Mg are produced in intermediate-mass () stars. The yields of 19F in Karakas (2010) have increased compared to Karakas & Lattanzio (2007), owing to a slower reaction rate. The production of F and the neutron-rich Mg isotopes in AGB stars are highly mass dependent. F production peaks at at solar metallicity (Lugaro et al., 2004); in higher mass models F is destroyed by -captures by the higher temperatures reached during He-burning. Likewise, 25Mg and 26Mg are only produced by He-burning when the temperature exceeds about K and these conditions are only reached by intermediate-mass AGB stars (Karakas et al., 2006). 17O is produced by the entire AGB mass range, with relatively more from low-mass AGB stars. The yields of 15N, 16O, and 18O are negative in most cases indicating that these isotopes are destroyed by AGB nucleosynthesis with the largest destruction taking place by HBB in intermediate-mass AGB stars.
Core-collapse supernovae are the main producers of the major isotopes with more minor isotopes produced at higher metallicity. This is because minor isotopes are synthesized as secondary elements from the seed of the major isotopes. As a result, the ratios between the major and minor isotopes are larger for supernovae than for AGB stars, except for 12C/13C at (and 14N/15N). The ratios are, in general, larger for low-metallicity supernovae, and approach the solar ratios ([1X/2X]=0) with an increase in the metallicity.
2.3 Initial Mass Function
We adopt the recent observational estimate of the initial mass function (IMF) from Kroupa (2008), which is a power-law mass spectrum with three slopes at different mass ranges: for , for , and for . At the high-mass end, the slope of the Kroupa IMF is almost the same as the Salpeter (1955) IMF (), and is flatter than the Miller & Scalo (1979) IMF. Metal enrichment is only obtained from stars with , hence chemical evolution predictions obtained with the Kroupa IMF are not significantly different from K06’s results with the Salpeter IMF at . In Figure 11 we show that the Kroupa (short-dashed lines) and Salpeter (solid lines) IMFs can provide almost the same age-metallicity relation, [O/Fe]-[Fe/H] relation, and metallicity distribution function (MDF).
The mass distribution of stars from the Chabrier (2003) IMF is peaked at , leading to fewer stars with , and a steeper slope at the high-mass end than the Kroupa and Salpeter IMFs. Although the Chabrier IMF is adopted for many cosmological simulations, the metal production that results is too large to meet the observational constraints of the solar neighbourhood. In particular the present SN Ia rate (Mannucci et al., 2005) is too high and the [/Fe] is too high as shown in Figure 11 (long-dashed lines). These issues cannot be solved by changing SN Ia parameters.
2.4 Star Formation Histories
We use similar models as K06 for the star formation histories of the solar neighbourhood, bulge, halo, and thick disk, but with the Kroupa IMF. The galactic chemical evolution is calculated with the basic equations described in K00 and K06. In one-zone chemical evolution models, the gas fraction and the metallicity of the system evolve as a function of time by star formation, as well as infall and outflow of matter. The star formation rate (SFR) is assumed to be proportional to the gas fraction (). The infall of primordial gas from the outside of the component is given by the rate for the solar neighbourhood, and for the other components. For the halo, outflow is included such that the rate is proportional to the star formation rate (). For the bulge and thick disk, star formation is assumed to be truncated by galactic winds at a given epoch ().
The MDF is one of the most stringent constraints on the star formation history. The parameters that determine the SFRs are chosen to meet the observed MDF of each component as summarized in Table 1. The MDFs, the resultant SFR histories, and the age-metallicity relations are shown in Figure 12. The uncertainties of the observations were discussed in K06 and will not be repeated in this paper. The observed MDF in the Galactic bulge was updated by Zoccali et al. (2008), where the peak metallicity is significantly higher than the previous MDF by Zoccali et al. (2003). Except for the bulge model, compared with the K06 results, the small differences originate from the choice of the IMF and not from the updated yields presented in this paper.
| solar neighbourhood | 5 | 4.7 | - | - |
|---|---|---|---|---|
| halo | - | 15 | 1 | - |
| bulge | 5 | 0.2 | - | 3 |
| thick disk | 5 | 2.2 | - | 3 |
In the solar neighbourhood model (solid lines), star formation takes place over 13 Gyr. The MDF shows a narrow distribution peaked around [Fe/H] , which is consistent with the observations. Note that introducing infall significantly reduces the number of metal-poor G-dwarf stars (Tinsley, 1980), and thus there is no G-dwarf problem in the predicted MDF according to our models.
For the bulge (long-dashed lines), we use the infallwind model (model B in K06) with a short star-formation timescale. The infall is required to explain the lack of metal-poor stars and the wind is adopted to reproduce the sharp-cut of the observed MDF at the metal-rich end. It is possible that star formation continues at present time, forming super metal-rich stars in the Galactic bulge. In this case the SFR should be low to meet the MDF. In our bulge model the duration of star formation is set to be 3 Gyr, which results in a peak metallicity of [Fe/H] . A much higher efficiency of chemical enrichment, e.g., a flatter IMF is not required, unless the duration is much shorter than 3 Gyr. Note that the 3 Gyr duration is consistent with chemodynamical simulations of Milky Way-type galaxies from CDM initial conditions (KN11).
For the thick disk (dot-dashed lines), we use the infallwind model (model C in K06), which also gives a good agreement with the observed age-metallicity relation (Bensby et al., 2004). In the thick disk model, the formation timescale is as short as Gyr, and the star formation efficiency is larger than that for the solar neighbourhood but smaller than for the bulge. The assumption that the timescale of star formation is shorter in the bulge and thick disk was suggested by Matteucci & Brocato (1990), but by itself does not completely explain the observed abundance patterns. A more intense star formation is also required as well as a shorter star formation timescale.
For the halo (short-dashed lines), we use an outflow model without infall, which results in a low mean metallicity of [Fe/H] (e.g., Chiba & Yoshii, 1998). In the halo model, the star formation efficiency is much lower than for the other components, and the outflow causes an effective metal loss.
3 Results
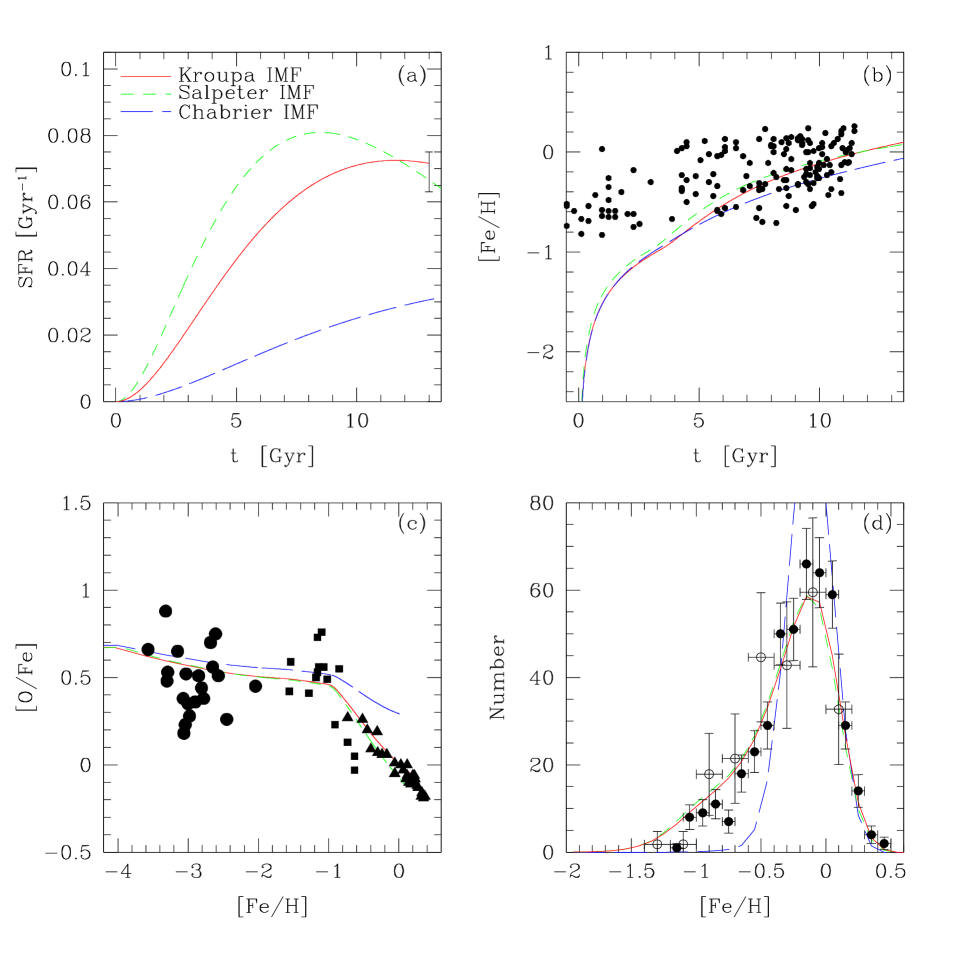
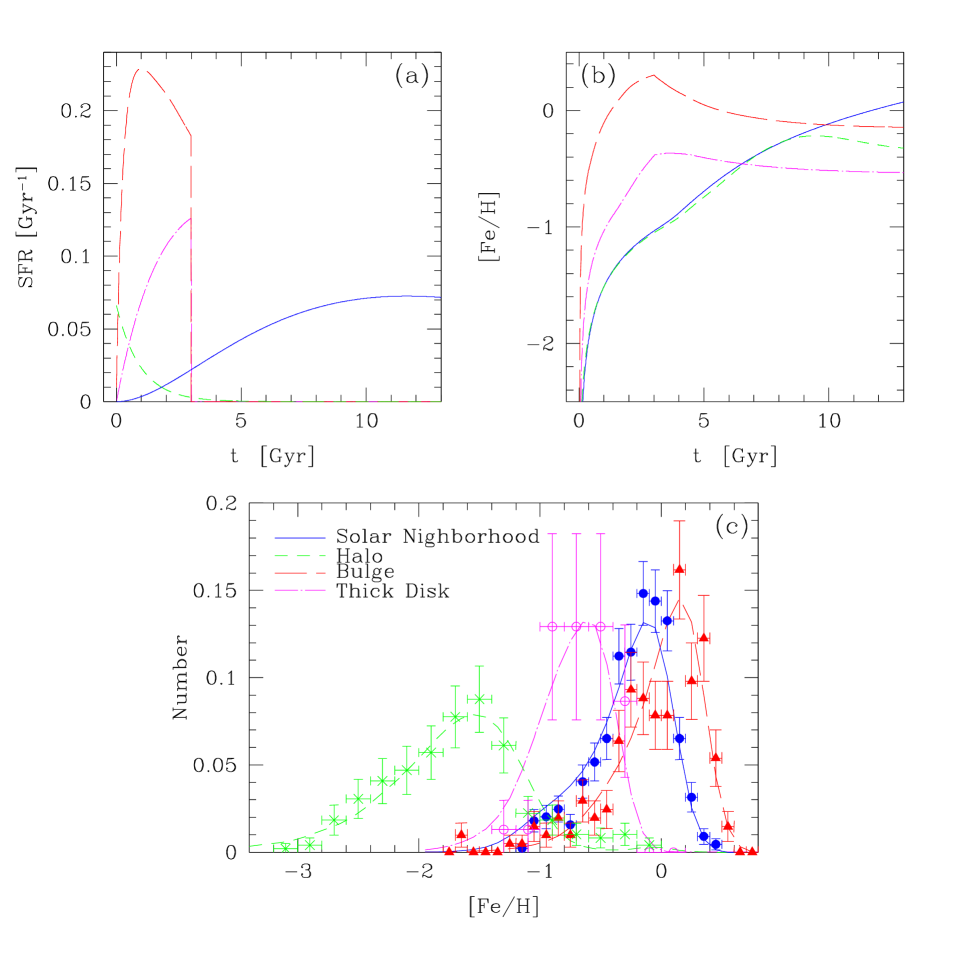
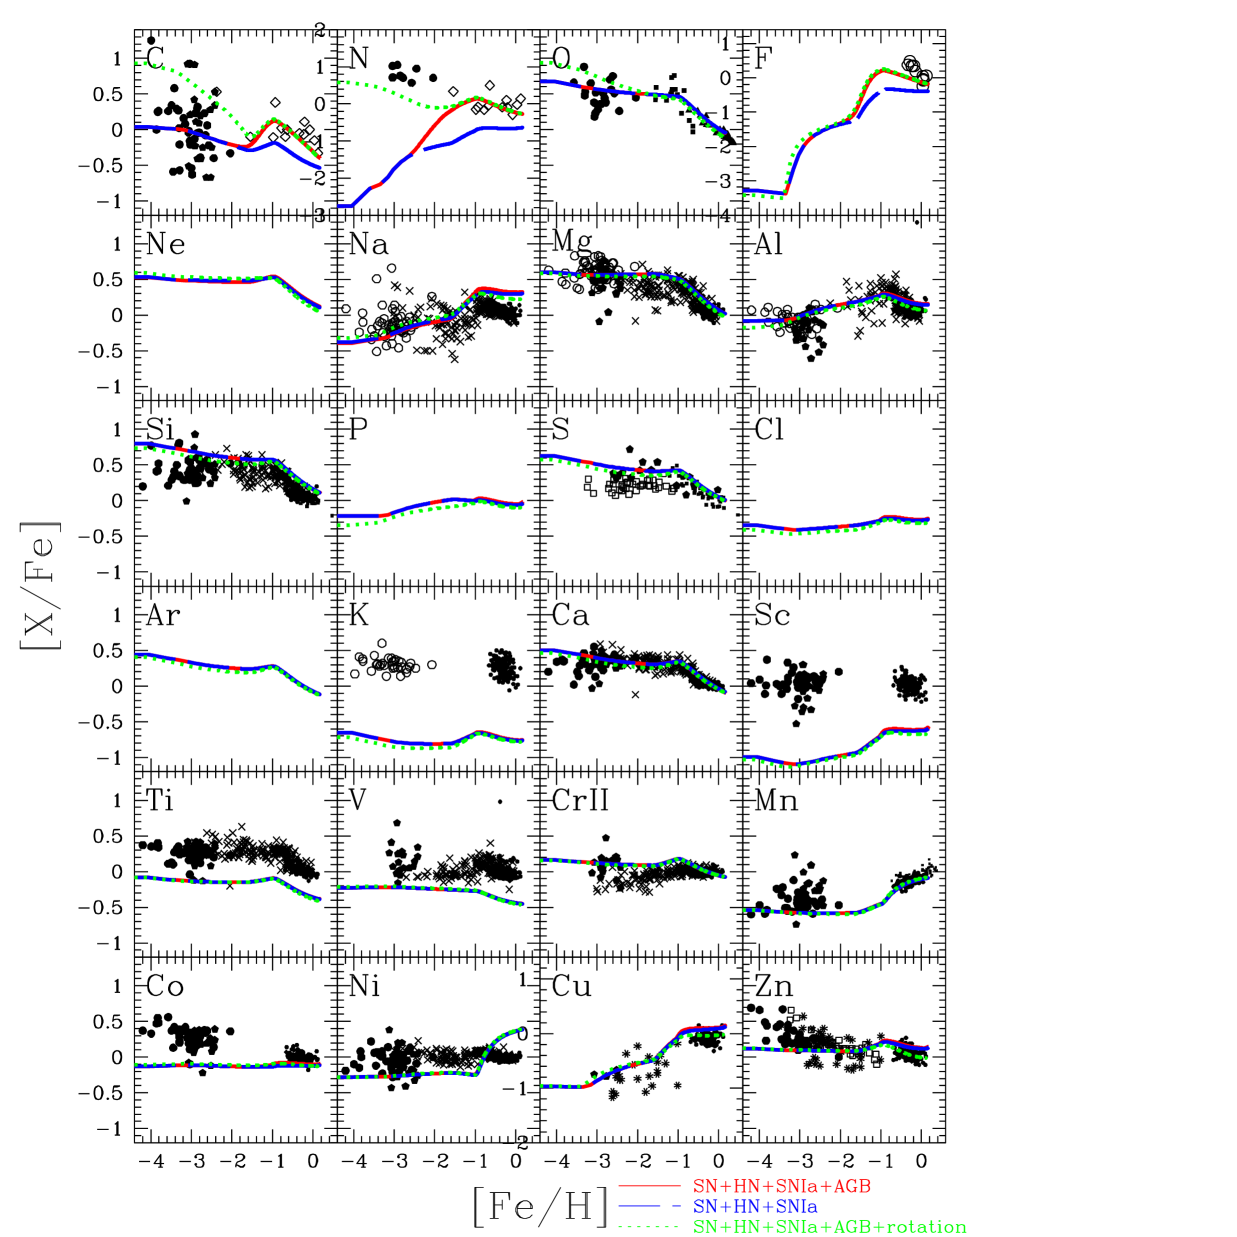
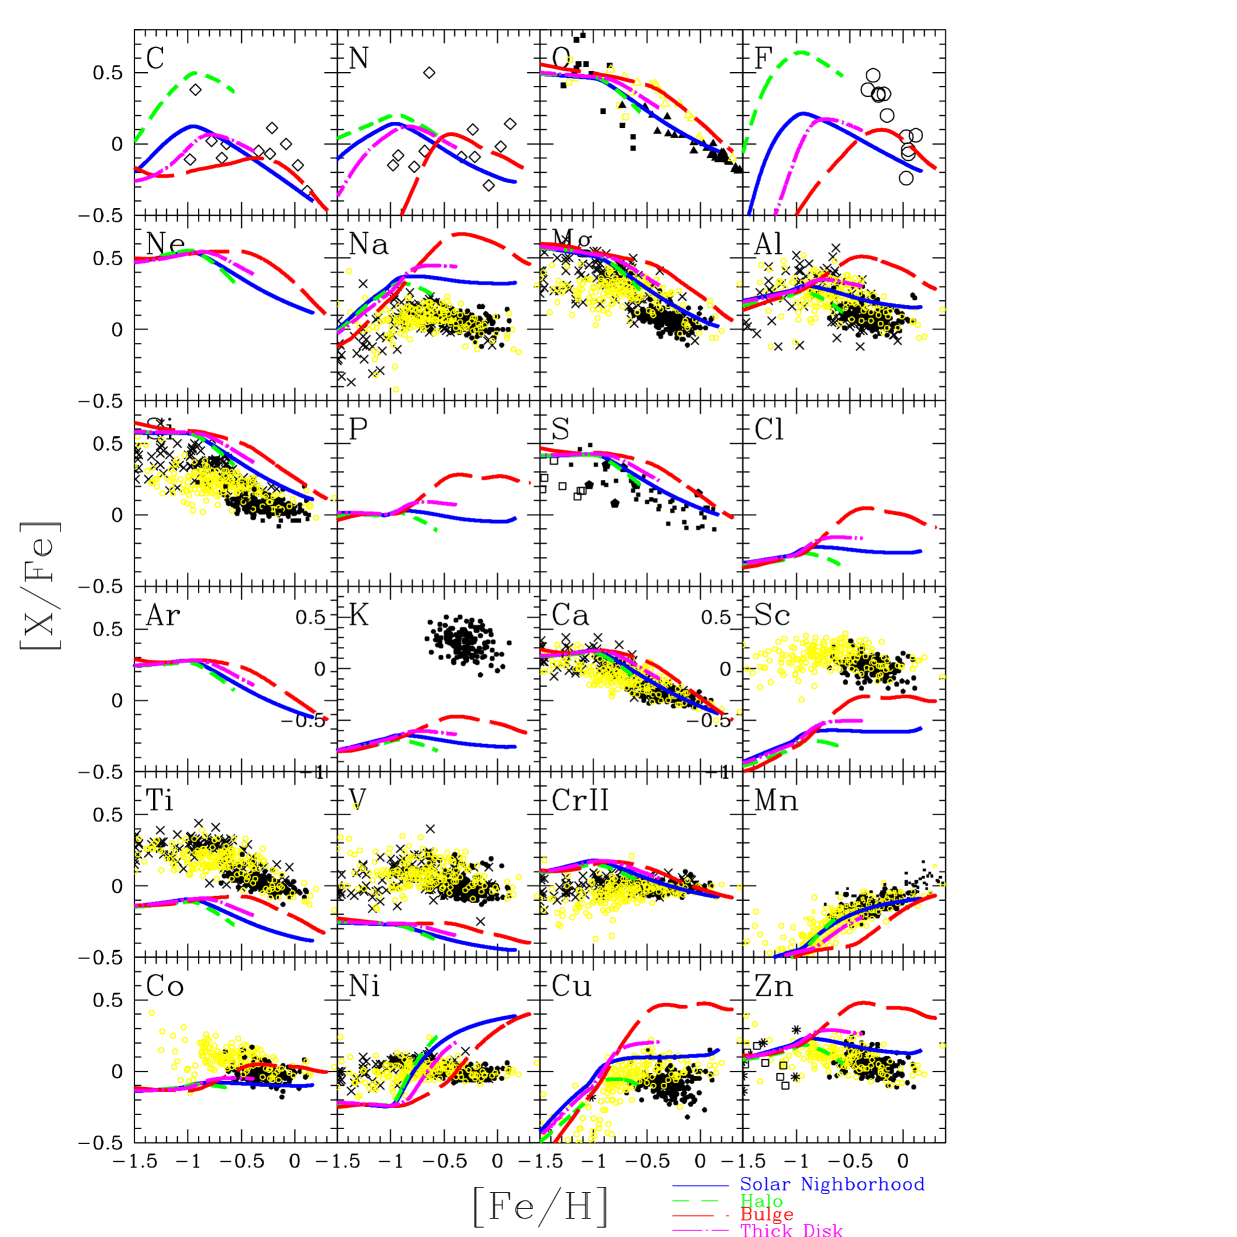
Figure 13 shows the evolution of element abundance ratios [X/Fe] against [Fe/H] for the solar neighbourhood, using the models with SNe II, HNe, and SNe Ia only (dashed lines), with AGB stars (solid lines), and with rotating massive stars at (dotted lines). The difference among models is seen only for C, N, and F. For the elements heavier than Na, the small difference among the models with and without rotating massive stars is caused by the difference in the IMF ( is adopted in the case with rotating massive stars instead of ). Observational data are taken from several sources, which were selected to minimize systematic errors as discussed in KN11. In that paper, we also discussed the different results for the lines used in the observational data analysis, which will not be repeated in this paper. For C and N, only data from unevolved stars are plotted. Both in the models and the observational data, the solar abundances from AG89 are adopted. The results are summarized as follows.
-
•
elements — In the early stages of galaxy formation only SNe II/HNe contribute and the [/Fe] ratio quickly reaches a plateau ([/Fe] ). Around [Fe/H] SNe Ia start to occur, which produce more iron than elements. This delayed enrichment of SNe Ia causes the decrease in [/Fe] with increasing [Fe/H]. The [Fe/H] where the [/Fe] starts to decrease depends on the adopted SN Ia progenitor model, and is determined not by the lifetime but by the metallicity dependence of SN Ia progenitors (KN09). As a result, this trend is in excellent agreement with the observations (dots) for O, Mg, Si, S, and Ca. Ne and Ar also show a similar trend. Ti is underabundant overall, but this problem can be solved with 2D nucleosynthesis calculations (Maeda & Nomoto, 2003), as well as for Sc and V. AGB stars do not make any difference to these trends. Although AGB stars produce significant amounts of the Mg isotopes, the inclusion of these do not affect the [Mg/Fe]-[Fe/H] relation.
-
•
Odd-Z elements — Na, Al, and Cu show a decreasing trend toward lower metallicity, which is well reproduced by the strong dependence of these elements on the metallicity of the progenitor stars (see Fig.5 in K06). In contrast, Na and Al show a decreasing trend toward higher metallicity owing to the contribution from SNe Ia, which is shallower than the trend for the elements. Such a decrease is not seen for Cu since Cu is also produced by SNe Ia. With the updated AGB yields (§2.2), [Na/Fe] is consistent with the observations, and the Na overproduction problem by AGB stars is not seen. Note that AGB stars may produce some Cu but no yields are available for a large range of masses and metallicities. K, Sc, and V are underabundant overall, a problem which has not been discussed in detail in previous studies. The -process can increase the production of these elements (Izutani, Umeda, & Yoshida 2010, private communication), although the yields are not yet available. [(P, Cl)/Fe] are also negative overall in our predictions. There is a metallicity dependence of P, Cl, K, and Sc yields at for SNe II/HNe, which causes a weak decrease from [Fe/H] to . The V yields do not depend very much on metallicity.
-
•
Iron-peak elements — [(Cr, Mn, Co, Ni, Zn)/Fe] are consistent with the observed mean values at [Fe/H] . Note that Cr II observations are plotted, because this line is not strongly affected by NLTE effect. For Mn, the NLTE effect should not be so large as indicated by Mn II observations (Johnson, 2002; Mashonkina et al., 2010), although a strong NLTE effect is reported by Bergemann & Gehren (2008). At [Fe/H] , observational data show an increasing trend of [(Co, Zn)/Fe] toward lower metallicity, which will not discussed here since inhomogeneous chemical enrichment is becoming increasingly important. The [(Co, Zn)/Fe] trend can be explained by HNe under the assumption that the observed stars were enriched by only a single supernova (Tominaga et al., 2007).
-
•
Manganese — Mn is a characteristic element of SN Ia enrichment and is produced more by SNe Ia than SNe II/HNe relative to iron. From [Fe/H] , [Mn/Fe] shows an increasing trend toward higher metallicities, which is caused by the delayed enrichment of SNe Ia. Feltzing, Fohlman, & Bensby (2007) showed a steep slope at [Fe/H] , which could be generated by the metallicity dependence of SN Ia yields. Cescutti et al. (2008) demonstrated this by applying an artificial metallicity dependence to the theoretical calculations. In principle, Mn is an odd-Z element and the Mn yields depend on the metallicity both of SNe II and SNe Ia. The metallicity dependence for SNe II are included in our yields. For SNe Ia, a strong metallicity dependence is not expected (H. Umeda, K. Nomoto, et al., private communication).
-
•
Zinc — Zn is one of the most important elements for supernova physics. [Zn/Fe] is about for a wide range of metallicities, which can only be generated by a large fraction of HNe (50% of ). In detail, there is a small oscillating trend; [Zn/Fe] is at [Fe/H] , this increases to at [Fe/H] , decreases to be again at [Fe/H] , then increases toward lower metallicity. This is characteristic of our SN Ia model (KN09) and is consistent with the observations (Saito et al., 2009). Theoretically, Zn production depends on many parameters; 64Zn is synthesized in the deepest region of HNe, while neutron-rich isotopes of zinc 66-70Zn are produced by neutron-capture processes, which are larger for higher metallicity massive SNe II. Since the observed [Zn/Fe] ratios show an increasing trend toward lower metallicity (Primas et al., 2000; Nissen et al., 2007; Saito et al., 2009), the HN fraction may have been larger in the earliest stages of galaxy formation. At higher metallicities, the HN fraction may be as small as (KN11).
-
•
Carbon — Although the ejected mass of C is similar for low-mass AGB () and massive () stars, the [C/Fe] ratio is enhanced efficiently by low-mass stars because these stars produce no Fe (Figs. 1-5). When we include AGB yields (solid lines), [C/Fe] increases from [Fe/H] , which corresponds to the lifetime of stars ( Gyr). At [Fe/H] , [C/Fe] reaches , which is dex larger than the case without AGB yields (dashed lines). This is roughly consistent with previous models such as Prantzos, Vangioni-Flam, & Chauveau (1994). At [Fe/H] , [C/Fe] shows a decrease due to SNe Ia. Because of the long lifetimes of AGB stars, no difference is seen at [Fe/H] , which is consistent with the observed behavior of s-process elements (Travaglio et al., 2004). If we include the yields of rotating massive stars (dotted lines), the [C/Fe] ratio becomes as large as at [Fe/H] . A significant fraction of metal-poor stars show carbon enrichment (CEMP stars), with several scenarios proposed to explain the observed abundances including a single supernova (e.g., Umeda & Nomoto, 2002) and AGB stars in binary systems (Suda et al., 2004; Lugaro et al., 2008; Izzard et al., 2009). Such local peculiar effects are not included in our models. We should also note that AGB stars can contribute at metallicities below [Fe/H] when an inhomogeneous chemical enrichment is taken into account (KN11).
-
•
Nitrogen — Different from C, N is produced mainly by intermediate-mass AGB stars (, independent of the integration on the IMF). Therefore, the contribution from AGB stars (solid lines) is seen at [Fe/H] . At [Fe/H] , [N/Fe] reaches , which is dex larger than the case without AGB yields (dashed lines). At [Fe/H] , [N/Fe] shows a shallow decrease due to SNe Ia. No difference is seen at [Fe/H] with and without the AGB yields, while [N/Fe] can be as large as with rotating massive stars (dotted lines). Chiappini et al. (2006) showed that the contribution from rotating massive stars is required to solve the primary N problem. As noted above, however, AGB stars can also contribute to N production even at [Fe/H] when taking inhomogeneous chemical enrichment into account (KN11). From the difference between C and N, it is possible to distinguish the contribution from low- and intermediate-mass AGB stars as the enrichment source of the observed metal-poor stars. Pols et al. (2009) showed that the IMF with the Gaussian distribution peaked at (Komiya et al., 2007) is rejected when trying to match the fraction between C-rich and N-rich stars, based on binary population synthesis models (see also Izzard et al. 2009).
-
•
Fluorine — F is one of the most interesting elements, although F abundances are estimated from only one infrared line from stellar spectra. AGB stars and massive stars have both been suggested to produce F but production has only been confirmed for AGB stars (Jorissen, Smith, & Lambert, 1992; Abia et al., 2010). The AGB mass range that produces F is similar for C and is . Thus the difference is seen only at [Fe/H] . At [Fe/H] , [F/Fe] reaches in the model with the AGB yields (solid lines). This is dex larger than the case without the AGB yields (dashed lines) and much closer to the observational data (Cunha et al., 2003). Note that the F yields from AGB stars were increased with the new reaction rates (§2). Different from C, F is not significantly produced by SNe II/HNe according to our yields, and thus [F/Fe] rapidly decreases from [Fe/H] to . Therefore, the F abundance is a good clock to distinguish the contribution from low-mass AGB stars and supernovae. We should note, however, that the F yields from supernovae may be increased by a factor of by the -process (Izutani, Umeda, & Yoshida 2010, private communication; see also Woosley & Weaver 1995). The effect of rotating massive stars is uncertain since F yields are not available in the literature.
These results are consistent with the models that adopt the same supernova and AGB yields in Romano et al. (2010, hereafter R10). There are some differences, for example, for elements heavier than N, our results fall between Models 4 and 5 in R10 because we adopt an hypernova efficient of . The C and N abundances are predicted to be higher in Models 4 and 5 than our results because the low and intermediate-mass star yields of van den Hoek & Groenewegen (1997) were used. In Model 15 of R10, the same AGB yields are adopted as in our models, but the C and N abundances are still higher. This may be due to the addition of the Geneva pre-supernova yields along with the supernova yields from K06. We note that rotation changes the pre-supernova structure and thus should also change the nucleosynthesis during the explosion. Hence to be fully self consistent, supernovae yields computed from a rotating pre-supernova structure should be included but these are not yet available for a wide range of masses and metallicities. Other model differences include the adopted IMF, star formation rates, and the SN Ia model, but these do not significantly affect the average evolution of elemental abundance ratios. However, we do observe small differences in e.g., the [/Fe]-[Fe/H] relations as a result of the the different adopted SN Ia model. In R10’s models, the evolutionary change in [O/Fe] around [Fe/H] is not as sharp as in our models. In addition, the evolutionary track around [Fe/H] in the R10 models is not smooth, which may result in a large number of stars at this point in the [O/Fe]-[Fe/H] diagram. Large and homogeneous observational data sets may help to put constraints on the modelling of SNe Ia.
Enrichment sources produce different elements on different timescales, and thus the time evolution of the elements varies as a function of location in a galaxy, depending on the star formation history. In Figure 14 we show the evolution of elemental abundance ratios [X/Fe] against [Fe/H] for the solar neighbourhood (solid lines), halo (short-dashed lines), bulge (long-dashed lines), and thick disk (dot-dashed lines), where the contributions from SNe II, HNe, SNe Ia, and AGB stars are included.
Bulge and thick-disk — If the star formation timescale is shorter than in the solar neighbourhood (solid lines) as in our bulge (long-dashed lines) and thick-disk (dot-dashed lines) models, the contribution from stars of a given lifetime appear at a higher metallicity than in the solar neighbourhood. Intermediate-mass AGB stars, low-mass AGB stars, and SNe Ia start to contribute at [Fe/H] , and , respectively in the solar neighbourhood, but at a higher [Fe/H] in the bulge and thick disk models. At [Fe/H] , [/Fe] is higher and [Mn/Fe] is lower than in the solar neighbourhood because the SN Ia contribution is smaller in the bulge and thick disk. Simultaneously, the [(C, N, F)/Fe] ratios peak at higher metallicities; [(C, N, F)/Fe] is lower at [Fe/H] , and is slightly higher at [Fe/H] than in the solar neighbourhood. The abundance ratios of [(Na, Al, Cu, Zn)/Fe] and [(P, Cl, K, Sc)/Fe] are predicted to be higher because of the higher metallicity. Indeed, the metallicity reaches values high enough to produce these elements before the majority of SNe Ia occur. The yellow dots are the observational data of the thick disk stars, which show higher [/Fe] and [(Al, Cu)/Fe] ratios than the thin disk stars (black dots). These data are roughly consistent with our model predictions. Note that the transition metallicity where [/Fe] starts to decrease and the peak metallicity of [(C, N, F)/Fe] and [(Na, Al, Cu, Zn)/Fe] depends on the star formation and infall timescales of the system. For the bulge model, [O/Fe] starts to decrease at [Fe/H] . The transition metallicity can be increased with a much shorter timescale as in Ballero et al. (2007).
The high [/Fe] in the bulge and thick disk can also be reproduced by changing the IMF, namely, adopting a flatter IMF (see Fig. 32 of K06). In this paper we do not need to change the IMF between the solar neighbourhood and the bulge (§2.4). This is because the observational constraints of the MDF was updated by Zoccali et al. (2008) and the bulge stars are more metal-rich than in the solar neighbourhood (Fig.12). With a flatter IMF, the predicted [(Zn,Co)/Fe] ratios becomes much larger, a result that can be tested with future observations.
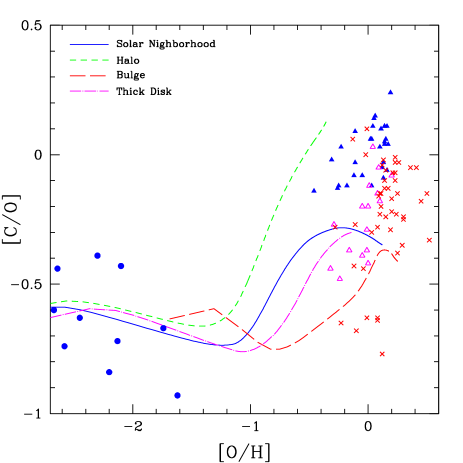
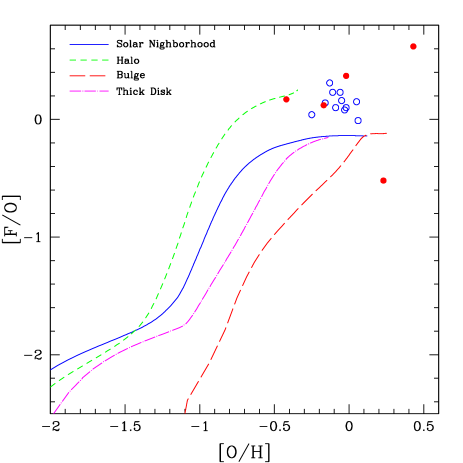
The difference in the AGB contribution is clearly seen in [(C, N, F)/O] ratios. Figure 15 shows the evolution of [C/O] against [O/H], where [C/O] shows a rapid increase at [O/H] to toward higher metallicities. At [O/H] , the [C/O] ratio is highest in the halo, followed by the solar neighbourhood, thick disk, and bulge. This is qualitatively consistent with the observations (dots) in the thin disk, thick disk, and bulge, but the very high [C/O] ratios that are observed in some stars at [O/H] cannot be reproduced by our models. Cescutti et al. (2009) showed that the [C/O] ratios could be enhanced at [O/H] if Maeder (1992) or Meynet & Maeder (2002) yields are included. Similarly, Figure 16 shows the evolution of [F/O] against [O/H], where [F/O] shows a rapid increase at [O/H] to toward higher metallicities. The present [F/O] ratio is slightly lower than the observations, perhaps indicating the need for other sources of F in the galaxy. Renda et al. (2004) showed that [F/O] could be enhanced at [O/H] if the yields of Wolf-Rayet stars are included.
McWilliam et al. (2008) showed that the [O/Mg] ratio could be changed in their bulge models if the Maeder (1992)’s yields are included. This ratio cannot be changed by the addition of AGB yields. With our yields, [O/Mg] is almost constant independent of the metallicity as shown in Fig. 9 of K06. Our model predictions are consistent with the observations of thin disk stars, but not with those of thick disk and bulge stars, although the scatter and uncertainties are quite large for the bulge stars.
Halo — If the chemical enrichment timescale is longer than in the solar neighbourhood as in our halo model (short-dashed lines), the contribution from low-mass AGB stars become significant, and thus the [(C, F)/Fe] ratios are higher at all metallicities than in the solar neighbourhood. For [N/Fe], the difference is seen only at low metallicity ([Fe/H] ) since the mass range of N production is more massive than that of C and F. The [/Fe] and [Mn/Fe] relations are the same as in the solar neighbourhood. However, the [(Na, Al, Cu, Zn)/Fe] and [(P, Cl, K, Sc)/Fe] ratios are lower because of the overall lower metallicity. Detailed elemental abundances are not available for the Galactic halo, but high [C/Fe] is seen for a significant fraction of stars in the Galactic outer halo in the SEGUE444Sloan Extension for Galactic Understanding and Exploration data (Beers, 2010).
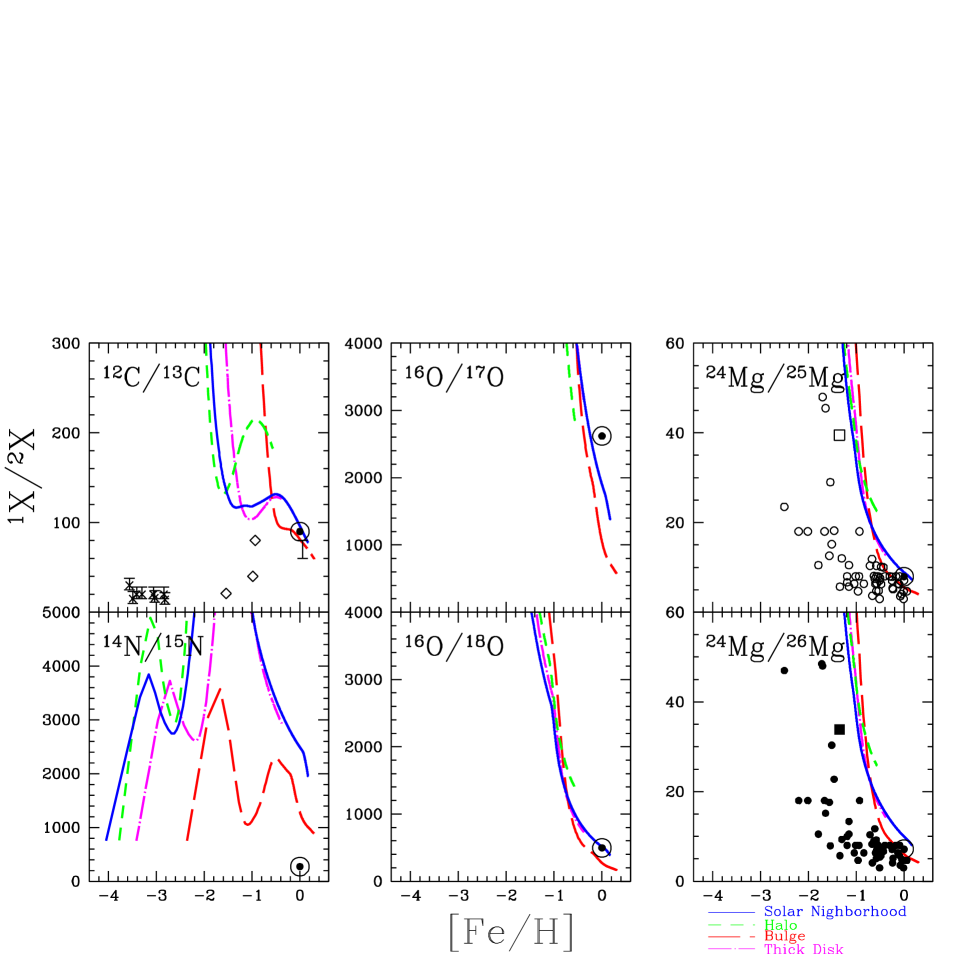
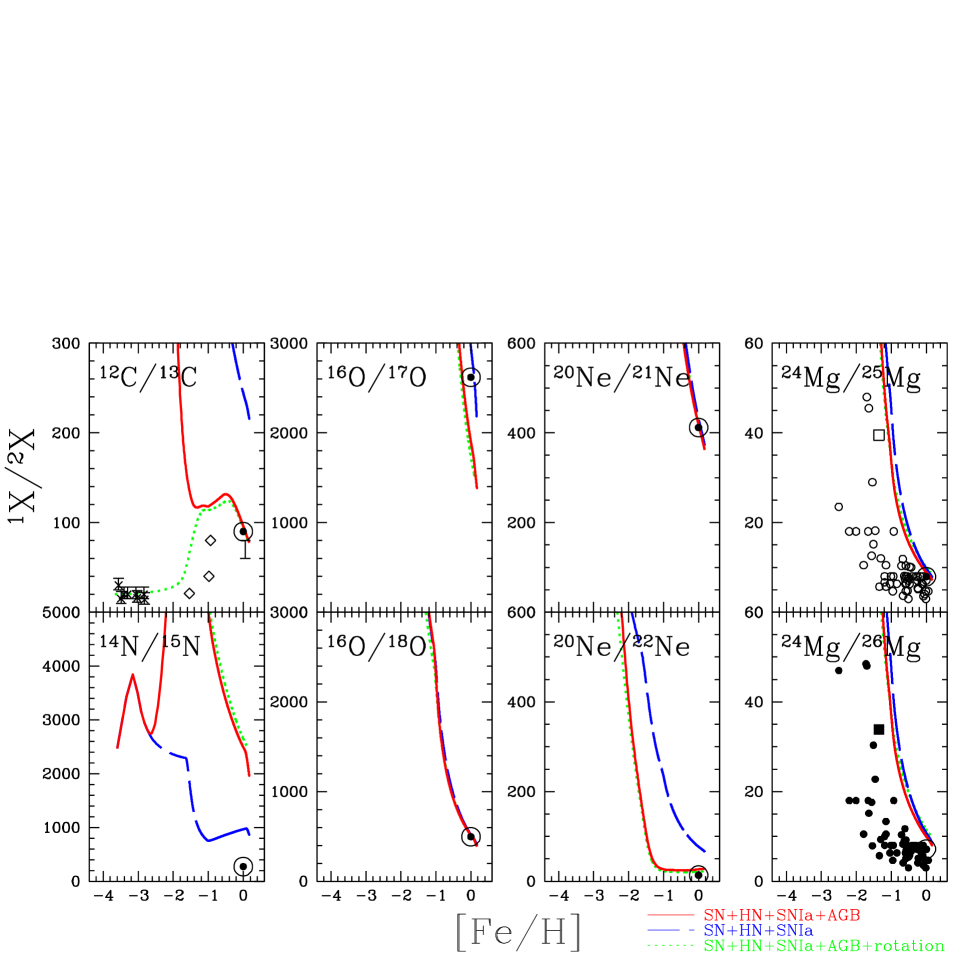
Figure 17 shows the evolution of the isotope ratios against [Fe/H] for the solar neighbourhood (solid lines). In general, core-collapse supernovae are the main producers of the major isotopes with more minor isotopes synthesized at higher metallicity (see Figs. 6-10). For this reason, the evolution of 12C/13C, 16O/17,18O, 20Ne/21,22Ne, 24Mg/25,26Mg, 28Si/29,30Si, 32S/33,34,26S, 40Ca/42,44,48Ca, 48Ti/46,47,49,50Ti, and 64Zn/66,67,68,70Zn continuously decreases toward higher metallicity. The slope changes at [Fe/H] and are due to the onset of intermediate- and low-mass AGB stars, respectively. The rapid change in the slope at [Fe/H] is caused by SNe Ia. In Table 3, we show the mass fractions of isotopes at [Fe/H] , and , corresponding to the average of metal-poor SNe II, SNe IIAGB, and SNe IIAGBSNe Ia, respectively, which can be compared with meteoric data in a future study. The results are summarized as follows.
-
•
Carbon — The 12C/13C ratio is at [Fe/H] , and decreases to at [Fe/H] because of the production of 13C from AGB stars. Then, because of the production of 12C from AGB stars, the ratio increases until [Fe/H] , and then decreases to be at [Fe/H] , which is consistent with the solar ratio of (solar symbol, AG89) and (Asplund et al., 2009, hereafter AGSS09). The isotopic fraction of 13C is 0.02%, 0.84%, 0.75%, and 1.03% at [Fe/H] and , respectively. The other dots (crosses and diamonds) show the observational data of metal-poor unevolved stars (Carretta et al., 2000; Spite et al., 2006). The low carbon isotopic values of these stars suggests that intermediate-mass AGB stars and/or rotating massive stars have contributed to galactic chemical evolution at a very low metallicity. Note that in the low-mass stellar models, non-standard extra mixing processes are not included (e.g. Nollett, Busso, & Wasserburg, 2003). These processes may occur during the first and asymptotic giant branches and result in an increase the yields of 13C (and 14N). While the effect of such processes may be minimal on the yields at solar metallicity, they may be substantial for , resulting in much smaller predicted 12C/13C ratios from the AGB models than given by the yields of Karakas (2010).
-
•
Nitrogen — Although 15N destruction by AGB stars is neglected in our models, the 14N/15N ratio at [Fe/H] is still predicted to be larger than the ratio provided by AG89 (272). At [Fe/H] , the isotopic fraction of 15N is 0.04%, which is times smaller than the solar ratio: 0.37% in AG89 and 0.23% in AGSS09. Note that the proto-solar nebula value for the 14N/15N ratio in AGSS09 is 447, a factor of 1.6 higher than the AG89 value. This is because AGSS09 adopt the Jupiter nitrogen isotope value as the proto-solar value, noting that the AG89 ratio is the terrestrial value derived from air and has likely experienced isotopic fractionation and an increase in the abundance of 15N (see Meibom et al., 2007, for more details). That our predicted nitrogen isotope value is too high is probably because the effect of novae, which likely produced a substantial fraction of the 15N in the Galaxy (Romano & Matteucci, 2003), are not included in our models. In novae, the accreted hydrogen is heated up to K, where the CNO cycle is limited by -decays rather than the proton capture rate of 14N (the hot CNO burning, Wallace & Woosley 1981). Therefore, 13C, 15N, and 17O are over-produced with respect to the solar abundances. The nucleosynthesis yields depend on the mass of the CO and ONe white dwarfs, and the mixing levels between the accreted envelope and the white dwarfs (José & Hernanz, 1998). The rate of novae in the Galaxy is estimated to be about 30 per year (José & Hernanz, 1998), but the time evolution of the rate is uncertain.
-
•
Oxygen — Both the 16O/17O and 16O/18O ratios rapidly decrease from and at [Fe/H] to and at [Fe/H] because of the metallicity dependence of massive star nucleosynthesis. The isotopic fractions are (16O:17O:18O) = (99.99, 0.0005, 0.006), (99.96, 0.006, 0.037), (99.87, 0.026, 0.109), and (99.75, 0.053, 0.194) at [Fe/H] , and , respectively. At [Fe/H]=0, the 18O fraction is consistent but 17O is too large when compared with the solar ratios, (99.76, 0.038, 0.201) in AG89 and (99.76, 0.038, 0.200) in AGSS09. 17O and 18O are mainly produced by in the H-burning layer and in the He-burning layer, respectively, and thus their abundances depend on the amount of the seed element. 18O is mainly produced by He-burning in massive stars and is slightly destroyed in AGB stars. 17O is over produced by AGB stars. The model that adopts only supernova yields (dashed line in Fig. 18) produces a 16O/17O ratio that is consistent with the solar ratio. Including the contribution from AGB stars lowers the predicted 16O/17O ratio to a value lower than the solar ratio. Note that for the majority of AGB stars in galaxies (), the 17O yield is increased with the new reaction rates (§2). The oxygen isotopic ratios may be used to put constraints on the rates of the 17O(p,)14N and 17O(p,)18F reactions in AGB nucleosynthesis models. Novae also produce some 17O (and 13C), which would worsen the situation.
-
•
Neon — The 20Ne/21Ne and 20Ne/22Ne ratios show a similar decrease as oxygen. With AGB yields, the isotopic fractions at [Fe/H]= are consistent with the solar ratio: (20Ne:21Ne:22Ne) = (96.16, 0.23, 3.61) in the model, (92.99, 0.23, 6.78) in AG89, and (92.94, 0.22, 6.83) in AGSS09. The only data for comparison is meteoritic.
-
•
Magnesium — The 24Mg/25Mg and 24Mg/26Mg ratios also show a rapid decrease from and at [Fe/H] to and at [Fe/H] because the production of the minor isotopes increases in metal-rich supernovae. The 24Mg/25Mg and 24Mg/26Mg ratios are a bit larger than the observations of stars (dots, Yong, Lambert, & Ivans, 2003; Meléndez & Cohen, 2007) and the solar ratios ( and in AG89), which suggests that AGB stars (or Wolf-Rayet stars) need to contribute more at all metallicities. The isotopic fractions are (24Mg:25Mg:26Mg) = (99.28, 0.39, 0.34), (95.60, 2.30, 2.11), (88.09, 5.77, 5.13), and (82.46, 9.28, 8.26) at [Fe/H] , and , respectively. The isotopic fractions of solar ratios are (79.03, 9.97, 10.99) in AG89 and (78.99, 10.00, 11.01) in AGSS09. In both observations, 26Mg is more abundant than 25Mg, which is the opposite both for the AGB stars and supernovae yields. In supernovae, there is a metallicity dependence on the predicted Mg isotopic ratios. 24Mg is mainly produced by the reaction 12CC and is a primary isotope. On the other hand, 25Mg and 26Mg are secondary isotopes and are significantly produced by higher metallicity stars. They are mainly produced by the following reactions: and thus their abundances depend on the amount of the seed element, 24Mg. In AGB stars, there is no such metallicity dependence. The neutron-rich Mg isotopes are produced by -captures onto 22Ne via 22Ne()25Mg and 22Ne()26Mg (Karakas & Lattanzio, 2003). The AGB yields of the neutron-rich Mg isotopes depends on the amount of 22Ne in the He-burning region, and this can have a primary component in intermediate-mass AGB stars, where the 22Ne is produced from primary nitrogen made by HBB.
-
•
Si, S, Ca, Ti, and Zn — For heavier elements most of the ratios at [Fe/H] are roughly consistent with the solar ratios, but the predictions for 29Si, 48Ca, 47Ti are smaller than the solar ratios. These may require the update of the mixing treatment and reaction rates in the supernovae calculations. For Zn, the offsets from the solar ratios are possibly caused by the under-production of 64Zn. Although neutron-rich isotopes of Zn could be produced by neutron-capture processes, 64Zn is mostly produced by the higher energy and entropy experienced during supernova explosions. In fact, if we were to set a higher fraction of hypernovae, the isotopic ratios become closer to the solar ratios.
The model dependence on the evolution of the isotope ratios is shown in Figure 18. With the contribution from AGB stars (solid lines), the 12C/13C and 20Ne/22Ne ratios become consistent with the solar ratio, and 24Mg/25,26Mg becomes slightly closer to the observations. However, as mentioned above, the 16O/17O ratio is consistent with the model without an AGB contribution (dashed lines). This is different from Timmes, Woosley, & Weaver (1995)’s results, where the 16O/17O ratio was consistent with the solar ratio without AGB yields and 18O is over-produced by supernovae. This is due to our use of updated supernova yields. For heavier elements, there is only a dex difference around [Fe/H] for the models with and without AGB yields. For 24Mg/25,26Mg, the contribution of AGB stars are larger in Fenner et al. (2003) than in our models, which may be due to differences in the adopted IMF (§2.3).
If we include rotating massive stars (dotted lines), the 12C/13C ratio becomes much closer to the observations of metal-poor stars as shown by Chiappini et al. (2008), but 16O/17O cannot be improved when comparing with the solar ratio. Note that the N and Mg yields of rotating massive stars are not included. The small difference among the models with and without rotating massive stars is caused by the difference in the IMF ( is adopted in the case with rotating massive stars instead of ).
The dependence on the star formation history is shown in Figure 19. For 12C/13C, the first decrease is due to 13C production from intermediate-mass AGB stars, the next increase is due to the 12C production from low-mass AGB stars, and the following second decrease is due to SNe Ia. These modulations appear at a higher metallicity in the bulge (long-dashed lines) and thick disk (dot-dashed lines) than in the solar neighbourhood (solid lines). On the other hand, these evolutionary changes appear at lower metallicity in the halo (short-dashed lines). In general, the ratios between the major and minor isotopes such as 24Mg/25,26Mg are smaller in the bulge and thick disk, and are larger in the halo because of the metallicity effect of supernovae. However, the 16O/17O ratio in the halo is low due to the production of 17O from low-mass AGB stars, as also seen in the high [(C, F)/Fe] abundances. Therefore, the isotopic ratios can be used as a tool to pick out the stars that form in a system with a low chemical enrichment efficiency. This may be possible in our halo, but more likely in small satellite galaxies that were accreted onto our Milky Way Galaxy. In Table 3, the mass fractions of isotopes at [Fe/H] are provided for the solar neighbourhood, halo, bulge, and thick disk models.
| 0.004 | 0.02 | 0.02 | |
| 18 | 25 | 25 | |
| 1 | 1 | 10 | |
| 17.60 | 17.72 | 17.25 | |
| 2.14 | 1.80 | 1.84 | |
| p | 7.95E+00 | 5.32E+00 | 5.32E+00 |
| d | 6.50E-14 | 2.07E-16 | 2.24E-12 |
| 3He | 1.81E-04 | 2.03E-04 | 2.03E-04 |
| 4He | 5.06E+00 | 5.35E+00 | 5.36E+00 |
| 6Li | 9.30E-17 | 9.09E-19 | 1.84E-16 |
| 7Li | 4.90E-11 | 2.55E-13 | 2.49E-10 |
| 9Be | 9.78E-19 | 3.10E-19 | 1.64E-19 |
| 10B | 6.52E-15 | 4.10E-11 | 4.10E-11 |
| 11B | 3.16E-12 | 1.70E-10 | 1.73E-10 |
| 12C | 1.58E-01 | 1.53E-01 | 1.36E-01 |
| 13C | 6.03E-04 | 2.64E-04 | 2.61E-04 |
| 14N | 1.42E-02 | 5.61E-02 | 5.62E-02 |
| 15N | 5.62E-05 | 6.85E-05 | 9.18E-05 |
| 16O | 1.55E+00 | 3.01E+00 | 2.94E+00 |
| 17O | 1.04E-04 | 9.86E-04 | 9.83E-04 |
| 18O | 1.14E-04 | 3.95E-03 | 2.29E-03 |
| 19F | 1.39E-05 | 2.43E-04 | 1.73E-04 |
| 20Ne | 1.40E-01 | 1.00E+00 | 7.37E-01 |
| 21Ne | 3.92E-04 | 2.50E-03 | 2.87E-03 |
| 22Ne | 4.02E-03 | 2.17E-02 | 1.86E-02 |
| 23Na | 4.34E-04 | 2.96E-02 | 2.03E-02 |
| 24Mg | 1.12E-01 | 1.91E-01 | 2.02E-01 |
| 25Mg | 2.80E-03 | 3.59E-02 | 2.88E-02 |
| 26Mg | 1.40E-03 | 3.04E-02 | 2.56E-02 |
| 27Al | 5.22E-03 | 3.20E-02 | 2.79E-02 |
| 28Si | 2.16E-01 | 3.43E-01 | 2.45E-01 |
| 29Si | 1.83E-03 | 6.64E-03 | 9.80E-03 |
| 30Si | 2.14E-03 | 5.01E-03 | 1.41E-02 |
| 31P | 4.82E-04 | 1.82E-03 | 2.92E-03 |
| 32S | 1.18E-01 | 1.81E-01 | 9.60E-02 |
| 33S | 2.12E-04 | 8.20E-04 | 9.77E-04 |
| 34S | 8.31E-04 | 3.34E-03 | 9.63E-03 |
| 36S | 1.23E-06 | 3.29E-05 | 3.74E-05 |
| 35Cl | 5.87E-05 | 3.63E-04 | 3.79E-04 |
| 37Cl | 2.52E-05 | 3.02E-04 | 2.16E-04 |
| 36Ar | 2.19E-02 | 2.82E-02 | 1.34E-02 |
| 38Ar | 3.48E-04 | 2.69E-03 | 3.07E-03 |
| 40Ar | 1.54E-07 | 2.99E-06 | 7.39E-06 |
| 39K | 4.17E-05 | 2.66E-04 | 1.77E-04 |
| 40K | 1.49E-08 | 5.55E-07 | 4.25E-07 |
| 41K | 5.27E-06 | 4.58E-05 | 2.04E-05 |
| 40Ca | 2.00E-02 | 1.98E-02 | 9.85E-03 |
| 42Ca | 9.76E-06 | 7.93E-05 | 7.72E-05 |
| 43Ca | 3.80E-07 | 3.66E-06 | 3.66E-06 |
| 44Ca | 1.06E-05 | 3.76E-05 | 1.01E-04 |
| 46Ca | 7.79E-08 | 1.53E-06 | 2.73E-06 |
| 48Ca | 4.01E-07 | 2.17E-06 | 2.82E-06 |
| 45Sc | 4.38E-07 | 3.69E-06 | 4.13E-06 |
| 46Ti | 4.13E-06 | 2.43E-05 | 3.22E-05 |
| 47Ti | 7.58E-07 | 4.99E-06 | 7.68E-06 |
| 48Ti | 2.49E-04 | 2.09E-04 | 1.74E-04 |
| 49Ti | 1.23E-05 | 1.05E-05 | 1.01E-05 |
| 50Ti | 1.04E-06 | 1.51E-05 | 1.32E-05 |
| 50V | 1.86E-08 | 9.94E-08 | 2.07E-07 |
| 51V | 1.57E-05 | 1.20E-05 | 1.80E-05 |
| 50Cr | 5.15E-05 | 5.04E-05 | 8.15E-05 |
| 52Cr | 3.89E-03 | 3.50E-03 | 1.26E-03 |
| 53Cr | 2.40E-04 | 9.95E-05 | 1.06E-04 |
| 54Cr | 2.75E-06 | 3.00E-05 | 2.70E-05 |
| 0.004 | 0.02 | 0.02 | |
| 18 | 25 | 25 | |
| 1 | 1 | 10 | |
| 55Mn | 7.21E-04 | 3.47E-04 | 4.27E-04 |
| 54Fe | 5.04E-03 | 2.63E-03 | 4.14E-03 |
| 56Fe | 7.32E-02 | 8.46E-02 | 1.15E-01 |
| 57Fe | 6.27E-04 | 8.79E-04 | 2.97E-03 |
| 58Fe | 7.52E-05 | 8.91E-04 | 8.41E-04 |
| 59Co | 3.58E-05 | 4.01E-04 | 5.08E-04 |
| 58Ni | 5.50E-04 | 7.74E-04 | 1.25E-03 |
| 60Ni | 1.03E-04 | 9.14E-04 | 3.68E-03 |
| 61Ni | 1.48E-05 | 2.05E-04 | 5.36E-04 |
| 62Ni | 5.33E-05 | 5.77E-04 | 7.22E-04 |
| 64Ni | 4.18E-05 | 8.40E-04 | 7.16E-04 |
| 63Cu | 1.37E-05 | 3.65E-04 | 2.89E-04 |
| 65Cu | 1.32E-05 | 2.20E-04 | 2.05E-04 |
| 64Zn | 7.19E-06 | 5.65E-05 | 2.88E-04 |
| 66Zn | 2.35E-05 | 3.34E-04 | 3.47E-04 |
| 67Zn | 3.16E-06 | 8.10E-05 | 7.26E-05 |
| 68Zn | 2.37E-05 | 4.63E-04 | 4.24E-04 |
| 70Zn | 4.95E-07 | 1.14E-05 | 1.94E-05 |
| 69Ga | 2.30E-06 | 5.77E-05 | 5.19E-05 |
| 71Ga | 2.53E-06 | 3.36E-05 | 3.61E-05 |
| 70Ge | 3.08E-06 | 7.28E-05 | 6.25E-05 |
| 72Ge | 5.07E-06 | 1.19E-04 | 1.07E-04 |
| 73Ge | 6.71E-07 | 2.73E-05 | 2.32E-05 |
| 74Ge | 9.69E-06 | 3.34E-04 | 2.87E-04 |
4 Conclusions
We have presented evolution of isotope ratios of elemental abundances (from C to Zn) in the solar neighbourhood, bulge, halo, and thick disk, using chemical evolution models with the updated yields of AGB stars and core-collapse supernovae. Although the ejected mass of heavy elements is much smaller for AGB stars than for supernovae, the AGB yields of C, N, and F are comparable to those of supernovae. When examining the AGB yields, the isotopes of 12C and 19F are mainly produced in low-mass stars (), whereas 13C, 14N, 22Ne, 25Mg, and 26Mg are mainly produced in intermediate-mass () stars. By including AGB yields, the predicted ratios of [C/Fe], [N/Fe], 12C/13C, and 20Ne/22Ne at [Fe/H] are much improved compared with the observed ratios in the solar neighbourhood. For supernovae, minor isotope production increases with increasing metallicity. Therefore, the [(C, F)/Fe] and isotope ratios can be used as a cosmic clock along with the [/Fe] ratio.
Because of the effect of the progenitor mass and metallicity, the evolutionary history of elements varies for environments with different star formation histories. In the bulge and thick disk, the star formation timescale is shorter than in the solar neighbourhood, and [/Fe] is higher and [Mn/Fe] is lower because of a lower contribution from SNe Ia. In contrast, the [(Na, Al, P, Cl, K, Sc, Cu, Zn)/Fe] ratios are higher because of the effect of metallicity. In other words, from these elemental abundance ratios, it is possible to select metal-rich stars ([Fe/H] ) that formed in the early Universe as a result of rapid star formation.
In the halo, the chemical enrichment timescale is longer than in the solar neighbourhood, and [(C, F)/Fe] and 12C/13C are higher because of a stronger contribution from low-mass AGB stars. The [/Fe] and [Mn/Fe] relations are the same as in the solar neighbourhood, but [(Na, Al, P, Cl, K, Sc, Cu, Zn)/Fe] are lower and other isotope ratios such as 16O/18O and 24Mg/25,26Mg are larger because of the low metallicity. Not only from elemental abundance ratios, but also from isotopic ratios, it is possible to select the stars that formed in a system with a low chemical enrichment efficiency.
Isotopic ratios provide useful information to improve theoretical predictions in terms of reaction rates, nucleosynthesis, and the modelling of convective mixing. The under-production of 15N suggests the contribution from novae, the over-production of 17O requires the updating of reaction rates that feed into AGB yields, and the under-production of 29Si, 48Ca, 47Ti and possibly 64Zn may require the updating of supernova models. The observational constraints at low-metallicity are particularly important. However, it is not easy to estimate isotopic ratios from observations of stellar spectra. To detect the small line shifts between isotopes, very high quality data is required. The next generation of large telescopes (e.g., the Giant Magellan Telescope and the European Extremely Large Telescope) will be constrained by the same problems but will be able to measure isotopic ratios out to larger distances. It will then be possible to study the evolution of isotopic ratios in the local neighbourhood of our Milky Way Galaxy including in dwarf spheroidal galaxies. These data will help to put important constraints on the star formation and chemical enrichment histories of such systems, and which may lead to the verification of the hierarchical clustering in CDM cosmology using chemodynamical simulations.
Acknowledgements
We would like to thank K. Nomoto, D. Yong, M. Lugaro, and P. Gil-Pons for fruitful discussions. This work was supported by the NCI National Facility at the Australian National University and the Institute for the Physics and Mathematics of the Universe, University of Tokyo.
| Model | Solar | Solar | Solar | Solar | Halo | Bulge | Thick |
|---|---|---|---|---|---|---|---|
| -2.6 | -1.1 | -0.5 | 0 | -0.5 | -0.5 | -0.5 | |
| p | 7.60E-01 | 7.53E-01 | 7.44E-01 | 7.29E-01 | 7.34E-01 | 7.38E-01 | 7.41E-01 |
| d | 5.06E-05 | 4.96E-05 | 4.82E-05 | 4.61E-05 | 4.90E-05 | 4.72E-05 | 4.78E-05 |
| 3He | 2.28E-05 | 2.34E-05 | 2.88E-05 | 4.28E-05 | 9.10E-05 | 2.22E-05 | 2.67E-05 |
| 4He | 2.40E-01 | 2.43E-01 | 2.47E-01 | 2.53E-01 | 2.56E-01 | 2.49E-01 | 2.48E-01 |
| 6Li | 1.37E-13 | 1.34E-13 | 1.30E-13 | 1.25E-13 | 1.29E-13 | 1.28E-13 | 1.29E-13 |
| 7Li | 6.38E-10 | 6.54E-10 | 6.11E-10 | 5.83E-10 | 6.64E-10 | 6.09E-10 | 6.13E-10 |
| 9Be | 1.31E-17 | 1.30E-17 | 1.29E-17 | 1.29E-17 | 1.27E-17 | 1.29E-17 | 1.29E-17 |
| 10B | 6.64E-17 | 1.81E-14 | 1.27E-13 | 4.19E-13 | 7.36E-14 | 2.54E-13 | 1.59E-13 |
| 11B | 3.54E-16 | 2.29E-12 | 5.67E-12 | 5.96E-12 | 3.88E-12 | 6.68E-12 | 6.17E-12 |
| 12C | 5.75E-06 | 2.85E-04 | 8.55E-04 | 1.49E-03 | 2.02E-03 | 7.30E-04 | 9.42E-04 |
| 13C | 1.37E-09 | 2.61E-06 | 7.04E-06 | 1.68E-05 | 1.28E-05 | 7.63E-06 | 7.98E-06 |
| 14N | 1.08E-07 | 1.12E-04 | 3.20E-04 | 6.51E-04 | 3.69E-04 | 3.98E-04 | 3.65E-04 |
| 15N | 4.23E-11 | 2.15E-08 | 1.02E-07 | 2.80E-07 | 7.95E-08 | 1.86E-07 | 1.24E-07 |
| 16O | 7.93E-05 | 2.23E-03 | 5.18E-03 | 9.73E-03 | 4.45E-03 | 7.82E-03 | 6.09E-03 |
| 17O | 4.23E-10 | 1.41E-07 | 1.44E-06 | 5.44E-06 | 1.88E-06 | 2.31E-06 | 1.70E-06 |
| 18O | 5.52E-09 | 9.21E-07 | 6.36E-06 | 2.13E-05 | 3.81E-06 | 1.34E-05 | 8.07E-06 |
| 19F | 2.10E-11 | 4.34E-08 | 1.51E-07 | 2.99E-07 | 3.49E-07 | 1.19E-07 | 1.72E-07 |
| 20Ne | 1.25E-05 | 4.53E-04 | 1.21E-03 | 2.46E-03 | 9.34E-04 | 1.90E-03 | 1.43E-03 |
| 21Ne | 2.73E-09 | 3.53E-07 | 1.98E-06 | 6.18E-06 | 1.25E-06 | 3.93E-06 | 2.47E-06 |
| 22Ne | 1.09E-08 | 1.71E-05 | 5.39E-05 | 1.01E-04 | 1.08E-04 | 3.20E-05 | 6.01E-05 |
| 23Na | 5.23E-08 | 4.76E-06 | 2.37E-05 | 7.00E-05 | 1.59E-05 | 4.46E-05 | 2.92E-05 |
| 24Mg | 5.77E-06 | 1.68E-04 | 3.57E-04 | 6.32E-04 | 3.17E-04 | 5.23E-04 | 4.19E-04 |
| 25Mg | 2.34E-08 | 4.20E-06 | 2.41E-05 | 7.40E-05 | 1.54E-05 | 4.65E-05 | 2.99E-05 |
| 26Mg | 2.13E-08 | 4.01E-06 | 2.23E-05 | 6.86E-05 | 1.40E-05 | 4.36E-05 | 2.77E-05 |
| 27Al | 1.60E-07 | 8.45E-06 | 3.14E-05 | 8.39E-05 | 2.18E-05 | 5.65E-05 | 3.82E-05 |
| 28Si | 7.49E-06 | 2.07E-04 | 4.96E-04 | 9.67E-04 | 4.35E-04 | 6.82E-04 | 5.64E-04 |
| 29Si | 3.79E-08 | 2.07E-06 | 8.42E-06 | 2.37E-05 | 5.79E-06 | 1.52E-05 | 1.02E-05 |
| 30Si | 4.45E-08 | 2.48E-06 | 9.89E-06 | 2.78E-05 | 6.98E-06 | 1.74E-05 | 1.19E-05 |
| 31P | 1.55E-08 | 6.46E-07 | 2.53E-06 | 7.32E-06 | 1.83E-06 | 4.56E-06 | 3.07E-06 |
| 32S | 2.93E-06 | 8.61E-05 | 2.16E-04 | 4.43E-04 | 1.88E-04 | 2.95E-04 | 2.45E-04 |
| 33S | 8.42E-09 | 3.37E-07 | 1.10E-06 | 2.79E-06 | 8.70E-07 | 1.69E-06 | 1.27E-06 |
| 34S | 2.06E-08 | 1.43E-06 | 6.53E-06 | 1.91E-05 | 4.49E-06 | 1.14E-05 | 7.80E-06 |
| 36S | 6.34E-12 | 2.70E-09 | 2.70E-08 | 9.63E-08 | 1.48E-08 | 5.82E-08 | 3.43E-08 |
| 35Cl | 2.41E-09 | 9.94E-08 | 4.03E-07 | 1.18E-06 | 2.97E-07 | 6.95E-07 | 4.81E-07 |
| 37Cl | 8.51E-10 | 3.80E-08 | 2.08E-07 | 6.56E-07 | 1.35E-07 | 3.95E-07 | 2.54E-07 |
| 36Ar | 4.26E-07 | 1.33E-05 | 3.40E-05 | 7.03E-05 | 2.95E-05 | 4.57E-05 | 3.83E-05 |
| 38Ar | 8.92E-09 | 5.49E-07 | 2.56E-06 | 7.53E-06 | 1.80E-06 | 4.31E-06 | 3.01E-06 |
| 40Ar | 1.41E-12 | 5.20E-10 | 3.78E-09 | 1.25E-08 | 2.15E-09 | 7.75E-09 | 4.74E-09 |
| 39K | 1.20E-09 | 5.39E-08 | 2.10E-07 | 5.79E-07 | 1.56E-07 | 3.40E-07 | 2.45E-07 |
| 40K | 2.87E-13 | 2.85E-11 | 2.70E-10 | 9.81E-10 | 1.52E-10 | 5.87E-10 | 3.45E-10 |
| 41K | 2.08E-10 | 6.33E-09 | 2.63E-08 | 7.64E-08 | 1.90E-08 | 4.61E-08 | 3.15E-08 |
| 40Ca | 3.36E-07 | 1.07E-05 | 2.74E-05 | 5.57E-05 | 2.38E-05 | 3.63E-05 | 3.07E-05 |
| 42Ca | 2.18E-10 | 1.35E-08 | 6.52E-08 | 1.98E-07 | 4.70E-08 | 1.08E-07 | 7.60E-08 |
| 43Ca | 5.41E-12 | 6.54E-10 | 3.68E-09 | 1.15E-08 | 2.25E-09 | 7.20E-09 | 4.56E-09 |
| 44Ca | 1.51E-09 | 4.75E-08 | 1.42E-07 | 3.44E-07 | 1.09E-07 | 2.39E-07 | 1.70E-07 |
| 46Ca | 6.61E-13 | 1.45E-10 | 1.25E-09 | 4.38E-09 | 7.04E-10 | 2.67E-09 | 1.59E-09 |
| 48Ca | 2.02E-12 | 4.91E-10 | 3.54E-09 | 1.18E-08 | 2.04E-09 | 7.24E-09 | 4.45E-09 |
| 45Sc | 8.32E-12 | 5.67E-10 | 3.06E-09 | 9.54E-09 | 1.93E-09 | 5.93E-09 | 3.78E-09 |
| 46Ti | 1.96E-10 | 8.32E-09 | 3.18E-08 | 9.00E-08 | 2.48E-08 | 5.03E-08 | 3.68E-08 |
| 47Ti | 2.42E-10 | 5.89E-09 | 1.53E-08 | 3.64E-08 | 1.29E-08 | 2.58E-08 | 1.86E-08 |
| 48Ti | 4.40E-09 | 1.60E-07 | 4.54E-07 | 1.03E-06 | 3.79E-07 | 6.43E-07 | 5.16E-07 |
| 49Ti | 1.51E-10 | 6.47E-09 | 2.24E-08 | 5.87E-08 | 1.85E-08 | 3.09E-08 | 2.49E-08 |
| 50Ti | 6.55E-12 | 1.55E-09 | 1.36E-08 | 4.98E-08 | 9.71E-09 | 2.30E-08 | 1.57E-08 |
| 50V | 2.08E-13 | 2.26E-11 | 1.29E-10 | 4.15E-10 | 8.01E-11 | 2.56E-10 | 1.60E-10 |
| 51V | 5.35E-10 | 1.61E-08 | 5.12E-08 | 1.37E-07 | 4.68E-08 | 6.50E-08 | 5.57E-08 |
| 50Cr | 1.07E-09 | 4.00E-08 | 1.68E-07 | 5.23E-07 | 1.58E-07 | 1.86E-07 | 1.73E-07 |
| 52Cr | 5.05E-08 | 1.90E-06 | 5.66E-06 | 1.35E-05 | 5.06E-06 | 6.86E-06 | 6.10E-06 |
| 53Cr | 2.96E-09 | 1.18E-07 | 4.54E-07 | 1.36E-06 | 4.41E-07 | 4.51E-07 | 4.55E-07 |
| 54Cr | 1.78E-11 | 3.62E-09 | 6.18E-08 | 2.73E-07 | 6.43E-08 | 5.08E-08 | 5.63E-08 |
| 55Mn | 8.33E-09 | 3.54E-07 | 2.61E-06 | 1.04E-05 | 2.91E-06 | 1.59E-06 | 2.28E-06 |
| Model | Solar | Solar | Solar | Solar | Halo | Bulge | Thick |
|---|---|---|---|---|---|---|---|
| -2.6 | -1.1 | -0.5 | 0 | -0.5 | -0.5 | -0.5 | |
| 54Fe | 7.24E-08 | 2.88E-06 | 2.81E-05 | 1.21E-04 | 3.33E-05 | 1.24E-05 | 2.31E-05 |
| 56Fe | 2.92E-06 | 9.63E-05 | 3.62E-04 | 1.11E-03 | 3.57E-04 | 3.79E-04 | 3.69E-04 |
| 57Fe | 4.58E-08 | 1.65E-06 | 9.97E-06 | 3.78E-05 | 1.05E-05 | 8.41E-06 | 9.41E-06 |
| 58Fe | 5.82E-10 | 1.35E-07 | 1.10E-06 | 3.75E-06 | 8.31E-07 | 1.62E-06 | 1.24E-06 |
| 59Co | 6.10E-09 | 2.03E-07 | 8.70E-07 | 2.66E-06 | 7.72E-07 | 1.11E-06 | 9.43E-07 |
| 58Ni | 2.10E-08 | 7.49E-07 | 2.80E-05 | 1.38E-04 | 3.58E-05 | 5.95E-06 | 2.08E-05 |
| 60Ni | 7.33E-08 | 2.25E-06 | 7.93E-06 | 2.33E-05 | 7.52E-06 | 9.44E-06 | 8.42E-06 |
| 61Ni | 1.38E-09 | 1.20E-07 | 5.77E-07 | 1.69E-06 | 4.80E-07 | 7.97E-07 | 6.56E-07 |
| 62Ni | 1.75E-09 | 1.31E-07 | 1.20E-06 | 4.79E-06 | 1.08E-06 | 1.45E-06 | 1.22E-06 |
| 64Ni | 3.00E-10 | 6.74E-08 | 4.93E-07 | 1.65E-06 | 2.82E-07 | 1.03E-06 | 6.21E-07 |
| 63Cu | 2.71E-10 | 2.53E-08 | 1.80E-07 | 6.05E-07 | 1.05E-07 | 3.75E-07 | 2.27E-07 |
| 65Cu | 1.22E-10 | 2.48E-08 | 1.52E-07 | 4.80E-07 | 8.94E-08 | 3.06E-07 | 1.90E-07 |
| 64Zn | 5.71E-09 | 1.57E-07 | 3.69E-07 | 7.08E-07 | 3.12E-07 | 5.57E-07 | 4.34E-07 |
| 66Zn | 2.49E-10 | 4.32E-08 | 2.65E-07 | 8.42E-07 | 1.59E-07 | 5.23E-07 | 3.28E-07 |
| 67Zn | 2.33E-11 | 6.23E-09 | 5.10E-08 | 1.75E-07 | 2.86E-08 | 1.08E-07 | 6.45E-08 |
| 68Zn | 1.53E-10 | 3.94E-08 | 3.11E-07 | 1.05E-06 | 1.75E-07 | 6.55E-07 | 3.93E-07 |
| 70Zn | 1.03E-12 | 3.72E-10 | 7.89E-09 | 3.14E-08 | 4.11E-09 | 1.84E-08 | 1.03E-08 |
| 69Ga | 1.90E-11 | 5.71E-09 | 3.84E-08 | 1.23E-07 | 2.20E-08 | 7.81E-08 | 4.80E-08 |
| 71Ga | 1.71E-11 | 4.43E-09 | 2.90E-08 | 9.30E-08 | 1.68E-08 | 5.90E-08 | 3.63E-08 |
| 70Ge | 3.31E-11 | 8.59E-09 | 5.63E-08 | 1.80E-07 | 3.25E-08 | 1.14E-07 | 7.04E-08 |
| 72Ge | 4.03E-11 | 1.20E-08 | 8.95E-08 | 2.98E-07 | 5.06E-08 | 1.86E-07 | 1.13E-07 |
| 73Ge | 4.43E-12 | 1.93E-09 | 1.90E-08 | 6.75E-08 | 1.04E-08 | 4.12E-08 | 2.42E-08 |
| 74Ge | 7.76E-11 | 3.09E-08 | 2.75E-07 | 9.54E-07 | 1.52E-07 | 5.88E-07 | 3.49E-07 |
References
- Abia et al. (2010) Abia, C., et al. 2010, ApJ, 715, L94
- Anders & Grevesse (1989) Anders, E., & Grevesse, N. 1989, Geochimica et Cosmochimica Acta, 53, 197 (AG89)
- Anders & Zinner (1993) Anders, E., & Zinner, E. 1993, Meteoritics, 28, 490
- Arnett (1996) Arnett, W. D. 1996, Supernovae and Nucleosynthesis (Princeton Univ. Press)
- Asplund et al. (2009) Asplund, M., Grevesse, N., Sauval, A. J., & Scott, P. 2009, ARA&A, 47, 481 (AGSS09)
- Ballero et al. (2007) Ballero, S. K., Matteucci, F., Origlia, L., & Rich, R. M. 2007, A&A, 467, 123
- Beers (2010) Beers, T. C. 2010, talk at the conference on The Chemical Enrichment of the Milky Way Galaxy, at Ringberg Castle, Germany
- Beers & Christlieb (2005) Beers, T. C., & Christlieb, N. 2005, ARA&A, 43, 531
- Bensby & Feltzing (2006) Bensby, T., & Feltzing, S. 2006, MNRAS, 367, 1181
- Bensby et al. (2004) Bensby, T., Feltzing, S., & Lundström, I. 2004, A&A, 421, 969
- Bergemann & Gehren (2008) Bergemann, M., & Gehren, T. 2008, A&A, 492, 823
- (12) Busso, M., Gallino, R., & Wasserburg, G. J. 1999, ARA&A, 37, 239
- Bruenn et al. (2009) Bruenn, S. W., Mezzacappa, A., Hix, W. R., Blondin, J. M., Marronetti, P., Messer, O. E. B., Dirk, C. J., & Yoshida, S. 2009, AIP Conference Proceedings, Vol. 1111, p. 593
- Chabrier (2003) Chabrier, G. 2003, PASA, 115, 763
- Campbell & Lattanzio (2008) Campbell, S. W., & Lattanzio, J. C. 2008, A&A, 490, 769
- Carretta et al. (2000) Carretta, E., Gratton, R. G., & Sneden, C. 2000, A&A, 356, 238
- Cayrel et al. (2004) Cayrel, R., et al. 2004, A&A, 416, 1117
- Cescutti et al. (2008) Cescutti, G., Matteucci, F., Lanfranchi, G. A., & McWilliam, A. 2008, A&A, 491, 401
- Cescutti et al. (2009) Cescutti, G., Matteucci, F., McWilliam, A., & Chiappini, C. 2009, A&A, 505, 605
- Chavez & Lambert (2009) Chavez, J., & Lambert, D. L. 2009, ApJ, 699, 1906
- Chiappini et al. (2008) Chiappini, C., Ekström, S., Meynet, G., Hirschi, R., Maeder, A., & Charbonnel, C. 2008, A&A, 479, L9
- Chiappini et al. (2006) Chiappini, C., Hirschi, R., Meynet, G., Ekström, Maeder, A., & Matteucci, F. 2006, A&A, 449, L27
- Chiba & Yoshii (1998) Chiba, M., & Yoshii, Y. 1998, AJ, 115, 168
- Cottrell & Da Costa (1981) Cottrell, P. L., & Da Costa, G. S. 1981, ApJ, 245, 79
- Cunha et al. (2003) Cunha, K., Smith, V. V., Lambert, D. L., & Hinkle, K. H. 2003, AJ, 126, 1305
- Cunha, Smith, & Gibson (2008) Cunha, K., Smith, V. V., & Gibson, B. K. 2008, ApJ, 679, L17
- Edvardsson et al. (1993) Edvardsson, B., Andersen, J., Gustafsson, B., Lambert, D. L., Nissen, P. E., & Tomkin, J. 1993, A&A, 275, 101
- Feltzing, Fohlman, & Bensby (2007) Feltzing, S., Fohlman, M., & Bensby, T. 2007, A&A, 467, 665
- Fenner et al. (2003) Fenner, Y., Gibson, B. K., Lee, H.-c., Karakas, A. I., Lattanzio, J. C., Chieffi, A., Limongi, M., & Yong, D. 2003, PASA, 20, 340
- Fenner et al. (2004) Fenner, Y., Campbell, S., Karakas, A. I., Lattanzio, J. C., & Gibson, B. K. 2004, MNRAS, 353, 789
- Gallagher et al. (2010) Gallagher, A. J., Ryan, S. G., García Pérez, A. E., & Aoki, W. 2010, A&A, 523, 24
- Gil-Pons et al. (2007) Gil-Pons, P., Gutiérrez, J., & García-Berro, E. 2007, A&A, 464, 667
- Gratton et al. (2003) Gratton, R. G., et al. 2003, A&A, 404, 187
- Herwig (2005) Herwig, F. 2005, ARA&A, 43, 435
- Hirschi (2007) Hirschi, R. 2007, A&A, 461, 571
- Hughes et al. (2008) Hughes, G. L., Gibson, B. L., Carigi, L., Sánchez-Blázquez, Chavez, J. M., & Lambert, D. L. 2008, MNRAS, 390, 1710
- Iwamoto & Saio (1999) Iwamoto, N., & Saio, H. 1999, ApJ, 521, 297
- Iwamoto et al. (1999) Iwamoto, K., Brachwitz, F., Nomoto, K., Kishimoto, N., Umeda, H., Hix, W. R., & Thielemann, F.-K. 1999, ApJS, 125, 439
- Izzard et al. (2009) Izzard, R. G., Glebbeek, E., Stancliffe, R. J., & Pols, O. R. 2009, A&A, 508, 1359
- Johnson (2002) Johnson, J. A. 2002, ApJS, 139, 219
- Jorissen, Smith, & Lambert (1992) Jorissen, A., Smith, V. V., & Lambert, D. L. 1992, A&A, 261, 164
- José & Hernanz (1998) José, J., & Hernanz, M. 1998, ApJ, 494, 680
- Karakas (2010) Karakas, A. I. 2010, MNRAS, 403, 1413
- Karakas & Lattanzio (2003) Karakas, A. I., & Lattanzio, J. C. 2003, PASA, 20, 279
- Karakas & Lattanzio (2007) Karakas, A. I., & Lattanzio, J. C. 2007, PASA, 24, 103
- Karakas et al. (2002) Karakas, A. I., Lattanzio, J. C., & Pols, O. R. 2002, PASA, 19, 515
- Karakas et al. (2008) Karakas, A. I., Lee, H. Y., Lugaro, M., Görres, J., & Wiescher, M. 2008, ApJ, 676, 1254
- Karakas et al. (2006) Karakas, A. I., Lugaro, M., Wiescher, M., Goerres, J., & Ugalde, C. 2006, ApJ, 643, 471
- Karakas et al. (2009) Karakas, A. I., van Raai, M. A., Lugaro, M., Sterling, N. C., & Dinerstein, H. L. 2009, ApJ, 690, 1130
- Kitaura, Janka, & Hillebrandt (2006) Kitaura, F. S., Janka, H.-Th., & Hillebrandt, W. 2006, A&A, 450, 345
- Kobayashi & Nakasato (2010) Kobayashi, C., & Nakasato, N. 2010, ApJ, 729, 16 (KN11)
- Kobayashi & Nomoto (2009) Kobayashi, C., & Nomoto, K. 2009, ApJ, 707, 1466 (KN09)
- Kobayashi, Tominaga, & Nomoto (2010) Kobayashi, C., Tominaga, N., & Nomoto, K. 2010, ApJ, in press, arXiv:1101.1227
- Kobayashi, Tsujimoto & Nomoto (2000) Kobayashi, C., Tsujimoto, T., & Nomoto, K. 2000, ApJ, 539, 26 (K00)
- Kobayashi et al. (1998) Kobayashi, C., Tsujimoto, T., Nomoto, K., Hachisu, I, & Kato, M. 1998, ApJ, 503, L155 (K98)
- Kobayashi et al. (2006) Kobayashi, C., Umeda, H., Nomoto, K., Tominaga, N., & Ohkubo, T. 2006, ApJ, 653, 1145 (K06)
- Kodama & Arimoto (1997) Kodama, T., & Arimoto, N. 1997, A&A, 320, 41
- Komiya et al. (2007) Komiya, Y., Suda, T., Minaguchi, H., Shigeyama, T., Aoki, W., & Fujimoto, M. Y., 2007 ApJ, 658, 367
- Kroupa (2008) Kroupa, P. 2008, ASP Conference Series, 390, 3
- Lecureur et al. (2007) Lecureur, A., et al. 2007, A&A, 465, 799
- Lugaro (1999) Lugaro, M., Zinner, E., Gallino, R., & Amari, S. 1999, ApJ, 527, 369
- Lugaro et al. (2008) Lugaro, M., de Mink, S. E., Izzard, R. G., Campbell, S. W., Karakas, A. I., Cristallo, S., Pols, O. R., Lattanzio, J. C., Straniero, O., Gallino, R., & Beers, T. C. 2008, A&A, 484, 27
- Lugaro et al. (2004) Lugaro, M., Ugalde, C., Karakas, A. I., Görres, J., Wiescher, M., Lattanzio, J. C., & Cannon, R. C. 2004, ApJ, 615, 934
- Maeda & Nomoto (2003) Maeda, K., & Nomoto, K. 2003, ApJ, 598, 1163
- Maeder (1992) Maeder, A. 1992, A&A, 264, 105
- Mannucci et al. (2006) Mannucci, F., Della Valle, M., & Panagia, N. 2006, MNRAS, 370, 773
- Mannucci et al. (2005) Mannucci, F. et al. 2005, A&A, 433, 807
- Marek & Janka (2009) Marek, A., & Janka, H.-Th. 2009, ApJ, 694, 664
- Mashonkina et al. (2010) Mashonkina, L., Christlieb, N., Barklem, P. S., Hill, V., Beers, T. C., & Velichko, A. 2010, A&A, 516, 46
- Matteucci (1997) Matteucci, F. 1997, in ASP Conference Series, Vol. 126, From Quantum Fluctuations to Cosmological Structures, p.495
- Matteucci (2001) Matteucci, F. 2001, The Chemical Evolution of the Galaxy (Kluwer Academic Pub.)
- Matteucci & Brocato (1990) Matteucci, F., & Brocato, E. 1990, ApJ, 365, 539
- McWilliam et al. (2008) McWilliam, A., Matteucci, F., Ballero, S., Rich, R. M., Fulbright, J. P., & Cescutti, G. 2008, ApJ, 136, 367
- Meibom et al. (2007) Meibom, A., Krot, A. N., Robert, F., Mostefaoui, S., Russell, S. S., Petaev, M. I., & Gounelle, M., 2007, ApJ, 656, L33
- Meléndez & Cohen (2007) Meléndez, J., & Cohen, J. G. 2007, ApJ, 659, L25
- Meynet & Maeder (2002) Meynet, G., & Maeder, A. 2002, A&A, 390, 561
- Miller & Scalo (1979) Miller, G. E. & Scalo, J. M. 1979, ApJS, 41,513
- Nissen et al. (2007) Nissen, P. E., Akerman, C., Asplund, M., Fabbian, D., Kerber, F., Käufl, H. U., & Pettini, M. 2007, A&A, 469, 319
- Nittler et al. (2008) Nittler, L. R., Alexander, C. M. O’D., Gallino, R., Hoppe, P., Nguyen, A. N., Stadermann, F. J., & Zinner, E. K. 2008, ApJ, 682, 1450
- Nittler (2009) Nittler, L. R. 2009, PASA, 26, 271
- Nomoto (1982) Nomoto, K. 1982, ApJ, 253, 798
- Nomoto (1984) Nomoto, K. 1984, ApJ, 277, 791
- Nomoto et al. (1997) Nomoto, K., et al. 1997, Nuclear Physics, A621, 467c
- Nomoto et al. (2006) Nomoto, K., Tominaga, N., Umeda, H., Kobayashi, C, & Maeda, K. 2006, Nuclear Physics A, 777, 424
- Nomoto & Kondo (1991) Nomoto, K., & Kondo, Y. 1991, ApJ, 367, L19
- Nollett, Busso, & Wasserburg (2003) Nollett, K. M., Busso, M., & Wasserburg, G. J. 2003, ApJ, 582, 1036
- Pagel (1997) Pagel, B. E. J. 1997, Nucleosynthesis and Chemical Evolution of Galaxies (Cambridge Unv. Press)
- Prantzos, Vangioni-Flam, & Chauveau (1994) Prantzos, N., Vangioni-Flam, E., & Chauveau, S. 1994, A&A, 285, 132
- Pols et al. (2009) Pols, O. R., Izzard, R. G., Glebbeek, E., & Stancliffe, R. J. 2009, PASA, 26, 327
- Renda et al. (2004) Renda, A., et al. 2004, MNRAS, 354, 575
- Renzini (2008) Renzini, A. 2008, MNRAS, 391, 354
- Romano et al. (2010) Romano, D., Karakas, A. I., Tosi, M., & Matteucci, F. 2010, A&A, 522, 32 (R10)
- Russell & Dopita (1992) Russell, S. C., & Dopita, M. A. 1992, ApJ, 384, 508
- Primas et al. (2000) Primas, F., Reimers, D., Wisotzki, L., Reetz, J., Gehren, T., & Beers, T. C. 2000, in The First Stars, ed. A. Weiss, T. Abel, &, V. Hill (Berlin:Springer), 51
- Romano & Matteucci (2003) Romano, D., & Matteucci, F. 2003, MNRAS, 342, 185
- Saito et al. (2009) Saito, Y., Takada-Hidai, M., Honda, S., & Takeda, Y. 2009, PASJ, 61, 549
- Salpeter (1955) Salpeter, E. E. 1955, ApJ, 121, 161
- Siess (2007) Siess, L. 2007, A&A, 476, 893
- Smith & Lambert (1990) Smith, V. V., & Lambert, D. L. 1990, ApJS, 72, 387
- Sneden et al. (2002) Sneden, C., Cowan, J. J., Lawler, J. E., Burles, S., Beers, T. C., & Fuller, G. M. 2002, ApJ, 566, 25
- Spite et al. (2006) Spite, M., et al. 2006, A&A, 455, 291
- Suda et al. (2004) Suda, T., Aikawa, M., Machida, M. N., Fujimoto, M. Y., & Iben, I., Jr. 2004, ApJ, 611, 476
- Sullivan et al. (2006) Sullivan, M., et al. 2006, ApJ, 648, 868
- Timmes, Woosley, & Weaver (1995) Timmes, F. X., Woosley, S. E., & Weaver, Thomas A. 1995, ApJS, 98, 617
- Umeda & Nomoto (2002) Umeda, H., & Nomoto, K. 2002, ApJ, 565, 385
- Umeda & Nomoto (2005) Umeda, H., & Nomoto, K. 2005, ApJ, 619, 427
- Tominaga et al. (2007) Tominaga, N., Umeda, H., & Nomoto, K. 2007, ApJ, 660, 516
- Tinsley (1980) Tinsley, B. M. 1980, Fundamentals of Cosmic Phisics Vol.5, p.287
- Travaglio et al. (2004) Travaglio, C., Gallino, R., Arnone, E., Cowan, J., Jordan, F., & Sneden, C. 2004, ApJ, 601, 864
- Travaglio et al. (2001) Travaglio, C., Gallino, R., Busso, M., & Gratton, R. 2001, ApJ, 549, 346
- van den Hoek & Groenewegen (1997) van den Hoek, L. B., & Groenewegen, M. A. T. 1997, A&AS, 123, 305
- Vassiliadis & Wood (1993) Vassiliadis, E., & Wood, P. R. 1993, ApJ, 413, 641
- Ventura & D’Antona (2009) Ventura, P., & D’Antona, F. 2009, A&A, 499, 835
- Wallace & Woosley (1981) Wallace, R. K., & Woosley, S. E. 1981, ApJS, 45, 389
- Woosley & Weaver (1995) Woosley, S. E., & Weaver, T. A. 1995, ApJS, 101, 181
- Wyse & Gilmore (1995) Wyse, R. F. G., & Gilmore, G. 1995, AJ, 110, 2771
- Yong, Lambert, & Ivans (2003) Yong, D., Lambert, D. L., & Ivans, I. I. 2003, ApJ, 599, 1357
- Zinner (1998) Zinner, E 1998, AREPS, 26, 147
- Zinner et al. (2006) Zinner, E., Nittler, L. R., Gallino, R., Karakas, A. I., Lugaro, M., Straniero, O., & Lattanzio, J. C. 2006, ApJ, 650, 350
- Zoccali et al. (2003) Zoccali, M., et al. 2003, A&A, 399, 931
- Zoccali et al. (2008) Zoccali, M., et al. 2008, A&A, 486, 177