∎
Tel.: +972-4-8292027
Fax: +972-4-8292027
33email: satanan@tx.technion.ac.il
44institutetext: E. Polturak 55institutetext: 55email: emilp@physics.technion.ac.il
On The Mobile Behavior of Solid 4He at High Temperatures
Abstract
We report studies of solid helium contained inside a torsional oscillator, at temperatures between 1.07K and 1.87K. We grew single crystals inside the oscillator using commercially pure 4He and 3He-4He mixtures containing 100 ppm 3He. Crystals were grown at constant temperature and pressure on the melting curve. At the end of the growth, the crystals were disordered, following which they partially decoupled from the oscillator. The fraction of the decoupled He mass was temperature and velocity dependent. Around 1K, the decoupled mass fraction for crystals grown from the mixture reached a limiting value of around 35%. In the case of crystals grown using commercially pure 4He at temperatures below 1.3K, this fraction was much smaller. This difference could possibly be associated with the roughening transition at the solid-liquid interface.
Keywords:
Solid Helium Supersolids Disorder1 Introduction
Solid Helium has been intensely studied during recent years as part of the search for supersolidity Andreev ; Leggett1970 . These studies revealed an anomaly in the acoustic properties of the solid around 0.2K Goodkind1997 , and subsequently a Non Classical Rotation Inertia (NCRI), first discovered by Kim and Chan KC2004 using a torsional oscillator (TO). The TO was suggested as a tool to search for supersolidity by Leggett Leggett1970 . The initial discoveries of the NCRI were later confirmed and expanded upon by many others Shirahama ; Kubota ; Reppy2007 ; Kojima ; Davis ; Kim . In addition, an increase of the shear modulus Beamish and recently mass flow in the solid Hallock in the same temperature range were reported. There is an ongoing debate regarding the interpretation of these TO and shear modulus experiments in terms of supersolidity Davis ; Balatsky ; Kuklov ; Reppy2010 . We have essentially repeated the TO experiments with two important differences: (a) we used single crystals instead of polycrystals used by a majority of other groups, and (b) we searched for effects similar to those reported (NCRI) at higher temperatures. We found Eyal2010 that disordering a single crystal produces qualitatively the same results observed at low temperature TO experiments. We have now extended our temperature range enabling us to grow single crystals between about 1K and up to nearly 2K. In addition, we did the experiments using not only commercially pure 4He (around 0.3 ppm of 3He), but also a mixture containing 100ppm of 3He. Overall, we see velocity dependent mass decoupling in all our experiments. The results with pure 4He however differ in some respects from those obtained using a 3He-4He mixture. These new results are reported in the present manuscript.
2 Experimental System
We used several TOs in our experiments. A cross section of the one used currently is shown in figure 1. In the current version, both the torsion rod and the annular He cell are made of Beryllium-Copper. The loaded Q of this TO is about . In the earlier versions, the annular He cell was made of 7075 Al alloy, with a Q close to . The annular He space has an outer diameter of 17mm, a width of 2mm , and a total volume of 1cc. The TO is driven electrostatically. The tangential rim velocity can be varied between several m/sec and several cm/sec. The cell was filled with He through a heated filling line, entering the TO structure through the top. The section of the filling line which is part of the TO is a capillary with a volume of around 0.001 cc, a thousand times smaller than that of the cell. An important feature of our design is the absence of any sharp corners inside the cell. This feature is essential in order to enable solid He to completely fill the cell, without leaving pockets of fluid at the corners Tuvy ; BalibarAngles . By our estimate, filling this volume with solid He should change the resonant period of oscillations by 0.15%. The observed value (4.01sec) is in good agreement with the calculation. Our frequency resolution allows us to determine the amount of solid He to within 1:1000 of the full cell value. The oscillator is thermally connected to a 3He refrigerator through its torsion rod. Hence, the bottom of the cell inside the oscillator is the coldest internal surface and the solid nucleates there.
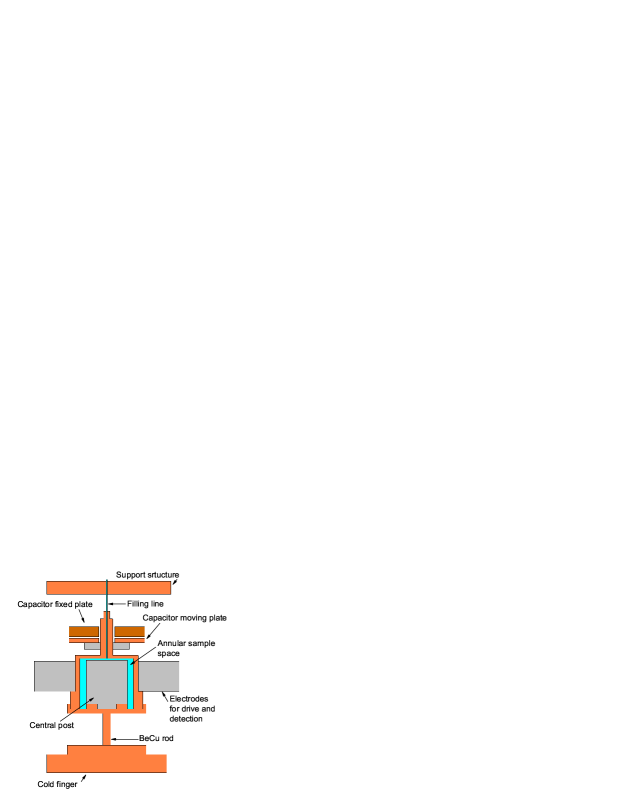
During the measurements, we needed to measure the actual pressure inside the cell. In our latest experiments we used a capacitive pressure gauge shown in figure 1. The moving plate of the capacitor forming this gauge is attached to the top of the cell, while the fixed plate of the capacitor is attached to the support structure. As the pressure increases, the top of the cell inflates, moving the plate upwards and increasing the capacitance. Our gauge has a capacitance of around 15pF, with a noise level of several times 10-5pF. The pressure sensitivity of of the gauge is around 0.0289pF/bar, with a resolution better than 1 mbar. The top of the BeCu cell, on which this gauge was placed, had a non-hysteretic and linear pressure dependence over our working range. In order to get the most accurate results, the gauge was re-calibrated for each crystal grown.
In our previous TOs, the pressure inside the cell was measured in a different way. Specifically, we monitored the resonant frequency of a composite vibrational mode of the filling line and the oscillator. By simulating the response of the oscillator, we identified this vibrational mode as a combination of a ”floppy” oscillation mode of the TO (a mode where the torsion rod bends rather than twists) with a torsional mode of the bent filling line. This mode was observable only when the filling line was fixed at its upper end. Reducing the length of this section of the filling line increased the resonant frequency and lowered its amplitude. As the pressure was raised in the cell, the top of the cell inflated, bending the filling line further and thus reducing its resonant frequency.
This method was used with two different TO’s, one made of 7075 Al alloy, and the other from BeCu. The pressure dependence of the resonant frequency of this mode was qualitatively the same for both TOs. The temperature dependence of this mode was very small and its dependence on the amount of He in the cell was negligible. This mode was excited in the same way as the torsional mode, however, we used a separate pair of electrodes for detection. The moving electrode, biased at high voltage, was attached to the cell at the insertion point of the filling line. The Q of this mode was not as high as that of the torsional mode, and so the resonant frequency was determined by sweeping the frequency using a signal generator. The dependence of the resonant frequency on pressure was calibrated while the cell was filled with liquid at a temperature above 2K against an external pressure gauge. The inset of figure 2 shows an example of such a calibration in an Aluminium cell.
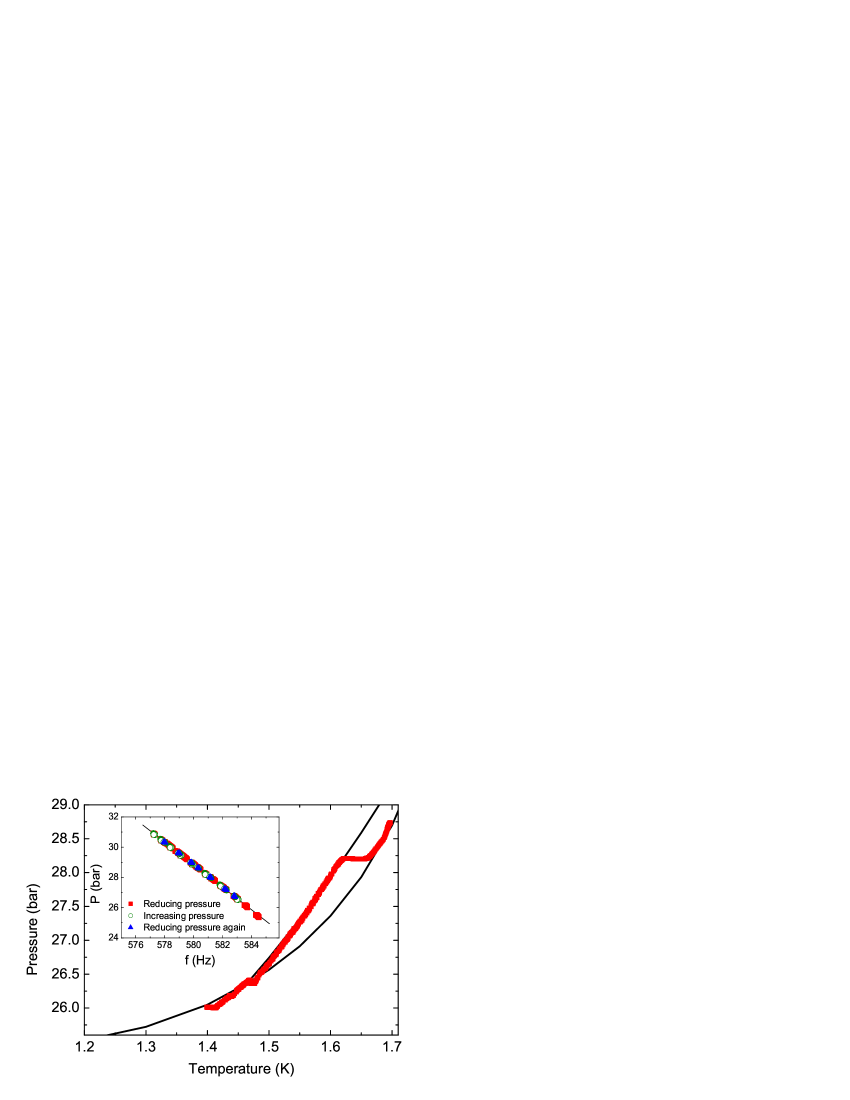
The performance of this gauge is shown for example in figure 2. The figure shows the pressure, as deduced from the resonant frequency, upon heating a cell full of solid. For comparison, the phase diagram Grilly is also shown. This particular crystal was initially grown at 1.66K and cooled to 1.4K. At 1.4K, the location on the phase diagram was on the melting curve. We monitored the resonant frequency as we heated the crystal. First, the solid followed the melting line, until it reached the lower triple point. It then continued along the bcc-hcp coexistence line, and followed it till the cell was completely full of bcc. Then, upon heating, we entered the bcc phase, and reached the melting line again. As can be seen in the figure, the resolution of this pressure gauge is entirely adequate.
This method gave reasonably good results when used in a configuration where the filling line was made of a single piece of capillary tubing. When the filling line was constructed of two capillaries, one inside the other (which we needed for a different reason), the added friction damped this mode to the point where this method became very inaccurate. Hence, in the current version we use a capacitive gauge to measure pressure.
3 Crystal Growth
The objective of our experiment was to observe the response of the TO after introducing disorder into a single crystal. For that, we first needed to grow single crystals of helium inside the experimental cell. Our knowledge of single crystal growth comes mainly from neutron scattering experiments Oshri ; Tuvy . During these experiments elastic scattering was used to characterize the quality and orientation of the crystals grown. These experiments demonstrated the conditions under which the growth results in high quality single crystals. Similar growth conditions were used in the current TO experiment.
We grew crystals at constant temperature and pressure on the melting curve. Keeping the filling line heated to several mK above the cell temperature enabled us to work with pressures somewhat above the melting pressure inside the cell without blocking the capillary. To start the growth, we first raised the pressure of the liquid inside the cell to almost that of the melting curve. We then added a small quantity of He to the cell by opening the valve connecting the cell to a small standard volume at room temperature. The initial pressure inside the standard volume was usually around several hundred mbars above that in the cell. As He was being added to the cell, we waited for solid nucleation to occur. Nucleation was detected by monitoring the period of the TO, which started to increase once solid was formed. Referring to figure 1, with the heated filling line, the coldest spot in the cell was at its bottom, connected to the 3He refrigerator through the torsion rod. We expect the crystal to nucleate in this region. To minimize the possibility of growing several crystals at different locations, which would result in a poly-crystalline sample, we allowed the system to equilibrate for one hour after the first nucleation. Optical studies on solid 4He show that although very often several nuclei are created at first, after a long enough wait only one crystallite survives, and the rest dissolve.
Once we have waited enough to have only a single nucleus in the cell, we commenced adding small quantities of He from the same standard volume to the cell at constant time intervals. Each filling cycle added a quantity of He into the cell equivalent to about 0.03 cc of solid. After each cycle, the overpressure inside the standard volume relaxed to the melting pressure at the growth temperature. As long as the crystal grew the resonant period continued to increase. Once the pressure has relaxed to the melting pressure, the period stopped increasing (see figure 2 in Eyal2010 ). It is also possible to grow crystals continuously, using a small (30-50 mbar) constant overpressure at room temperature.
The absolute temperature inside the cell is determined from the melting pressure measured in-situ using Grilly’s paper Grilly . During crystal growth, the overpressure inside the standard volume relaxes to the same melting pressure. This enables us to state that within our resolution there are no pressure or temperature gradients in our cell. When growing a crystal from the superfluid it is relatively straightforward to achieve such stability. When growing from the normal fluid phase above 1.772K, the equilibration times become much longer. A typical time to grow a single crystal from the superfluid is around 10 hours, while with the normal fluid it can take up to 3 days. The reason is the slow rate at which heat leaves the system in the normal fluid phase.
There are several indications signaling that the cell is completely full with solid. The first and most obvious one is that the overpressure in the cell no longer relaxes to the melting pressure. Once the cell is full, additional solid is formed in the heated filling line, where the temperature and the melting pressure are higher. In subsequent filling cycles, the pressure relaxes to values which are higher and higher as the liquid in the filling line solidifies in hotter sections. The second indication is that the period of the TO does not change further with subsequent filling cycles and stays constant (see figure 2 in Eyal2010 ). A third sign is the amplitude of the oscillations, which rises systematically during the growth. During the final stages of the growth the amplitude increases rapidly, and eventually reaches a constant value once the cell is full.
In principle, our method of crystal growth could be used down to the minimum of the melting curve at 0.8K. In practice, the lowest temperature at which we could grow a crystal was constrained by heat flow through the superfluid in the filling line. The lowest growth temperature in this experiment was 1.07K. After blocking the filling line the crystals could be cooled down to temperatures around 0.5K.
4 Disordering Procedure
Our main goal was to observe the influence of disorder on the moment of inertia of a single crystal. To achieve that we needed to have a controlled disordering procedure. Neutron scattering experiments done on samples of 4He Oshri in several different cells all show that in general, the solid is very fragile and easily disordered by application of stress. Similar results were also recently observed in acoustic experiments measuring the shear modulus BalibarStress ; Beamish , in which the critical shear stress of 4He was found to be around 10-6 bar. Stress of this magnitude could be generated in several ways. One possibility which comes to mind is by cooling or by creating temperature gradients. Referring to figure 1, our crystal is grown inside an annulus around a central post. Upon cooling the cell by T , the crystal should contract. However, it is prevented from contracting by this central post, creating a strain of T and stress of G strain. Here, is the thermal expansion coefficient, and G is the shear modulus. Putting numbers in, we find that at 1.6K it is enough to cool the crystal by as little as 10 mK to exceed the critical stress. Temperature gradients could be generated using the filling line heaters. Another possibility was to lower the temperature of the 3He cold stage cooling the cell. There is also a possibility of introducing stress mechanically, by applying a pressure pulse while the filling capillary is still open. The results of such operations were seen in the neutron scattering experiments. When introducing such stress to a cell completely full of solid, a single crystal would invariably decompose into several grains with low angle grain boundaries between them. We believe that a similar situation occurs in our cell, with the crystal cracking into grains which however remain oriented. An estimate of the typical grain size is given below in the ”Results” section.
It is important to point out that as long as there is any fluid in the cell, the procedures described above do not disorder the crystal. In each of these scenarios, the fluid acts as a buffer absorbing the stress, for example by solidifying during cooling Eyal2010 .
5 Results
Broadly speaking, the temporal behavior of the TO after disordering a crystal is always similar, with the resonant period and the amplitude of oscillations both decreasing Eyal2010 . Depending on temperature and 3He concentration, it can take between a few minutes to a few hours for these changes to reach completion. Once the period and amplitude have stabilized, their values remain constant for as long the ambient conditions are steady. The magnitude of the period change upon disordering the crystal can be between several percent to about 35% of the period change resulting from completely filling the cell with solid. We call the ratio between these two numbers the ”mass decoupling fraction”, . Simultaneously, the dissipation 1/Q deduced from the oscillation amplitude at constant drive, increases upon breaking the crystal by a factor of 10-30.
The initial mass decoupling fraction, depended on the size of the temperature or pressure shock disordering the crystal. The crystal could be further disordered by cooling it to a lower temperature. Ultimately, all the crystals grown above 1.4K reached a constant maximal mass decoupling value, 30%-35%, irrespective of their crystalline symmetry. The temperature at which the crystals reached this maximal value depended on the growth temperature and on the initial disordering, however it seems that 35% was the maximal mass decoupling fraction achievable in our geometry.
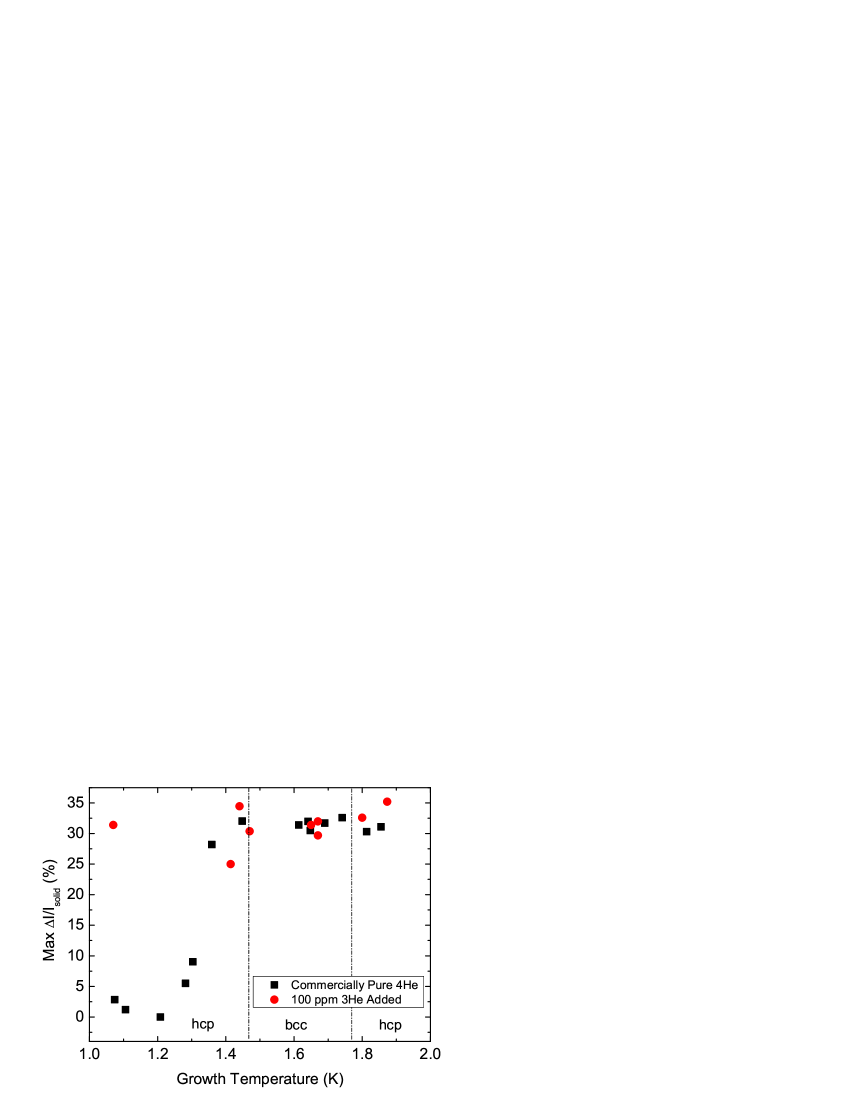
The only exception as far as the value of goes occurred for commercially pure 4He hcp crystals grown below the lower triple point of 1.464K. For these crystals, the maximal amount of mass decoupling decreased with the growth temperature. Crystals grown below 1.3K could not reach a value higher than several percent (See figure 3). One of these low temperature crystals, grown at 1.21K, did not show mass decoupling at all. We believe that the reason for that could be the orientation of the crystal. The c facet’s roughening temperature being 1.28K, implies that at 1.21K the crystal grows faceted. If the c axis of the crystal is not aligned with the symmetry axis of the cell, then with a faceted crystal liquid can be trapped in a corner, and prevent complete filling of the cell with solid. In experiments done with the cell having sharp internal corners, where liquid was trapped, the mass decoupling effect did not appear. That particular 1.21K sample was grown like the rest, but the filling line was blocked when the mass load in the cell was 0.88% below the expected value.
5.1 The Influence of 3He
The low temperature TO KC2004 and shear modulus experiments Beamish are extremely sensitive to the presence of 3He. To see to what extent 3He influences our results, we repeated the TO experiment with a mixture of 4He and 3He. A priori, in our temperature range, there is no phase separation and crystalline defects like dislocations are not pinned by 3He atoms (The binding energy of 3He atoms to dislocations is 0.3-0.7K Paalanen ; Iwasa_binding ). We used a gas mixture with a concentration of 100ppm 3He. Such a low concentration of 3He does not change the phase diagram appreciably. It lowers the lower triple point and the hcp-bcc transition line by only a few mK LeeMixtures . However, the concentration of 3He is significantly higher at surfaces and grain boundaries (GB) than in the bulk. That is because 3He atoms diffuse to GB’s in order to lower their zero point energy, as the density at the GB’s is lower than that of the bulk solid. For this reason, the presence of even a small 3He concentration does significantly lower , the roughening temperature of the c facet in hcp crystals EmilRoughening . For pure 4He is 1.28K, while for crystals containing 100ppm of 3He is around 1K.
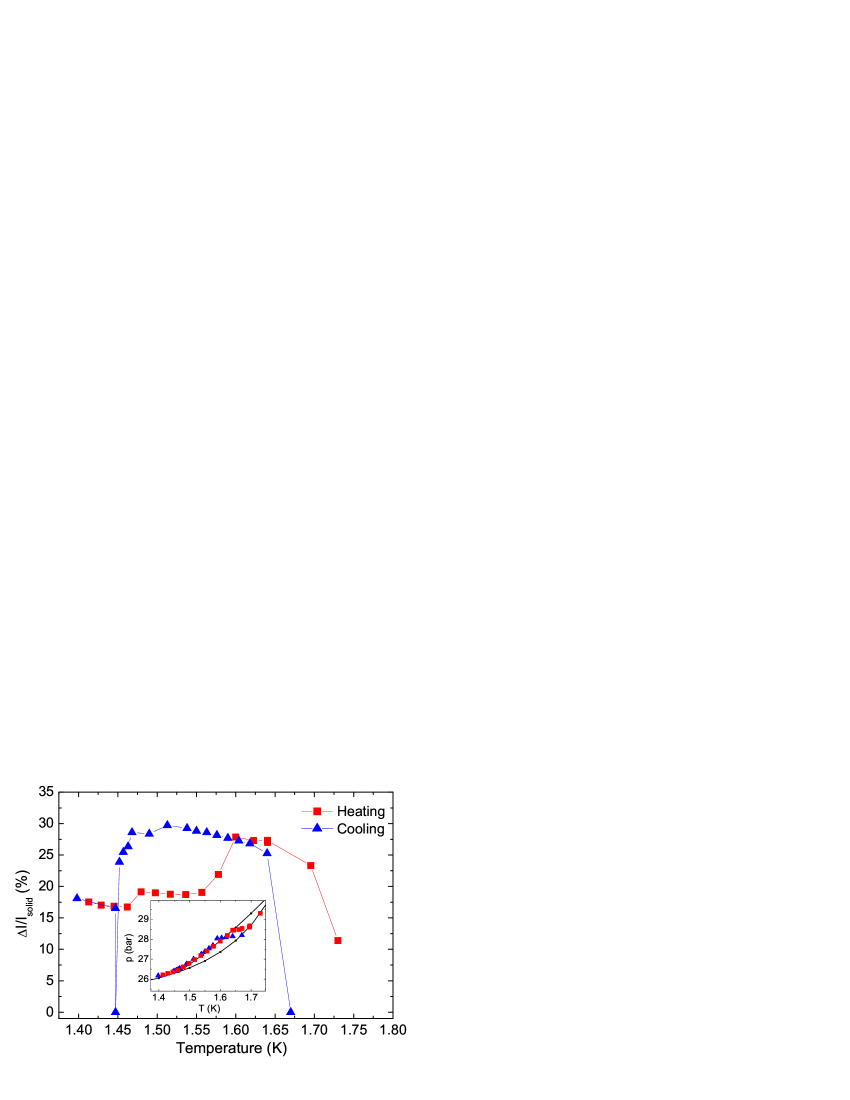
The crystals containing 100ppm of 3He were grown in the same way as the commercially pure 4He samples. The cell was connected through the filling line to a bottle containing the mixture at a high pressure. Figure 4 shows pressure versus temperature upon cooling a cell filled with a solid grown at 1.67K. During growth, the 3He concentration is uniform inside the solid. Once the crystal has disintegrated into grains, 3He starts to diffuse from the bulk onto the GB’s. Here, a disintegrated crystal stands for a disordered crystal, composed of several grains misoriented by a few degrees. This diffusion is the reason for the irreversible behavior of the mass decoupling fraction between the cooling and the heating of the crystal. During the day or so separating these processes the concentration of 3He on the GB’s has increased. The irreversibility is especially evident along the bcc-hcp coexistence line and at higher temperature where the solid reaches the melting curve. With pure 4He, once the solid reaches the melting curve the crystal anneals and the mass decoupling fraction goes to zero. With 100ppm of 3He in the cell, when the solid is heated and reaches the melting curve, a significant amount of decoupled mass still remains, even with liquid in the cell. This fraction would probably go to zero at some higher temperature, yet it demonstrates that the addition of 3He alters some properties of the solid which are related to the mass decoupling.
The structural relaxation times for crystals containing 3He are equal to or larger than those measured using commercially pure 4He. In the bcc phase, the relaxation times are almost the same. Below the lower triple point of 1.464K, crystals containing 3He exhibited a different time scale for disordering. Specifically, it took more that a day (up to 2 orders of magnitude longer) to reach a constant mass decoupling value. Figure 5 (a) shows the time it took the crystals to reach a constant mass decoupling value. Diffusion of 3He atoms in the crystal could explain these differences. The diffusion coefficient of 3He in the hcp phase is an order of magnitude smaller than in the bcc phase Grigorev . The longer time scale for disordering in the hcp phase is consistent with this difference. As pointed out above, 3He atoms diffuse from the bulk to the GB’s. As as long as this mass transport takes place, structural relaxation of the crystal continues and the mass decoupling fraction keeps increasing. By calculating the diffusion length, using the characteristic time it took structural relaxation of the crystals to reach completion, we get a rough estimate of the grain size. Using values for the diffusion coefficient Grigorev and the relation we find that the grain size is almost always around a few parts of a mm. These results can be seen in figure 5 (b). The typical grain size is consistent with the size of our cell, and with previous results found in neutron scattering experiments Oshri . The only exception was a crystal grown at 1.07K, which gave a somewhat larger grain size. This is probably due to the lower thermal expansion coefficient at these temperatures which resulted in less stress on the crystal upon disordering. It is interesting to point out that for a crystal grown at the lower triple point, the relaxation time was very short (See figure 5 (a)). This should be the case if the crystal disintegrates into very small grains at the triple point. Optical studies of He crystals Tuvy ; Fujii support this picture.
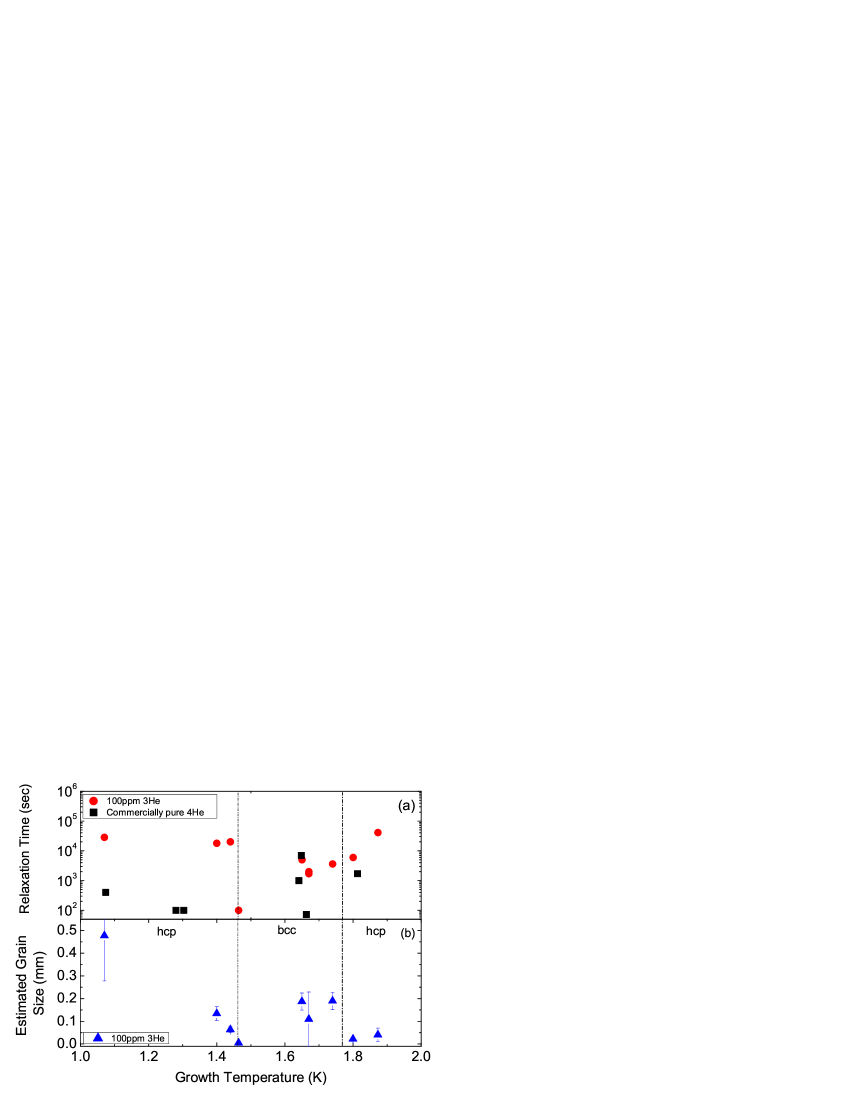
The addition of 3He also affected the maximal mass decoupling fraction. This was only apparent below about 1.3K. Figure 3 shows this fraction for crystals containing both commercially pure 4He (black squares) and 100ppm of 3He (red circles) as a function of the crystal growth temperature. As stated above, crystals grown using commercially pure 4He show a drastic fall in the maximal possible mass decoupling. In contrast, crystals containing 3He reached the same maximal mass decoupling values over all our temperature range. This could be related to the decrease of the roughening temperature due to the presence of 3He EmilRoughening .
5.2 Velocity Dependence of the Decoupled Mass
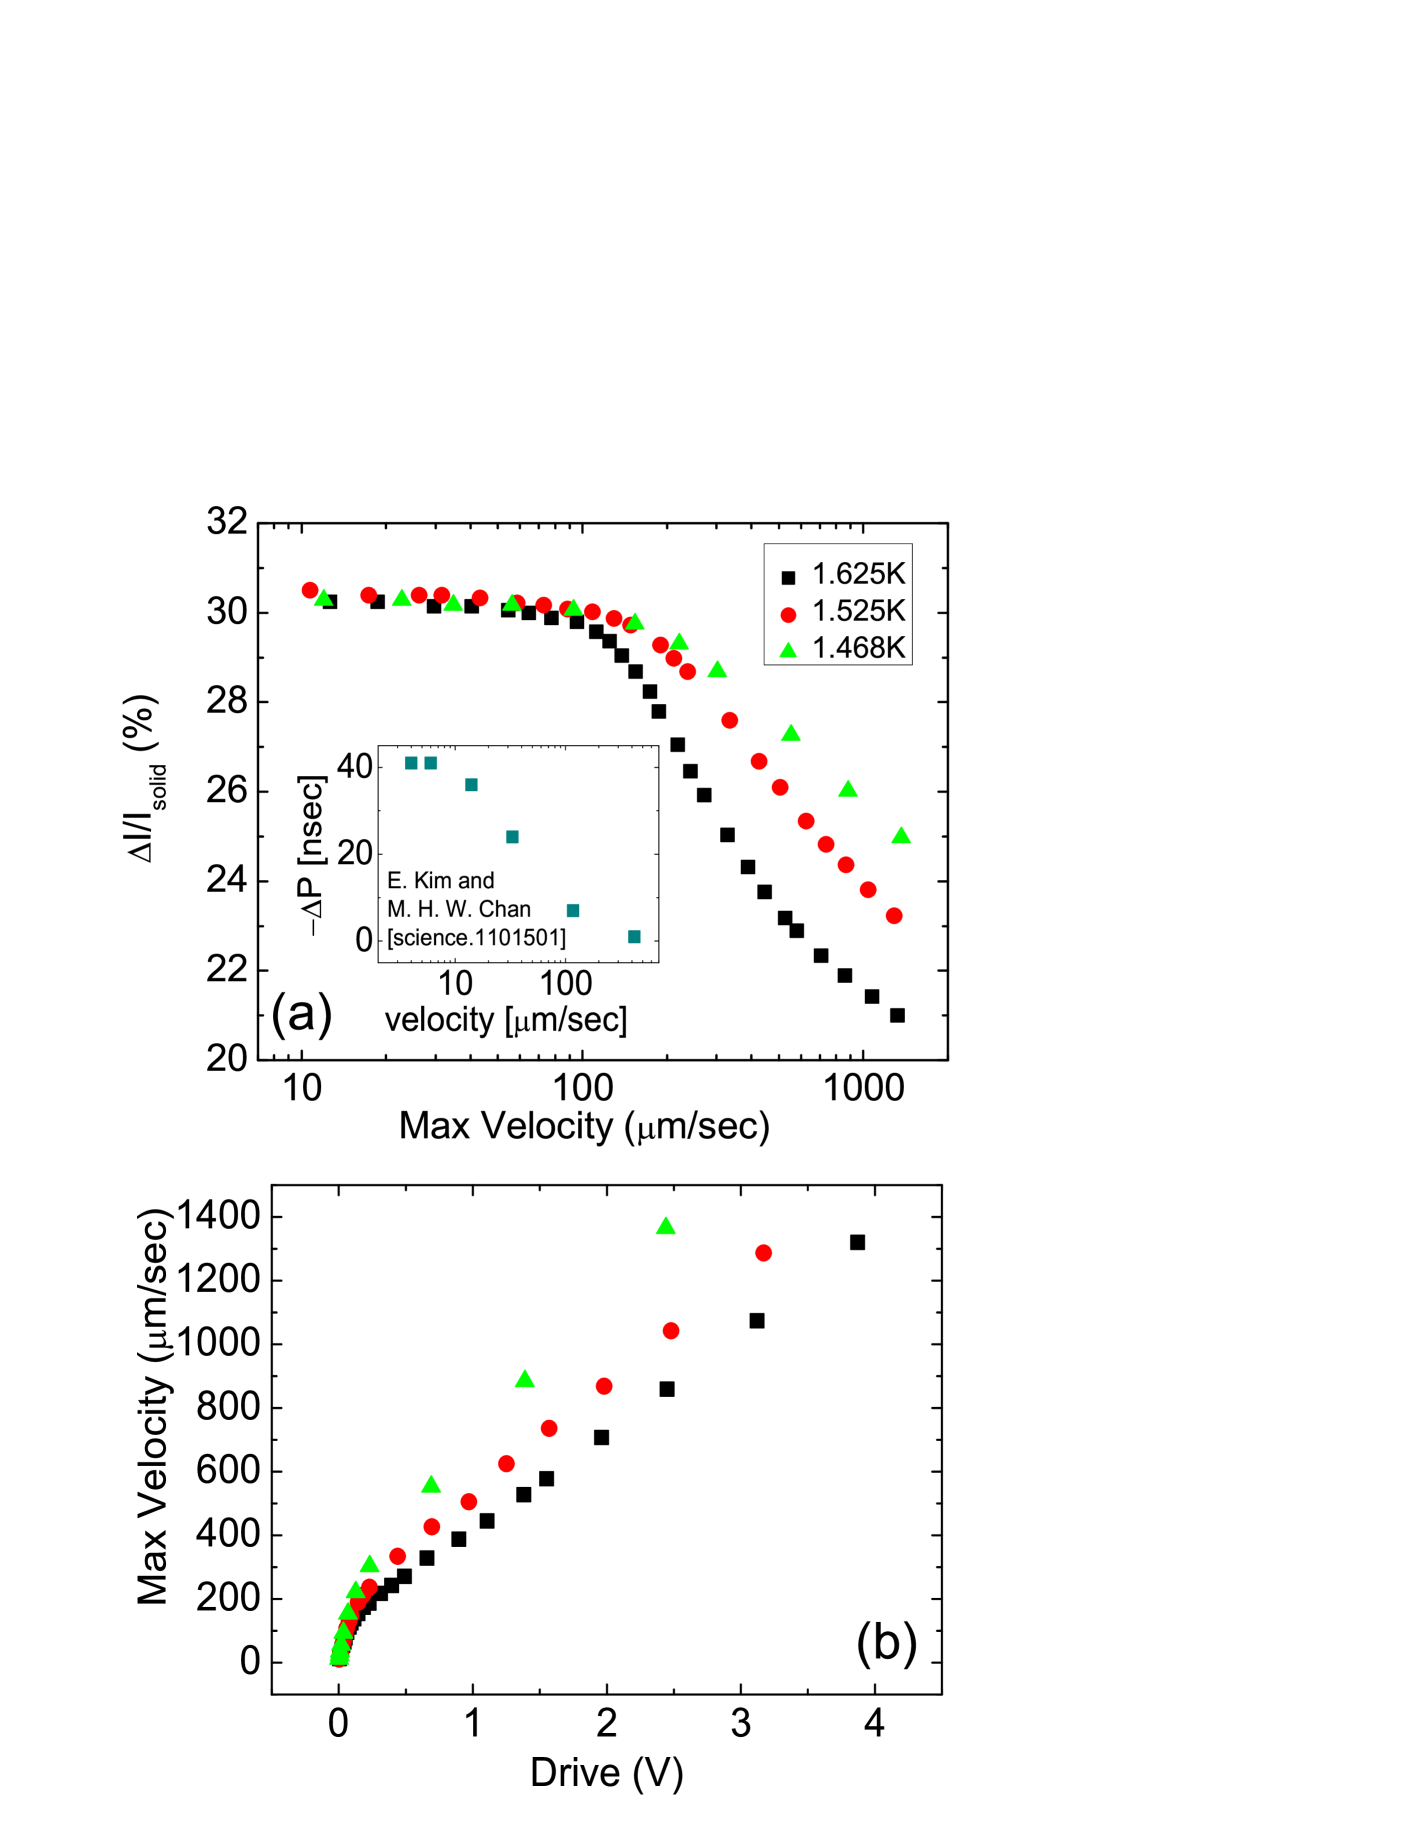
We now describe the dependence of the mass decoupling fraction on the rim velocity of the TO. This quantity is shown in figure 6 (a) for a bcc crystal grown at 1.67K. At velocities lower than 100 m/sec the mass decoupling fraction is approximately constant. At higher velocities, the mass decoupling fraction starts to decrease. At lower temperatures, this crossover velocity increases, and the mass decoupling decreases with velocity at a smaller rate. For comparison, data taken from KCScience are shown in the inset of the figure. As can be seen, the dependence of the period change (proportional to mass decoupling) on the velocity is qualitatively the same, except for the scale. Figure 6 (b) shows the velocity as function of the driving force. The slope of the data is inversely proportional to the dissipation of the TO. It is seen that the lower the temperature the smaller the dissipation. The change of the slope in Figure 6 (b) occurs at the same crossover velocity where the mass decoupling starts to decrease. The changes of the mass decoupling fraction with velocity are therefore associated with the onset of increased dissipation. Below 1K, the dissipation approaches the residual level of the TO. This means that within our resolution, the motion of solid He inside the TO does not add to the dissipation.
It was recently suggested that many of the phenomena seen in TO experiments can be attributed to some properties of dislocations in solid He Soyler ; Chui ; Iwasa . In single crystals, the density of dislocations is typically low BeamishDislocations ; BalibarStress and so in our work we expect to find dislocations mainly at the GB’s separating adjacent grains. Our measurements were done in a temperature regime where 3He atoms do not pin dislocations, and at low dislocation density there should be no network pinning. We therefore expect the dislocations in our samples to be mobile. Dislocation motion can take place through climb or glide. For climb, vacancies are needed. The activation energy of vacancies in bcc solid He is around 10K. The temperature dependence of our data is inconsistent with this activation energy. In addition, at low temperatures we observe that the mobility of solid He is accompanied by very low dissipation. If this mobility is mediated by dislocations, then a conservative type of motion is needed, namely glide. Glide of dislocations is generated by kinks which are formed by the stress applied at the moving wall of the cell. These mechanically generated kinks travel along the dislocation. Dissipation can take place for example if these are scattered by thermally excited kinks or by thermal phonons Iwasa_phonons . Such a process can define a characteristic velocity , such as the crossover velocity seen in figure 6. If one considers the kink-kink scattering only, then on dimensional grounds this characteristic velocity can depend on the sound velocity, the grain size, and on the density of thermal kinks, , which is strongly dependent on temperature (with an activation energy of 0.3K-0.4K).
| (1) |
Here is the speed of sound and is the typical grain size. According to this relation, the crossover velocity above which the dissipation of the TO increases should decrease at higher temperatures, which is broadly consistent with experimental results.
6 Conclusion
It seems that the mass decoupling in the TO experiment at temperatures between 1K and 2K has to do with structural changes of the crystal. The dependence of the amount of decoupled mass on the c facet’s roughening temperature, as evident from the 100ppm 3He experiments, indicates that surface effects are important. Whether these effects change the mobility of grain boundaries or the type of mobile dislocations requires further investigation.
In recent work, Reppy Reppy2010 suggests a non-supersolid origin to the mass decoupling effect observed in TO experiments at low temperatures. Among other issues, this work emphasizes the importance of comparing the correct moment of inertia of the TO with the solid in an immobile state. Our crystals show no mass decoupling before introducing disorder, and the moment of inertia of a cell containing a single crystal is consistent with the classical calculation. Therefore, our experiment clearly shows that the mass decoupling results from the mobile state and that the decoupled mass fraction is independent of the initial state of the solid. The connection to the low temperature experiments in solid helium may be established if the low temperature experiments would be done using single crystals as samples. Only then, can the change in the period of oscillations be interpreted properly.
Acknowledgements.
We thank L. Embon for his contribution to this work. Technical assistance by S. Hoida, L. Yumin, and A. Post is gratefully acknowledged. This work was supported by the Israel Science Foundation and by the Technion Fund for Research.References
- (1) A. Andreev, I. Lifshitz, Zh. Eksp. Teor. Fiz. 56, 2057 (1969)
- (2) A.J. Leggett, Phys. Rev. Lett. 25, 1543 (1970)
- (3) P.C. Ho, I.P. Bindloss, J.M. Goodkind, J. Low Temp. Phys. 109, 409 (1997)
- (4) E. Kim, M.H.W. Chan, Nature 427, 225 (2004)
- (5) M. Kondo, S. Takada, Y. Shibayama, K. Shirahama, J. of Low Temp. Phys. 148, 695 (2007)
- (6) A. Penzev, Y. Yasuta, M. Kubota, J. of Low Temp. Phys. 148, 677 (2007)
- (7) A.S.C. Rittner, J.D. Reppy, Phys. Rev. Lett. 98(17), 175302 (2007)
- (8) Y. Aoki, J.C. Graves, H. Kojima, Phys. Rev. Lett. 99(1), 015301 (2007)
- (9) B. Hunt, E. Pratt, V. Gadagkar, M. Yamashita, A.V. Balatsky, J.C. Davis, Science 324, 632 (2009)
- (10) H. Choi, S. Kwon, D.Y. Kim, E. Kim, Nature Phys. 6, 424 (2010)
- (11) J. Day, J. Beamish, Nature 450, 853 (2007)
- (12) M.W. Ray, R.B. Hallock, Phys. Rev. Lett. 100(23), 235301 (2008)
- (13) Z. Nussinov, A.V. Balatsky, M.J. Graf, S.A. Trugman, Phys. Rev. B 76(1), 014530 (2007)
- (14) L. Pollet, M. Boninsegni, A.B. Kuklov, N.V. Prokof’ev, B.V. Svistunov, M. Troyer, Phys. Rev. Lett. 101(9), 097202 (2008)
- (15) J.D. Reppy, Phys. Rev. Lett. 104(25), 255301 (2010)
- (16) A. Eyal, O. Pelleg, L. Embon, E. Polturak, Phys. Rev. Lett. 105(2), 025301 (2010)
- (17) T. Markovitz, E. Polturak, J. Low Temp. Phys. 123, 53 (2001)
- (18) S. Balibar, D.O. Edwards, C. Laroche, Phys. Rev. Lett. 42(12), 782 (1979)
- (19) E.R. Grilly, J. Low Temp. Phys. 11, 33 (1973)
- (20) O. Pelleg, M. Shay, S.G. Lipson, E. Polturak, J. Bossy, J.C. Marmeggi, K. Horibe, E. Farhi, A. Stunault, Phys. Rev. B 73(2), 024301 (2006)
- (21) C. Pantalei, X. Rojas, D. Edwards, H. Maris, S. Balibar, J. Low Temp. Phys. 159, 452 (2010)
- (22) M.A. Paalanen, D.J. Bishop, H.W. Dail, Phys. Rev. Lett. 46, 664 (1981)
- (23) I. Iwasa, H. Suzuki, J. Phys. Soc. Jpn. 49, 1722 (1980)
- (24) P.M. Tedrow, D.M. Lee, Phys. Rev. 181(1), 399 (1969)
- (25) Y. Carmi, E. Polturak, S.G. Lipson, Phys. Rev. Lett. 62(12), 1364 (1989)
- (26) V.N. Grigor ev, Low Temp. Phys. 23, 3 (1997)
- (27) H. Fujii, Y. Okumura, K. Matsumoto, Y. Okuda, Physica B: Condensed Matter 284-288, 347 (2000)
- (28) E. Kim, M.H.W. Chan, Science 305, 1941 (2004)
- (29) S.G. Söyler, A.B. Kuklov, L. Pollet, N.V. Prokof’ev, B.V. Svistunov, Phys. Rev. Lett. 103, 175301 (2009)
- (30) S.T. Chui, Europhys. Lett. 87, 66001 (2009)
- (31) I. Iwasa, Phys. Rev. B 81, 104527 (2010)
- (32) O. Syshchenko, J. Beamish, J. Low Temp. Phys. 150, 276 (2008)
- (33) I. Iwasa, K. Araki, H. Suzuki, J. Phys. Soc. Jpn. 46, 1119 (1978)