75282
T. Clarke
The Curious Case of Abell 2256
Abstract
Abell 2256 is a rich, nearby (z=0.0594) galaxy cluster that has significant evidence of merger activity. We present new radio and X-ray observations of this system. The low-frequency radio images trace the diffuse synchrotron emission of the Mpc-scale radio halo and relics as well as a number of recently discovered, more compact, steep spectrum sources. The spectral index across the relics steepens from the north-west toward the south-east. Analysis of the spectral index gradients between low and and high-frequencies shows spectral differences away from the north-west relic edge such that the low-frequency index is significantly flatter than the high frequency spectral index near the cluster core. This trend would be consistent with an outgoing merger shock as the origin of the relic emission. New X-ray data from XMM-Newton reveal interesting structures in the intracluster medium pressure, entropy and temperature maps. The pressure maps show an overall low pressure core co-incident with the radio halo emission, while the temperature maps reveal multiple regions of cool emission within the central regions of Abell 2256. The two cold fronts in Abell 2256 both appear to have motion in similar directions.
keywords:
Galaxies: clusters: individual: A2256 – Galaxies: clusters: intracluster medium – X-rays: galaxies: clusters1 Introduction
Clusters of galaxies fill an exceptional role in astrophysics as both laboratories for plasma physical processes as well as key constituents in precision cosmology studies of dark energy. Major cluster mergers are the most energetic events since the Big Bang and can drive up to ergs of gravitational potential energy into the intracluster medium (Sarazin, 2002). This energy is then released through shocks and turbulence which heat the intracluster medium (ICM), accelerate relativistic particles and compress magnetic fields. Merging clusters are often (but not always) characterized by the presence of diffuse, low-frequency synchrotron emission believed to be a direct result of the particle acceleration and field compression. The radio sources are characterized as radio halos and relics depending on the observational characteristics (see e.g. Kempner et al., 2004; Ferrari et al., 2008).
Combining X-ray imaging and spectroscopic data with detailed multi-frequency radio total intensity and polarization studies for individual merging systems can provide insight into particle acceleration process as well as the number of recent mergers, their age, and orientation. Here, we briefly discuss recent radio and X-ray observations of the merging cluster Abell 2256. Previous radio studies of Abell 2256 have revealed a Mpc scale halo in addition to the well known relics (Clarke & Enßlin, 2006; Brentjens, 2008; Kale & Dwarakanath, 2010), while X-ray studies (see e.g. Sun et al., 2002) have revealed significant evidence of a disturbed ICM.
2 Steep Spectrum Radio Sources
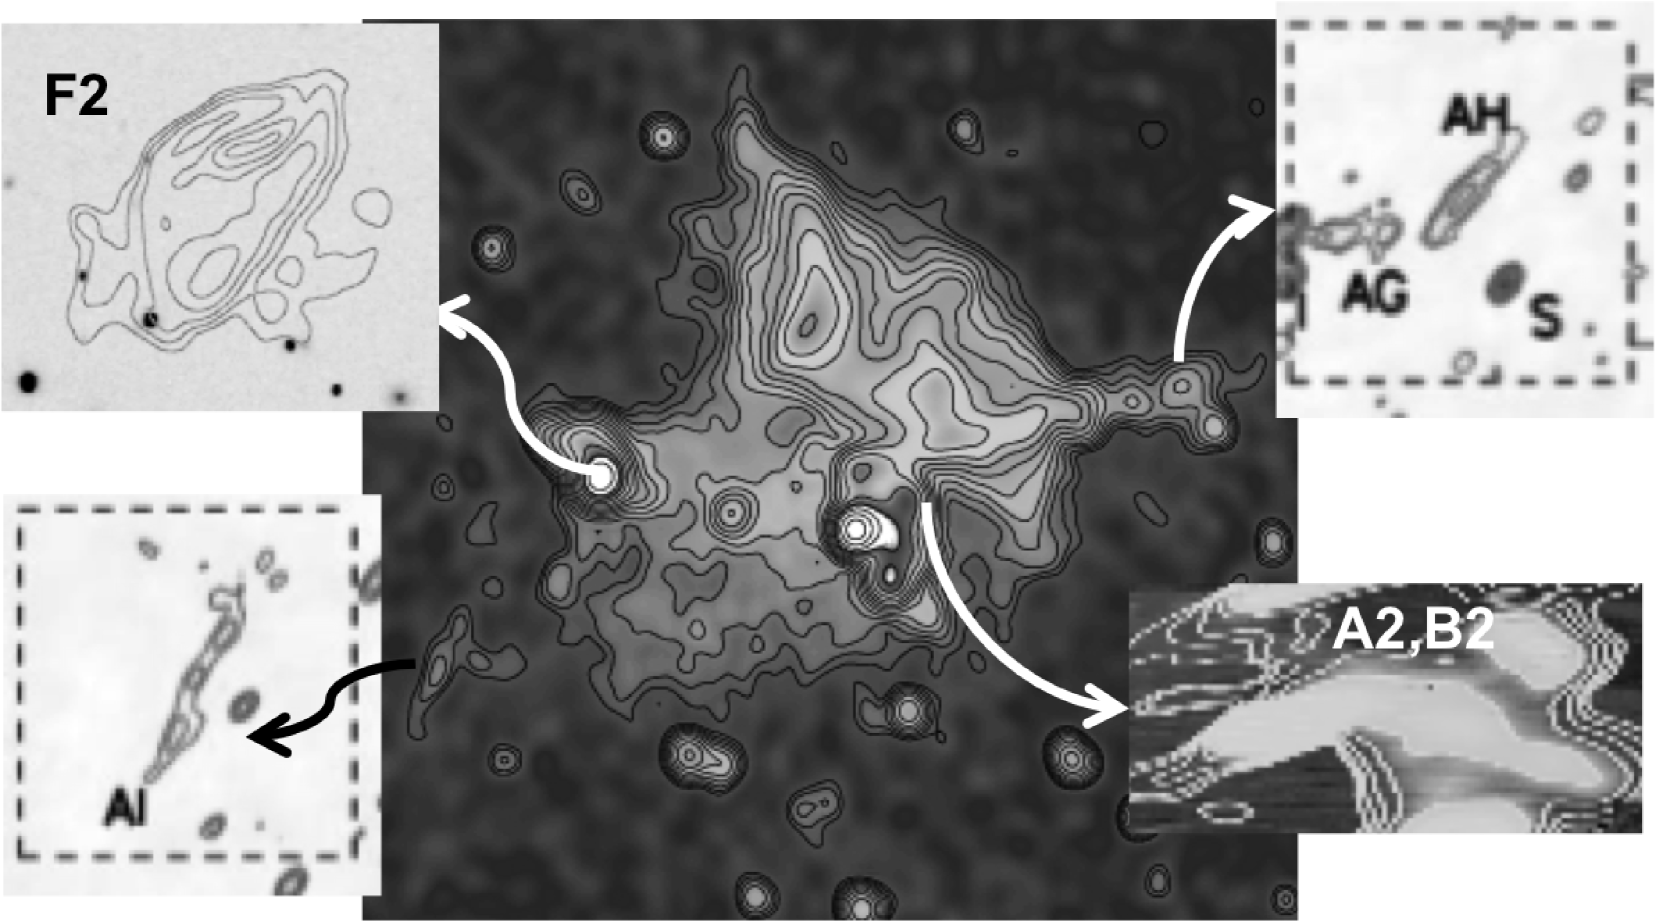
Abell 2256 has recently been the target of many new deep low-frequency high-resolution radio interferometric studies. These observations have revealed a previously unknown population of 100 – 200 kpc long steep spectrum synchrotron filaments surrounding the cluster center. In Figure 1 we show a VLA 325 MHz radio image of Abell 2256 (Clarke et al., in prep.) together with panels showing the well-known ultra-steep spectrum source F2, and the newly revealed filaments AG, AH, AI, A2 and B2. Sources AG, AH, and AI are located nearly a Mpc in projection from the cluster center (van Weeren et al., 2009) and are classified by van Weeren et al. as likely radio phoenix sources (see terminology in Kempner et al., 2004).
The very steep spectral indices of the new synchrotron filaments AG, AH, AI, A2 and B2 () suggest that they are all likely due to merger shock induced adiabatic compression of fossil radio plasma. The presence of this new population of synchrotron filaments in Abell 2256 is not likely unique to this cluster but rather would be expected to be a common property of merging clusters. These new sources therefore provide a powerful new tool with which to trace cluster merger shocks in deep maps from the next generation of low-frequency interferometers such as LOFAR (Röttgering, 2010) and the Long Wavelength Array (Ellingson et al., 2009).
3 Radio Relic Spectral Index
Clarke & Enßlin (2006) found a spectral index trend between 1369 and 1703 MHz across the Mpc scale relics in Abell 2256 such that the spectrum steepens from the north-west toward the south-east. Comparison of this to a similar spectral index map constructed between 325 MHz and 1369 MHz (Figure 2) reveals that the low and high-frequency spectral indices are consistent near the north-west edge of the relics. Interestingly though, the spectral index trend differs as one moves to the south-east edge of the relics such that the low-frequency spectral index is flatter by 0.5 on the south-east edge of the relic compared to the high-frequency spectral index in the same region. A plausible explanation for this spectral index trend is that we are seeing the matching of the spectral index values around near the current location of the outgoing merger shock wave. Moving toward the south-east, in the direction from which the shock originated, we are seeing the effects of synchrotron and inverse Compton losses steepening the high-frequency spectral index measurements.

If we assume that the above scenario is correct, then we can use the spectral index measurement at the north-west edge of the relic to place constraints on the Mach number of the shock. Assuming standard Rankine-Hugonoit jump conditions in the post-shock gas, as in Enßlin et al. (1998), we can relate the shock Mach number to the spectral index as
where is the cosmic ray spectral index, and =5/3 is the adiabatic index of the gas. For the observed spectral index of at the north-west edge of the relic we predict a Mach number of =2.6. We find no clear evidence for an X-ray shock in our combined XMM-Newton data (Figure 3), although Sun et al. (2002) note the presence of a hot region to the north of the main cluster which appears coincident with the eastern relic. Deeper and/or XMM-Newton observations are required to search for the X-ray signatures of the predicted shock.
4 X-ray Properties of the ICM
We have combined 9 separate XMM-Newton data sets for both an imaging and spectral study of Abell 2256. The images reveal similar ICM substructure as seen in Chandra observations of Sun et al. (2002) where the main cluster and subcluster dominate the emission.
The spectral analysis was carried out using techniques of Finoguenov et al. (2005). Based on the Voroni tessellation maps (Diehl & Statler, 2006), we selected roughly 100 contiguous regions in each of 9 separate masks for spectral analysis. The regions were chosen based on variations in either intensity or hardness ratio. We averaged over the results from each of the 9 separate masks to reduce the pixelization in the final images. Using these methods we have constructed temperature, entropy ratio and pressure ratio maps. We show in Figure 3 the resulting averaged temperature map with the outer three 1.4 GHz radio contours of Clarke & Enßlin (2006) overlaid for reference.
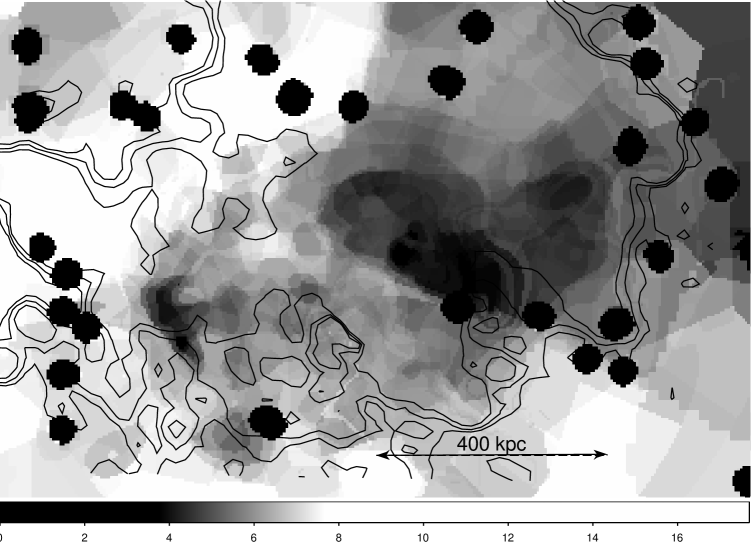
The temperature map of the central region of the cluster shows significant structure with clear regions of cool emission (dark areas) embedded within hotter gas (bright areas). Overall the cluster core is cool ( keV) and is surrounded by hotter gas ( keV), consistent with previous X-ray studies. The most striking features of the temperature map are two regions of very cool gas located to the north-west and south-east of the cluster center. Both regions have temperatures of 4 keV and are clearly distinct from the surrounding regions.
The north-west cool region is associated with the merging subcluster and sits at the inner edge of the radio relic region. The cool region to the south-east ressembles a cold front and is co-incident with the X-ray shoulder discussed by Sun et al. (2002). There appears to be a sharp edge on the south-east portion of this region and a trail of cool gas leading back toward the cluster core. The sharp edge and tail both suggest the direction of motion of the south-east clump is toward the south-east, similar in direction to the motion of the larger cold front to the north-west.
The entropy ratio maps shows two distinct minima in the cluster associated with the merging subcluster and the shoulder. The complex morphology seen for the subcluster in the temperature map is also reflected in the entropy ratio map. The pressure ratio map, made using the base pressure profiles of Finoguenov et al. (2005), shows evidence of a low pressure core co-incident with the radio halo. The pressure ratio map shows a number of fluctuation at the level which are possibly associated with turbulence in the cluster.
5 Summary
Abell 2256 continues to play a central role in detailed studies of merging clusters and the connection to diffuse radio emission. Upcoming low-frequency observations with the EVLA, GMRT and LOFAR will undoubtedly reveal additional details on this extraordinary system. To fully explore this system it will also be important to obtain further deep, high-resolution and/or XMM-Newton images of the cluster to undertake additional spectral analysis of many of the complex features in this system.
Acknowledgements.
Basic research in radio astronomy at the Naval Research Laboratory is funded by 6.1 Base funding.References
- Brentjens (2008) Brentjens, M. A. 2008, A&A, 489, 69
- Clarke & Enßlin (2006) Clarke, T. E., & Enßlin, T. A. 2006, AJ, 131, 2900
- Diehl & Statler (2006) Diehl, S., & Statler, T. S. 2006, MNRAS, 368, 497
- Enßlin et al. (1998) Enßlin, T. A., Biermann, P. L., Klein, U., & Kohle, S. 1998, A&A, 332, 395
- Ellingson et al. (2009) Ellingson, S. W., Clarke, T. E., Cohen, A., Craig, J., Kassim, N. E., Pihlstrom, Y., Rickard, L. J., & Taylor, G. B. 2009, IEEE Proceedings, 97, 1421
- Ferrari et al. (2008) Ferrari, C., Govoni, F., Schindler, S., Bykov, A. M., & Rephaeli, Y. 2008, Space Sci. Rev., 134, 93
- Finoguenov et al. (2005) Finoguenov, A., Böhringer, H., & Zhang, Y.-Y. 2005, A&A, 442, 827
- Intema et al. (2011) Intema, H. T., sumbitted
- Kale & Dwarakanath (2010) Kale, R., & Dwarakanath, K. S. 2010, ApJ, 718, 939
- Kempner et al. (2004) Kempner, J. C., Blanton, E. L., Clarke, T. E., Enßlin, T. A., Johnston-Hollitt, M., & Rudnick, L. 2004, The Riddle of Cooling Flows in Galaxies and Clusters of galaxies, 335
- Miller et al. (2003) Miller, N. A., Owen, F. N., & Hill, J. M. 2003, AJ, 125, 2393
- Röttgering (2010) Röttgering, H. J. A. 2010, ISKAF2010 Science Meeting
- Sarazin (2002) Sarazin, C. L. 2002, Merging Processes in Galaxy Clusters, 272, 1
- Sun et al. (2002) Sun, M., Murray, S. S., Markevitch, M., & Vikhlinin, A. 2002, ApJ, 565, 867
- van Weeren et al. (2009) van Weeren, R. J., Intema, H. T., Oonk, J. B. R., Röttgering, H. J. A., & Clarke, T. E. 2009, A&A, 508, 1269