TESTING WEAK LENSING MAPS WITH REDSHIFT SURVEYS: A SUBARU FIELD
Abstract
We use a dense redshift survey in the foreground of the Subaru GTO2deg2 weak lensing field (centered at = 16h04m44s; =43∘11′24′′) to assess the completeness and comment on the purity of massive halo identification in the weak lensing map. The redshift survey (published here) includes 4541 galaxies; 4405 are new redshifts measured with the Hectospec on the MMT. Among the weak lensing peaks with a signal-to-noise greater that 4.25, 2/3 correspond to individual massive systems; this result is essentially identical to the Geller et al. (2010) test of the Deep Lens Survey field F2. The Subaru map, based on images in substantially better seeing than the DLS, enables detection of less massive halos at fixed redshift as expected. We demonstrate that the procedure adopted by Miyazaki et al. (2007) for removing some contaminated peaks from the weak lensing map improves agreement between the lensing map and the redshift survey in the identification of candidate massive systems.
1 Introduction
Weak lensing maps and redshift surveys are fundamental, complementary tools of modern cosmology. A weak lensing map provides a weighted “picture” of projected surface mass density; a redshift survey provides a three-dimensional map of the galaxy distribution resolving structures along the line of sight within the broad window “imaged” by the lensing map.
Although galaxies are biased tracers of the mass distribution, comparison of a weak lensing map with a foreground redshift survey covering the appropriate range promises progress in resolving some of the issues limiting applications of weak lensing to the identification of mass-selected cluster samples. Here we focus on the use of weak lensing for identifying clusters of galaxies.
This paper is the second in a series comparing massive clusters identified in a dense foreground redshift survey with significant weak lensing map convergence peaks. In our first paper (Geller et al. 2010), we compared clusters identified in a Hectospec redshift survey (SHELS: Geller et al. 2005) with a Deep Lens Survey (DLS; Wittman et al. 2001) weak lensing map derived from deep Kitt Peak 4-meter observations. Here we describe a Hectospec redshift survey of the GTO2deg2 field where Miyazaki et al. (2002, 2007) used Subaru Telescope observations as the basis for their weak lensing convergence map. These two assessments of the efficacy of weak lensing for massive cluster identification provide insights into both the strengths and limitations of the technique.
Since the first identifications of rich clusters from weak lensing maps (Wittman et al. 2001; Miyazaki et al. 2002), the number of detections has risen steeply (Hetterscheidt et al. 2005; Wittman et al. 2006; Schirmer et al. 2007; Gavazzi & Soucail 2007; Miyazaki et al. 2007; Maturi et al. 2007; Bergé et al. 2008; Dietrich et al. 2008; Bellagamba et al. 2011; Shan et al. 2011). Geller et al. (2010) discuss the varying approaches and success rates of weak lensing surveys as rich cluster identifiers. Their comparison between clusters identified in the SHELS redshift survey and the DLS weak lensing map agrees with the more pessimistic observational and theoretical assessments of the technique (e.g. Hamana et al 2004; Hennawi & Spergel 2005; Schirmer et al. 2007; Shan et al. 2011). Geller et al. (2010) conclude that only 4 of the 12 significant DLS weak lensing peaks with signal-to-noise greater than 3.5 coincide with clusters massive enough to account for the lensing signal.
The SHELS/DLS weak-lensing purity for cluster detection is more pessimistic than many previous analyses at least in part because Geller et al. (2010) require that the velocity dispersion determined from the SHELS redshift survey be large enough to account for the lensing signal. Previous studies based on counts or photometric redshifts could not provide a velocity dispersion and often they could not distinguish between a genuine massive cluster and several groups embedded in the same large-scale structure or superimposed along the line-of-sight.
The underlying causes of the low purity of the DLS cluster candidate list are hard to identify from the single survey field Geller et al. (2010) studied. To gain further understanding of the relationship between clusters identified in a redshift survey and significant peaks in a weak lensing convergence map, we carried out a redshift survey of a second field. Our goal is an independent measurement of the completeness and purity of weak lensing maps in identifying massive clusters.
To explore the comparison of foreground redshift surveys with weak lensing maps further, we chose a weak lensing map and candidate halo list constructed by different observers on a different facility. The Subaru weak lensing survey (Miyazaki et al. 2002; 2007) provides an interesting comparison with the DLS because (1) Subaru is an 8.2-meter telescope , (2) the median seeing for the Subaru data was 0.66′′ in contrast with the 0.85′′ seeing for the DLS and (3) the algorithms for constructing the weak lensing map and for identifying significant peaks differ in the two projects. The typical number of sources in the Subaru map is 35 arcmin-2; in the DLS map it is 22.4 arcmin-2. At a fixed redshift within the lensing kernel of both surveys, the deeper Subaru map with observations in better seeing should correspond more closely to the set of massive systems in the redshift survey. Detections should be at higher signal-to-noise for systems of fixed mass at a fixed redshift. The Subaru map should also enable detection of less massive systems at a fixed redshift. We test these expectations here.
In Section 2 we discuss the history of related observations (Section 2.1) and we describe the redshift survey (Section 2.2). Our table of redshifts in the field includes 4405 new measurements with Hectospec (Fabricant et al. 1998, 2005). Next we describe the revised Subaru weak lensing map (Sections 3.1 and 3.2) and its sensitivity (Section 3.3). We sample the redshift survey in Section 4 and identify candidate clusters in the weak lensing map and in the redshift survey (Section 4.2). We discuss the completeness and purity of the weak lensing map in identifying systems of galaxies and compare it with our earlier results for the DLS field F2 in Section 5. We conclude in Section 6.
2 The Data
Miyazaki et al. (2002; 2007) used the 8.2 meter Subaru Telescope to carry out a weak lensing survey of thirteen well-separated fields covering a total of 21.82 deg2 . They used lensing convergence maps to identify 100 candidate halos with signal-to-noise 3.7; ten of these candidates are within the GTO2deg2 field we examine here. This published sample motivates our choice for the limiting significance of the weak lensing peaks to be explored with the redshift survey.
In the Miyazaki et al. (2007) GTO2deg2 field (centered at = 16h04m44s; =43∘11′24′′), our foreground redshift survey includes redshifts for 4549 galaxies and covers the entire 2.1 deg2 Subaru field. We follow the approach of Geller et al. (2010) and use the redshift survey as a route to examining the completeness and purity of the weak lensing map in identifying massive halos.
2.1 The Subaru GTO2deg2 Field: Imaging and Previous Spectroscopy
During the commissioning phase of Suprime-Cam on Subaru, Miyazaki et al. (2002) imaged part of a field studied years earlier by Gunn et al. (GHO: 1986). Here we review previous spectroscopic observations of clusters in this field.
In 1998, Postman et al. (1998) used the Keck to make both photometric and spectroscopic observations of the GHO cluster Cl 1604 + 4304 which lies within the GTO2deg2 field. The cluster is a centrally concentrated, rich system at a redshift with a rest-frame line-of-sight velocity dispersion of 1226 km s-1 (based on 22 members). The mass is M⊙. Lubin et al. (1998) carried out a morphological study of the cluster based on HST observations and later Lubin et al. (2004) used XMM-Newton observations to study its x-ray properties. Lubin et al. (2000) studied the clusters Cl1604 + 4304 and Cl 1604 + 4321 suggesting that they form a supercluster. The cluster Cl 1604 +4321 is at a redshift with a rest-frame line-of-sight velocity dispersion of 935 km s-1 and a mass of M⊙. Because of their substantial redshift, these clusters are beyond the range of sensitivity of the Subaru weak lensing map (see Section 3.2).
In 1999, Dressler et al. (1999) included the cluster Cl1601+42 in their spectroscopic catalog of 10 distant rich clusters of galaxies. Girardi & Mezzetti (2001) analyzed the redshift distribution for the 46 cluster members. They obtained a mean redshift of 0.54 and a rest frame line-of-sight velocity dispersion of 646 km s-1. They compute a cluster mass of M⊙. This cluster is within the sensitivity range of the weak lensing map and we compare these results with our own estimate in Section 4.2.
In contrast with the observations of small patches of the original GHO field geared toward studying individual clusters at reasonably high redshift, the wider field Miyazaki et al (2002) observation provides the basis for a weak lensing convergence map of the region. The weak lensing convergence map is sensitive to systems at lower redshifts ranging from to . In Section 4.2, we show that the cluster Cl1601+42 (previously studied by Dressler (1999) and Girardi & Mezzetti (2001)) appears as one of the two most significant peaks in the weak lensing map.
Hamana et al (2009) carried out multi-object spectroscopy along four lines-of-sight in the GTO2deg2 field. They observed with a single 6′ diameter slit mask in each of four patches and measured a total of 92 redshifts. On the basis of 15 of these galaxies coincident in redshift, SL J1602.8+4335 is a cluster at a redshift of 0.42 with a rest-frame line-of-sight velocity dispersion of 675 km s-1; this cluster is the other of the two most significant weak lensing peaks in the Miyazaki et al. (2007) map. We compare this measurement with our redshift survey results in Section 4.2 and Table 3.
2.2 The Hectospec Redshift Survey of the GTO2deg2 Field
We investigate the association between convergence peaks and clusters (halos) in the galaxy distribution based on a densely sampled redshift survey. Our goal is identification of the systems of galaxies that should produce a weak lensing signal. We thus seek to identify candidate systems in the redshift survey with rest frame line-of-sight velocity dispersion km s-1 consistent with the sensitivity of the Subaru map.
We constructed the galaxy catalog from the Sloan Digital Sky Survey (SDSS, Adelman-McCarthy 2008) r-band galaxy list for the GTO2deg2 field. The field covers the region and .
Because we seek to identify the massive systems of galaxies corresponding to the weak lensing peaks, we focus the redshift survey on the red galaxy population. These red objects preferentially populate clusters. This procedure also suppresses the blue foreground populations; the weak lensing map is insensitive to systems at redshift less than (see Figure 11).
We acquired spectra for the objects with the Hectospec (Fabricant et al. 1998, 2005), a 300-fiber robotic instrument mounted on the MMT from February 1, 2009 to April 27, 2009. The Hectospec observation planning software (Roll et al. 1998) enables efficient acquisition of a pre-selected sample of galaxies. The software allows assignment of priorities as a function of galaxy properties including apparent magnitude, color, and central surface brightness. We discuss the priority by color below.
The spectra cover the wavelength range 3500 — 10,000 Å with a resolution of 6 Å. Exposure times ranged from 0.75 — 1.5 hours. We reduced the data with the standard Hectospec pipeline (Mink et al. 2007) and derived redshifts with RVSAO (Kurtz & Mink 1998) with templates constructed for this purpose (Fabricant et al. 2005). Repeat observations yield robust estimates of the median error in where is the redshift and is the speed of light. For emission line objects, the median error (normalized by ) is 27 km s-1; the median for absorption line objects (again normalized by )) is 37 km s-1. (Geller et al. 2010; Fabricant et al. 2005).
There are 4541 galaxies in the region with a measured redshift; our Hectospec observations provide 4405 of these and the SDSS provides 136. In addition, we measured Hectospec redshifts for 54 of the 136 SDSS objects. The SDSS objects are brighter and at lower redshift than the others we observed with Hectospec. Table 1 lists all of the objects and their redshifts. The Table includes the SDSS ID (column 1), the J2000 right ascension (column 2), the J2000 declination (column 3), the SDSS Petrosian magnitude (column 4), the SDSS fiber color (column 5), the SDSS fiber color (column 6), the redshift (column 7), the redshift error (column 8), and the redshift source (column 9).
Our redshifts agree very well with the 54 objects in common with SDSS; these objects range in redshift from 0.019 to 0.468. At lower redshifts, the galaxies in common are emission line objects and at higher redshift they are from the SDSS red galaxy sample. The overlapping objects are brighter than the typical galaxy in our sample. The mean difference = 3.4 km s-1; the median difference is -0.8 km s-1. The dispersion around the mean is 36.8 km s-1.
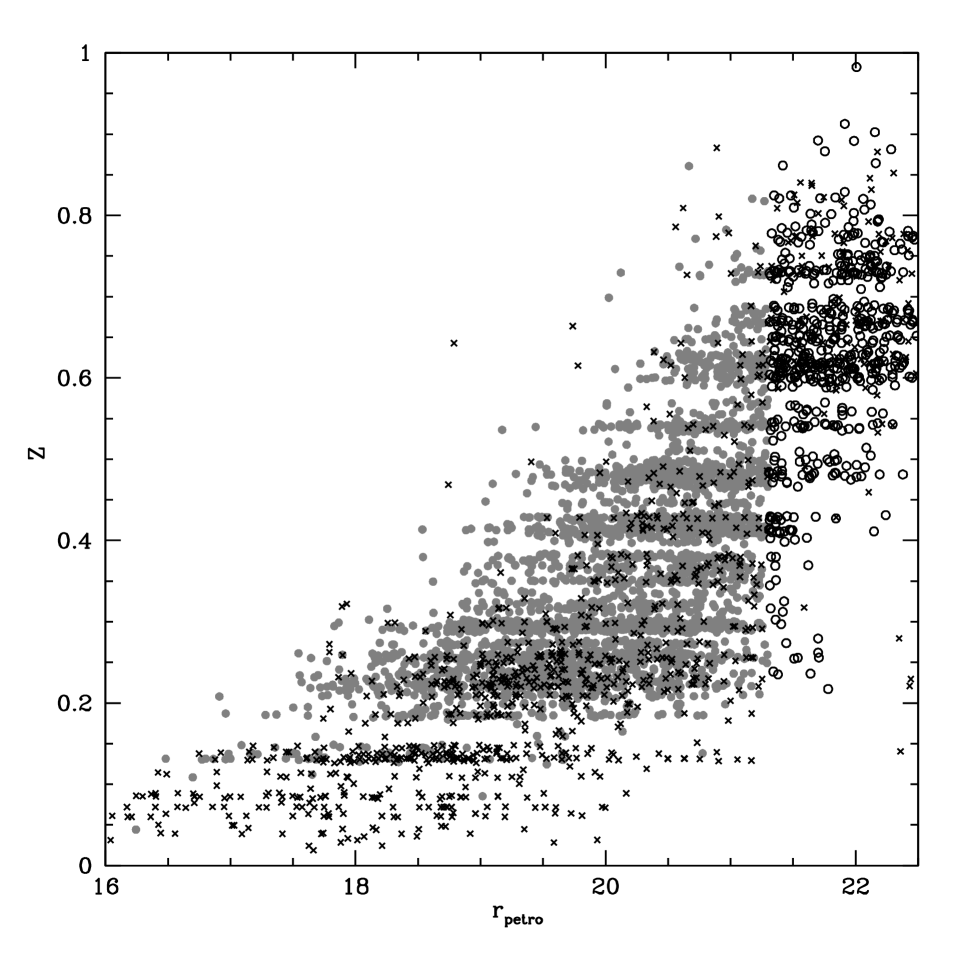
Our first priority targets in the GTO2deg2 field are galaxies with , and . The bright limit is the SDSS completeness limit ( = 17.77); we observe only fainter galaxies for efficiency. Our target selection yields 3992 objects. In this subsample, we obtained spectra for 3021 galaxies and 149 stars. In the original selection, we include everything the SDSS classifies as a galaxy; spectroscopy shows that this selection includes some stars. Among the remaining 822 objects without spectroscopy, we expect stars. The integral completeness is thus . Figure 1 shows that the differential completeness drops to at .
In Figure 2 the open circles show the positions of galaxies within the primary sample with (upper panel) and without (lower panel) a redshift. The pattern of incompleteness is a natural consequence of the fiber positioning constraints. Figure 2 also shows the positions of the 6 robust convergence map peaks (see Section 3.2 and Table 3). Note that the numerical designations of the robust peaks are not sequential because there are peaks of intervening rank that are not secure (Section 3.2).
Our secondary targets are (i) galaxies with , , ranked by central surface brightness and (ii) bluer objects with . We observe the objects with beginning with the highest surface brightness objects. The lower panel of Figure 3 shows the distribution on the sky of the 546 faint red galaxies with redshifts. The upper panel shows the distribution on the sky of the 974 bluer objects with a redshift. The faint red objects are reasonably uniform across the field; the blue objects are concentrated toward the center of the field as a result of the positioning of the Hectospec fields. Covering the edges of the field is relatively inefficient because the 1 degree diameter Hectospec field overlaps the boundary.
Figure 4 shows the distribution of apparent magnitude, , for all of the galaxies with measured redshifts. Different symbols indicate the three subsamples. At every redshift the redshift survey samples more than a one magnitude range in .
Figure 5 shows the redshift distribution for the entire GTO2deg2 field survey and for the primary target sample. The median redshift for the primary target sample of 3025 galaxies is 0.336; for the entire sample, the median redshift is 0.349. The galaxies with populate the high redshift range and the SDSS galaxies fill in the survey at low redshift. The sharply defined peaks are the expected signature of the large-scale structure of the universe.
Figure 6 shows cone diagrams for the survey. Obvious voids are delineated by walls and filaments. The contrast between the voids and the surrounding structure is enhanced relative to a redshift without color selection for red galaxies. The red galaxies are more clustered and preferentially populate more dense regions. Fingers extending along the line-of-sight corresponding to massive clusters of galaxies are evident by eye at and at . In Section 4.2 we show that these two prominent systems correspond to the two most significant weak lensing peaks.
3 The Weak Lensing Convergence Map
We now proceed toward testing an updated version of the Miyazaki et al. (2007) GTO2deg2 convergence map against our dense redshift survey covering the entire field. The redshift survey generally enables separation between massive clusters and superpositions along the line-of-sight and provides an objective test of the fraction of weak lensing peaks that correspond to massive systems. In principle, the redshift survey identifies massive systems undetected in the convergence map.
We reconstruct the weak lensing map of the Miyazaki et al. (2007) GTO2deg2 field to take advantage of improvements in the Suprime-Cam reduction software and to refine the procedures we used to construct the map. We adopt mean stacking of the raw images rather than the median stacking adopted by Miyazaki et al. (2007). This revised procedure reduces the effect of variations in seeing from one frame to another. Otherwise we reduce the raw images as fully described in Miyazaki et al. (2007).
We describe the construction of the stacked images including steps taken to improve the PSF correction in Section 3.1. We describe the construction of the new shear map and the B-mode systematic tests in Section 3.2. We model the expected sensitivity of the map to massive systems of galaxies in Section 3.3.
3.1 Updated Images and PSF Correction
The GTO2deg2 field consists of 9 Suprime-Cam pointings acquired on April 18-25, 2001. The exposure time varies from subfield to subfield. When possible for a subfield, we select the best seeing images with summed exposure time of at least 2000 seconds. We use all the exposures regardless of seeing for those fields where the total exposure time is less than 2000 seconds. The exposure time per field for the stacked images ranges from 1800 seconds to 2400 seconds. The median seeing for the 9 frames ranges from 0.64′′ to 0.77′′ with an overall median of .
The reductions mainly follow the prescription given in Miyazaki et al.(2007). The primary source of systematic error in the shear maps comes from the spatial variation in the PSFs. Raw images from Suprime-Cam show systematic patterns in the shapes of stars, primarily at the corners of the field. We use a polynomial fit for the PSF ellipticity components of stars as a function of their position in the image (see Miyazaki etal. 2007). Figure 7 shows the whisker plot of the ellipticity of stars (selected according to their position in a size-magnitude diagram) as a function of pixel position in a subfield of the GTO2deg2 region.
We construct an astrometric distortion solution for each chip by comparing the pixel coordinates of 70-100 comparison stars with their coordinates on the reference exposure. This distortion solution takes into account the camera distortion (a radial function of distance from the optical axis) and displacements and rotations of individual detectors compared to their fiducial positions. Because this astrometric correction still yields residuals too large for accurate image stacking, we calculate a residual distortion. We fit a second order polynomial to the residual distortions in object positions between the reference exposure and each subsequent exposure.
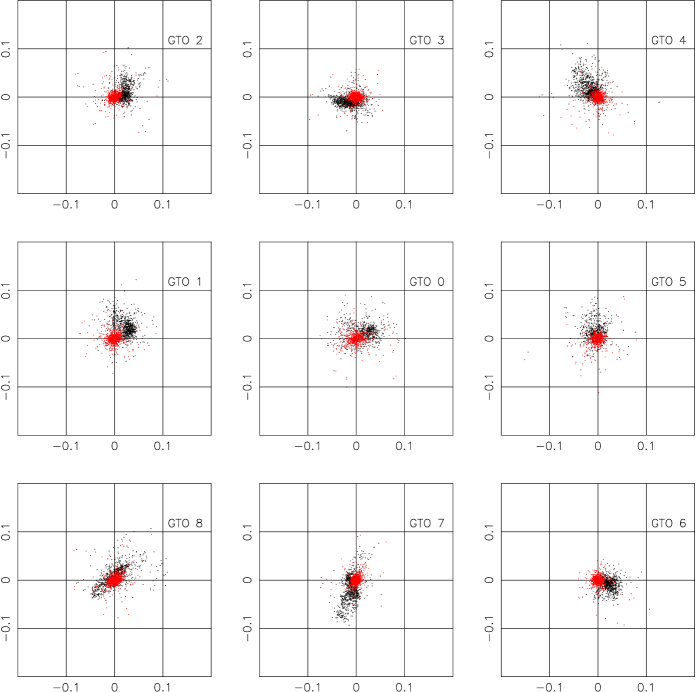
After we have corrected for the residual PSF ellipticity we obtain the residual pattern in Figure 7. The systematic pattern is corrected on scales larger than the arcminute scale probed by the stars. Another way of showing the effect of this correction is to measure the distribution of , for stars in the subfields. Figure 8 shows the ellipticity components of stars in the nine subfields of the GTO2deg2 field, both before and after correction. The PSF correction removes systematic ellipticities (offsets from the origin in (,) space) along with most of the PSF error anisotropy (deviation from uniform scatter in all directions). The remaining PSF anisotropy error probably results from the residual PSF errors on scales smaller than clusters of galaxies. Averaging over the larger cluster scale reduces the impact of these errors on cluster detection. They do not contribute significant bias in cluster identifications.
We finally stack the registered images by averaging the pixel values for all unmasked exposures at each pixel. The ellipticities of the stars identified on the stacked exposures are consistent with those on the individual exposures.
3.2 An Updated Convergence Map
To construct the convergence map, we use all galaxies with 23 26 that are detected at significance as sources. On average there are 35 sources arcmin-2; a total of 254,010 sources meet our cuts. To derive the ellipticities of the sources, we use the routines getshapes, efit, and ecorrect in the imcat package (Kaiser, Squires & Broadhurst 1999: KSB).
From the shears, we construct lensing maps using a modified version of the KSB algorithm (Hoekstra et al. 1998). First, we measure the size and ellipticity of all the stars identified in the stacked images. We then use a second order polynomial function in pixel and coordinates to fit for the PSF size and ellipticity in each subfield image. This procedure yields an estimate of the PSF size and shape at each galaxy position, and, therefore, the stellar shear and smear polarizabilities, and , respectively.
To calculate the PSF shear and smear polarizability appropriate for each galaxy’s position and size, we first calculate the polarizability tensor for a set of Gaussian kernels with FWHM ranging from 0.8″ to 4.0″ (in increments of 0.8″). At each position, we calculate the appropriate polarizabilities and by linear interpolation of the polarizability components for the kernels that bracket the galaxy size. We can thus calculate the induced polarizability of the galaxy as (Hoekstra et al. 1998; KSB)
Because can be affected by uncertainty in the size determination of individual galaxies, our corrected shear measure for each galaxy is
where is the measured ellipticity and orientation of the galaxy and is the average polarizability of the 20 nearest neighbors to each galaxy we consider.
Once we have produced a map from the shear distribution, we estimate a noise map by taking the variance over 100 realizations of the map. In each realization, we randomize the orientation of the galaxies (leaving their positions fixed) and regenerate the map. We show the -S/N map (the map divided by the variance map) in Figure 9.
We next use Sextractor to identify peaks in the -S/N map. The pixels in the map are , and we use a smoothing kernel with a FWHM. A peak must have at least 3 connected pixels significant at the 2 level or more to be selected; is the variance in the -S/N map.
The numbers in Figure 9 are the significance rank of the 11 peaks we find. Table 3 lists the significance of all of these 11 peaks with signal-to-noise greater than 3.7 or, equivalently with . As in Miyazaki et al. (2007) we remove peaks within 4′ of bright stars (USNO B1.0 R or B) or within 2.7′ of the edge of the field; we remove peaks 2, 4, 5, 6 and 8 for these reasons. Interestingly, we show below (Section 4.2) that these unreliable peaks do not correspond to any systems in the redshift survey.
Although we have demonstrated that our PSF correction algorithm successfully removes the errors introduced into the PSF at the position of the stars, there is still the possibility that systematic errors affect the shape determinations at the positions where the shears are being measured (i.e. at the positions of the galaxies). To test the possibility of remaining bias in the PSF, it is customary to make shear maps using the 45-degree-rotated component rather than the tangential component of the ellipticity tensor, or, equivalently, by rotating all galaxy orientations by 45 degrees. This “B-mode” map is important because weak lensing shears do not induce any signal in the 45-degree-rotated ellipticity components. On the other hand, systematic errors in shape measurements should affect both components of ellipticity equally. As a result, the level of signal in the B-mode map is a good indication of the level of spurious signal in the shear or (E-mode) map. We use the noise map discussed above to normalize the B-mode map. Because the shuffling of the shape assignments randomly mixes ellipticity components, use of the same noise map is an appropriate normalization for both the convergence and B-mode maps.
In Figure 10 we show the B-mode map for the GTO2deg2 field, with signal-to-noise contours constructed in the same way as for the -S/N map (Figure 9). We use the same peak-finding algorithm as we do on the -S/N map to uncover peaks in the B-mode map. The highest peak in the B-mode map has a signal-to-noise level of . We list the coordinates and significance of the four highest B-mode peaks in Table 4; these peaks have . It is interesting that Shan et al. (2011) find a similar number of high significance peaks per unit area in this significance range in their B-mode maps derived from CFHT data (see their Figures 14 and 15). One of the high significance B-mode map peaks is obviously contaminated by a nearby bright star (Table 4).
The B-mode map suggests that we set our threshold for reliable cluster detection at rather than the of Miyazaki et al. (2007). We consider peaks in the -S/N map with as an independent test of the implications of the B-mode map. In essence, Shan et al. (2011) make a similar test by examining the purity of the sample of peaks in their E-mode map as a function of .
3.3 Modeling the Sensitivity of the Convergence Map
As an additional basis for examining the completeness and purity of the weak-lensing selected cluster catalog derived from the map, we estimate the expected sensitivity limits of the convergence map as a function of redshift. For any individual background galaxy in the weak lensing limit, the induced measured tangential ellipticity (and hence the S/N for detection) depends on both the angular diameter distance to the galaxy and on the size of the galaxy relative to the PSF. For a collection of galaxies, the effective total weight as a function of redshift is a polarizability-weighted sum over the individual distance ratios. The effective distance ratio for the ensemble of background galaxies is
| (1) |
where the subscripts and refer to the sources and lens, respectively. is the weight of each source galaxy (which depends on the object size), is the lens redshift, is the angular diameter distance between and , (the ratio is zero if ), and the sum is over all sources. For a realistic survey an additional suppression results from misidentification of faint foreground galaxies, each of which should have weight zero.
One of the advantages of Subaru data we use here compared to other deep ground-based surveys comes from the improved seeing. In a typical deep ground-based image where the stellar PSF is ″, up to half the galaxies detected at significance are unresolved (with size less than (Kubo et al. 2009 )). The images of the GTO field were taken in better seeing (median seeing 0.66″). With this image quality, % of the galaxies at the object depth cutoff are resolved from stars.
For each redshift, we compute the angular diameter distance factors in equation (1) assuming the “concordance” cosmology (Spergel et al. 2007). We derive the terms using data from the COSMOS Subaru galaxy catalog (Taniguchi et al. 2007) and the COSMOS ACS catalog (Leauthaud et al. 2007). The COSMOS combined ACS/Subaru dataset is currently the best dataset for this calibration because it covers by far the largest area with both ground- and space-based resolution to faint limiting magnitude. In addition, the Subaru multi-color observations provide photometric redshift estimates (Mobasher et al. 2007) for the majority of galaxies in the survey area. We use the COSMOS catalog size and photometric redshift information to estimate the redshift distribution of the galaxies that would be resolved in our weak lensing map.
We match galaxies in the COSMOS Subaru and ACS catalogs with the additional requirement that the catalog I magnitudes match to within 0.3 (This restriction eliminates errors in matching the two catalogs; it also eliminates most objects that cannot be adequately separated from neighboring objects in the Subaru imaging). Because the Subaru images of the COSMOS field were taken in comparable seeing (median seeing 0.55″), this procedure should not alter the COSMOS sample compared with the Subaru sample. The final catalog contains approximately 124,000 objects with magnitudes, sizes, and photometric redshift estimates.
The galaxy catalog of the GTO2deg2 field has sizes and magnitudes (RC magnitudes; Miyazaki et al. 2007), but not photometric redshifts. To assign redshifts to the galaxies, we assign to every galaxy in the GTO2deg2 field the redshift of a randomly selected galaxy in the COSMOS catalog with the same magnitude and (seeing-deconvolved size), where the list of of galaxies is taken from all the galaxies that match to within 0.05″ in size and within 0.1 magnitudes. Although this procedure does not necessarily assign the correct redshift to any single galaxy, it assigns the correct distribution of galaxy redshifts given the size and magnitude distribution of the galaxies in the GTO2deg2 field, and thus a correct effective total weight via equation (1). Given this catalog of redshifts (which by construction has the same number of objects and the same size distribution as the one used in the construction of the lensing map), we calculate the effective weight that would be measured as a function of lens redshift.
We normalize the redshift dependence of our sensitivity by comparing to simulations. To minimize the calculations, we normalize to the sensitivity at a fixed cluster redshift of 0.3, and use the calculation of to calculate the redshift-dependence of the sensitivity curve. We follow a modified version of the procedure for generating simulated catalogs in Khiabanian & Dell’Antonio (2008). We generate simulated galaxies with the same size-magnitude and magnitude-redshift relations as the HDF North and South fields (Williams et al. 1996; Casertano et al. 2000) using the prescription of Khiabanian & Dell’Antonio (2008). We use these simulated galaxies to populate images (0.04″ resolution) representing seven logarithmically-spaced redshift shells. We then distort the images with a lens modeled as a core-softened cutoff isothermal sphere with a given rest frame line-of-sight velocity dispersion, , a 1′′ core radius, and a 100′′ cutoff radius.
We resample the distorted images with the Subaru pixel scale (0.2″/pix), coadd them, and convolve with a Gaussian PSF with a 0.66″ FWHM and add noise to match the expected noise in the Subaru GTO observations. We repeat this procedure for different values of (at a fixed ) to generate maps of the weak lensing signal. We run the Kubo et al. (2009) detection method on these images to determine the value of where the peak S/N reaches our cluster selection limit. In Figure 11, we plot the detection limit as a function of redshift (); the solid line represents the cutoff in the lensing peak selection sample.
Our method of calculating the sensitivity fails at low redshift , because the simulation method of Khiabanian & Dell’Antonio (2008) underpredicts the significance of clusters that occupy a large angular region. However, because none of the GTO2deg2 field clusters have , the comparison of sensitivities is valid.
There are some fundamental limitations to the accuracy of the calculations. First, lensing is sensitive to structures projected along the line-of-sight (Hoekstra et al. 2001; White et al 2002; de Putter & White 2005; Hoekstra et al. 2011). The increase in the scatter of the shear measurements is for a generic cluster where the distribution of the large-scale structure around the cluster is unknown. For the purposes of our study, this effect may boost marginal peaks above the threshold. We do not use the significance of the peaks to measure the mass and the redshift survey directly reveals a subset of the intervening structures.
As a result of cosmic variance, the actual number and redshift distribution of the background galaxies behind any cluster may not be well-represented by our model. For clusters near the detection limit, the shear signal is based on the shapes of only galaxies. On the scale of this small field, non-uniformities in the distribution of the background galaxies are important. For larger samples, Hoekstra et al (2011) show that this issue is less important. Our detection sensitivities should be viewed as averages of the sensitivity across the field rather than the exact sensitivity to any one cluster at any particular position in the field.
Although the COSMOS/Subaru field is extremely valuable, it covers square degree of the sky. Therefore, any systematic differences between the properties of the COSMOS field and GTO2deg2 can change the normalization. One of the results of the analysis of the DLS (Geller et al. (2010)) and the GTO2deg2 field (this work) is that there are large field-to-field variations in the types and amount of structure present at all measured redshifts even on degree-sized angular scales. Thus, although the COSMOS field is currently the best field for calibrating weak lensing detections, larger fields will be necessary.
4 Probing the GTO2deg2 Field Redshift Survey
To evaluate the correspondence between systems in the redshift survey and significant peaks in the convergence map, we follow the approach of Geller et al. (2010) for sampling the redshift survey. We examine the redshift distribution in cones with radii of 3′ and 6′. The 3′ sampling is similar to probes used in previous assessments of the purity of weak lensing based on counts (Schirmer et al. 2007), photometric redshifts (Gavazzi & Soucail 2007; Shan et al. 2011) and spectroscopic redshifts (Geller et al. 2010). The combination of 3′ and 6′ probes samples the virial radii of massive clusters throughout the redshift range where we might expect the convergence map to detect these systems.
The 3′ radius corresponds to 0.45 Mpc for and to 1.1 Mpc for . These radii are within r200, the radius where the enclosed average mass density, . Here is the critical density. The radius , a proxy for the virial radius, ranges from 1.0 to 2.0 Mpc for well-sampled clusters with rest frame line-of-sight velocity dispersions in the range 500 km s-1 to 1000 km s-1 (Rines et al. 2003; Rines & Diaferio (2006)). According to the scaling relations of Rines & Diaferio (2006), the corresponding range of masses, M200, within r200 is 1.3 M⊙ to 1.2 M⊙.
We assess the completeness of the set of massive clusters among the high confidence weak lensing candidate systems. We define completeness as the fraction of all clusters in the foreground redshift survey with line-of-sight velocity dispersions above the threshold curve that also correspond to weak lensing peaks with . In other words, the completeness is the fraction of appropriately massive individual systems in the redshift survey that are detected as weak lensing peaks.
We also estimate the purity of the convergence map in the identification of massive cluster halos. Here we define purity as the fraction of convergence map peaks with that correspond to an individual massive cluster identified within the redshift survey with a line-of-sight velocity dispersion above the solid threshold curve of Figure 11. In other words, the purity is the fraction of weak lensing peaks that correspond to appropriately massive individual systems.
The definitions of purity and completeness exclude superpositions of small groups from consideration. These superpositions may indeed produce a weak lensing signal, but the weak lensing peak should obviously not be counted as detection of a single massive system in a mass selected cluster catalog. The definitions also exclude coincidences between the abundant low velocity dispersion systems in the redshift survey with convergence peaks. Our definitions are similar to those adopted by Hamana et al. (2004) in their simulations of the purity and completeness of weak lensing surveys for massive cluster identification.
4.1 Evaluating Convergence Map Peaks with a Foreground Redshift Survey
Schirmer et al. (2007), Gavazzi & Soucail (2007) and Shan et al. (2011) use uniform procedures for evaluating the coincidence of concentrations of galaxies with convergence map peaks. Their approaches are based on complete photometric surveys of their fields. They evaluate the significance of cluster candidates internal to their surveys. Geller et al. (2010) develop an analogous approach for evaluating the coincidence of concentrations of galaxies in a foreground redshift survey with convergence map peaks. Here we follow the Geller et al. (2010) approach.
Because the redshift survey is substantially complete we can sample the survey itself to evaluate the significance of galaxy condensations along the line-of-sight to lensing peaks. The sensitivity plot (Figure 11) suggests that we need not look deeper than to identify clusters corresponding to the three weak lensing peaks with in the Subaru weak lensing map. The most distant systems must be very rich and they should be obvious in the photometric data. We use the RC-band counts in the image to check for such distant systems.
We examine the faint Subaru RC band counts (Miyazaki et al. 2007) in the range by binning the data in 0.3′ bins and smoothing the map of counts with a 1.5′ Gaussian (the same smoothing and pixel scale as the Subaru weak lensing map). The range in apparent magnitude just overlaps the magnitude limit of our main redshift survey sample. The binning and smoothing lengths are essentially the same as those for the weak lensing map. We define as the standard deviation of the pixel value in the map of counts and we note peaks that rise above the median as corroborating evidence for systems of galaxies along the line-of-sight toward weak lensing peaks and/or as evidence for systems beyond the reach of the redshift survey. Table 3 indicates the lensing peak directions where there is a count excess. All three peaks with correspond to count excesses.
Probes through the redshift survey centered on each galaxy in the survey contain many of the selection effects which impact a probe toward a lensing peak. Thus comparison of these probes with similar probes toward the peaks should provide a measure of the significance of cluster candidates in the redshift survey. We have demonstrated by experiment that centering of probes on galaxies or on random points in the region has no effect on the results of our analysis.
The steps in our candidate cluster identification procedure are:
-
1.
We sample the redshift survey in test cones with 3′ radius centered on each galaxy in the redshift survey. The cones are large enough to detect a galaxy cluster across the redshift range we sample.
-
2.
In each test cone we count the number of additional galaxies, Ngal, within of the survey galaxy redshift. This window is comparable with the extent in redshift space of systems we wish to identify.
-
3.
In each of the redshift bins of item 2, we evaluate the mean occupation and the variance () across the entire survey. We then identify the set of test cones at each redshift which are 5 above the mean occupation and contain at least 5 galaxies (N). The minimum number of galaxies enables computation of a dispersion (albeit with large error). The 5 limit restricts the sample to high peaks which are reasonable candidate clusters especially at the peak sensitivity of the weak lensing map, . Both the 5 galaxy and 5 limits are generous; they admit many peaks well below the expected detection threshold for the weak lensing map (Figure 11). We call these probes 5 probes hereafter.
-
4.
As a final consistency check we examine the Subaru images for evidence of a massive system. We consider two indicators: (1) an excess in the count of galaxies with 21, and (2) the presence of a visually identifiable red sequence.
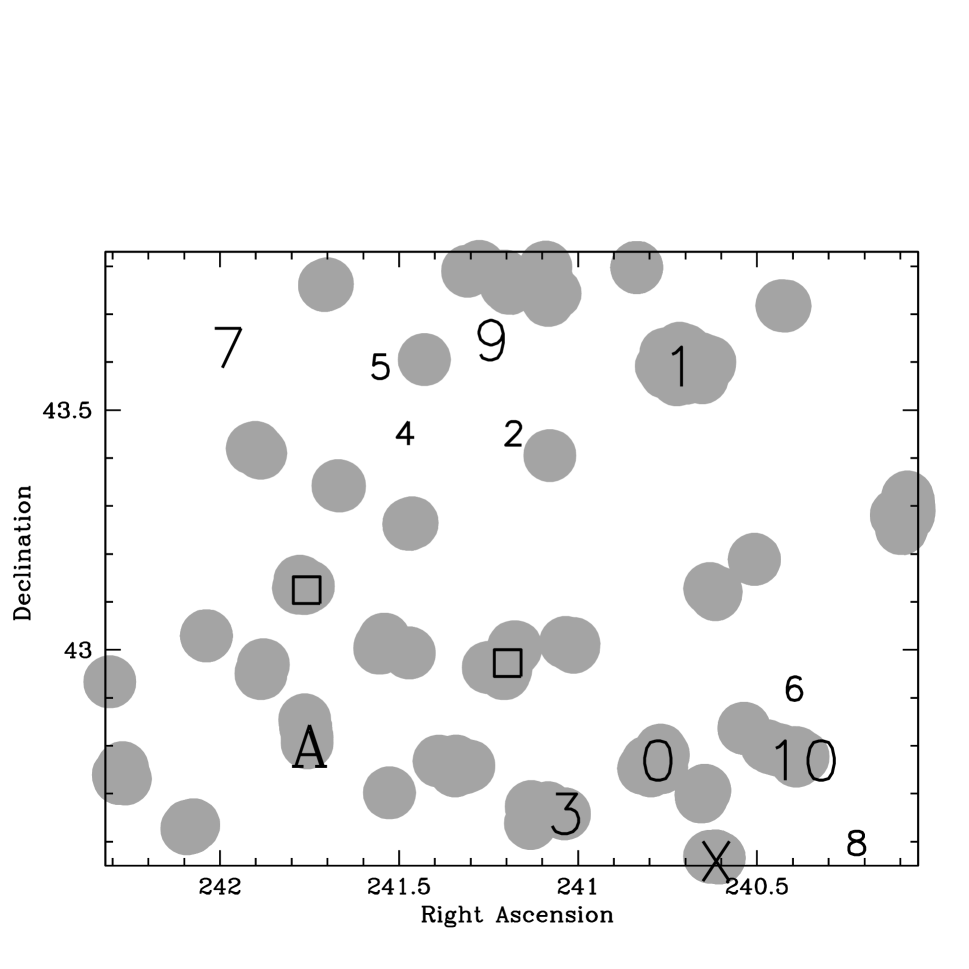
In Figure 12 the two most significant weak lensing peaks (labeled 0 and 1) are coincident with two well populated clusters. These two clusters appear as prominent “fingers” at redshift 0.540 and 0.413, respectively, in Figure 6.
There are obviously many well populated 5 probes without any associated significant weak lensing peak. Many of the well-populated redshift survey probes correspond to groups with small velocity dispersion. From Figure 11 we would not expect these systems with rest frame line-of-sight velocity dispersion km s-1 to produce a significant signal in the map. There are also weak lensing peaks with no corresponding peak in the redshift survey. It is interesting to note that none of the 5 unreliable peaks in Table 3 (starred entries) coincide with well-populated probes in the redshift survey; removal of these unreliable peaks from consideration evidently increases the purity of the lensing map. Three of these unreliable peaks are above the threshold.
To further assess the meaning of the weak lensing peaks we examine the redshift distributions along the line-of-sight toward significant weak lensing peaks. We ask which lines-of-sight intersect a cluster with a velocity dispersion large enough to plausibly account for the weak lensing peak (Section 4.2).
4.2 Convergence Map Peaks and Candidate Clusters
In this section we evaluate candidate systems along the line-of-sight toward the 6 uncontaminated GTO2deg2 weak lensing peaks with in the revised Subaru weak lensing map (Section 3.2). The extension to the lower original significance limit of Miyazaki et al. (2007) is a consistency test of the implication of the B-mode that the threshold should be higher and that most of the peaks in the interval may be spurious (see e.g. Geller et al. 2010; Shan et al. 2011) This test can only be carried out with an independent survey.
Occasionally a bright star can be accidentally superimposed near a massive cluster of galaxies or a cluster may be located near the edge of the survey field. We remove 5 weak lensing peaks that we regard as contaminated or, equivalently, unreliable because they are near a bright star or because they are too close to the survey boundary. Neither the redshift survey nor the faint galaxy counts reveal any candidate systems along the line-of-sight toward any of these peaks. Figure 13 shows two examples of the redshift distributions toward these peaks; there are no candidate massive systems. The groups in the probe have rest frame line-of-sight velocity dispersions km s-1. Histograms for the other 3 contaminated lensing peaks are similar.
The presence of high significance a priori unreliable peaks demonstrates that identifiable systematic effects can produce spurious high significance peaks in the weak lensing map. Identification and removal of these unreliable contaminated peaks substantially increases the fidelity of the weak lensing map as a route to identifying massive systems of galaxies.
Figures 14 and 15 show the redshift distribution within 3′ of the central position of each of the six uncontaminated candidate halos with . Figure 14 shows the three peaks with ; Figure 15 shows the three peaks with . The dark histogram shows the redshift distribution in bins of 0.002(1+). The thin histogram shows the redshift distribution in a concentric cone with a radius in each of the candidate halo directions.
The probes toward peaks 0 and 1 in Figure 14 each contain an impressive peak. These peaks correspond to obvious “fingers” in redshift space (Figure 14). The rest frame line-of-sight velocity dispersions of these systems within a 6′ probe are, respectively 57664 km s-1 and 59858 km s-1 in agreement with previous measures (Dressler et al 1999 (peak 0); Hamana et al. 2008 (peak 1); see Section 2.1). Table 3 provides the number of galaxies and the rest frame line-of-sight velocity dispersion for both 3′ and 6′ probes. The rest frame line-of-sight velocity dispersions for these two clusters places both of them very near the detection threshold. Counts of faint galaxy within these probes show a excess as one might expect (see Table 3).
Weak lensing detections of these clusters may be boosted by the obvious superposed structures in the redshift survey (Hoekstra et al. 2001; White et al 2002; de Putter & White 2005; Hoekstra et al. 2011). We note that the weak lensing map detects the clusters corresponding to peaks 0 and 1 at high significance . However for , our predicted velocity dispersions for these peaks exceed the measured values by only 20-30%. The 1 errors in the velocity dispersions are %. Thus we cannot draw any definitive conclusion for this apparent difference between the measured velocity dispersion from the redshift survey and the weak lensing sensitivity analysis.
The probe toward weak lensing peak 3 shows a more complex situation. There are two significant peaks in the histogram, one at and the other at . The line-of-sight velocity dispersions are 567 km s-1 and 558 km s-1, respectively within 3′ probes; the rest frame line-of-sight velocity dispersions are systematically smaller in the 6′ probes, but the errors are large. The faint galaxy counts show an excess (Table 3), probably resulting from the more distant system. Both systems may contribute to the lensing signal. We conclude that the purity for is 2/3.
In Figure 15, probes toward weak lensing peaks 7 and 9 reveal no candidate systems. Figure 12 shows that neither of these peaks overlaps a well-populated probe through the redshift survey. Furthermore, there is no excess in the faint galaxy counts.
Along the line-of-sight toward weak lensing peak 10 (Figure 15), there are several narrow peaks corresponding to superposed groups along the line-of-sight. There is a group at with a velocity dispersion of 545 km s-1 within a 6′ probe. We identify only 6 members of this system. The velocity dispersion of this system places it near the detection threshold albeit with a very large error. The most populated system along this line-of-sight (as a result of the selection function of the survey) has a mean redshift and a line-of-sight velocity dispersion of 404 km s-1. This system corresponds to a MaxBCG cluster (Koester et al. 2007) at , with a quoted photoz of 0.254 and a BCG spectroscopic redshift of 0.208. This system may enhance the lensing signal from the more distant system. There is a faint count excess in this direction Table (3).
In the B-mode map there are 3 uncontaminated peaks with ; in the -map there are also 3 uncontaminated peaks. At most one of the -S/N map peaks in this significance range corresponds to a rich system of galaxies or, more probably, a superposition along the line-of-sight, consistent with expectations based on the B-mode map. Geller et al (2010) and Shan et al (2011) also find that the purity of weak lensing candidate halo samples declines with decreasing significance probably consistent with expectations based on the B-mode maps.
As another test of the nature of the weak lensing map, we examine probes through the redshift survey toward the two well-populated positions indicated by heavy squares in Figures 9 and 12. In the weak lensing map, there are no peaks significant at that are coincident with these redshift survey positions. Figure 16 shows probes through the redshift survey in these two directions. By selection, the probes contain more galaxies than the probes toward the spurious weak lensing peaks 7 and 9 with . They are populated by a superposition of groups with line-of-sight velocity dispersions km s-1.
In summary, the 3 weak lensing candidate halos with yield a sample of 2 rich clusters associated with peaks 0 and 1 and a superposition associated with peak 3. Thus even at this high threshold, the purity is 2/3. for comparison, using the same approach, the purity of the DLS is 3/3 for (Table 2; Geller et al. (2010)). Of course, the uncertainty in these consistent results is large because of the small samples of peaks.
4.3 Completeness and Additional GTO2deg2 Redshift Survey Candidate Clusters
The redshift survey provides a route to identifying candidate galaxy systems undetected by the weak lensing map. It thus provides some assessment of the completeness of the cluster candidate list derived from the weak lensing map. There are many approaches to identifying candidate systems in the redshift survey. For consistency we use redshift survey probes to identify systems in the same way that we use them to test for systems along the line-of-sight toward weak lensing peaks. We restrict the analysis to systems that should be detected at or above our 4.25 threshold.
Figure 12 shows the positions of all of the 5 probes through the redshift survey; these probes contain a well-populated redshift bin (see Section 4.1). Of course the bins are large enough that they may contain a superposition of poor groups rather than a richer system. We compute line-of-sight velocity dispersions for the peaks within each probe. In addition to the clusters corresponding to weak lensing peaks 0 and 1, we find only one additional concentration in redshift space that corresponds to a massive system.
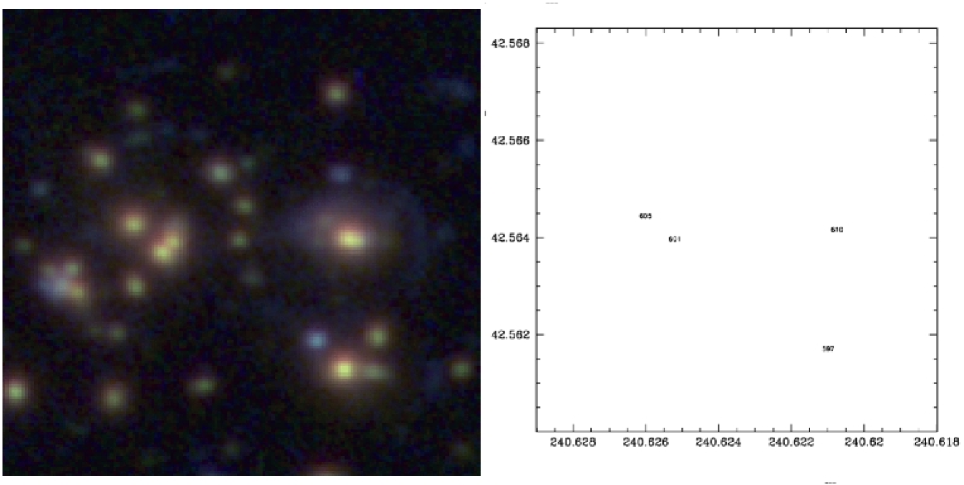
The cluster we identify from the redshift survey at has an impressively dense central region and the Subaru image reveals at least one faint strong lensing arc (Figure 17). Detection in the weak lensing map is compromised because the cluster center ( = 240.62; = 42.57) is only arcminutes from the edge of the field. The weak lensing map does have a peak coincident with this cluster at a significance (We list this cluster along with an estimate of its line-of-sight velocity dispersion as the last entry in Table 3).
Examination of the well-populated redshift survey probes also reveals a dense system with a rest frame line-of-sight velocity dispersion of 41924 km s-1 and a mean redshift of 0.185 based on 23 members within 6′ of the cluster center ( = 241.76, = 42.80). This system is obvious as a short, well-defined “finger” in Figure 6. We identify it with the richness class zero Abell cluster 2158 (A2158C: Struble & Rood 1999; see also Abell 1958). Foreground groups at a redshift have confused the identification of this system in the past. In the lensing map this cluster appears below our detection threshold; it is coincident with a weak lensing peak significant at . (We list this cluster as the next to last entry in Table 3).
Other than the clusters corresponding to weak lensing peaks 0 and 1, we identify no clusters in the redshift survey that should produce a weak lensing signal . Thus, the set of cluster detections appears to be complete.
5 Comparing the Weak Lensing Sensitivity of the GTO2deg2 and DLS F2 Fields
The effects of atmospheric seeing are a challenge in constructing weak lensing maps (Schneider 2006). Because the source galaxies are small compared with typical atmospheric seeing, the signal-to-noise of a weak lensing map is sensitive to the seeing. Schneider emphasizes the importance of good seeing for the determination of source ellipticities once a PSF correction is made. Schneider (2006) argues that at fixed redshift, a shallower map with better seeing should enable weak lensing detection of lower mass (lower velocity dispersion) systems compared with a deeper map in less good seeing. We examine that conjecture next.
The GTO2deg2 field consists of subfields with a 30-40 minute exposure on the Subaru 8.2-meter telescope in 0.66′′ seeing; the DLS F2 field is a 5-hour exposure on the KPNO 4-meter in 0.85′′ seeing. Figure 18 compares the weak lensing sensitivity of the two fields. The curves show the rest frame line-of sight velocity dispersion for a system which could be detected at a at each redshift. At every redshift, the Subaru observations have the potential to yield a detection at a lower line-of-sight velocity dispersion. The maximum sensitivity is shifted toward greater redshift for the Subaru data. Table 2 shows the substantial difference in the number of resolved sources for the two weak lensing maps: 22.4 arcminute-2 for the DLS and 35 arcminute-2 for the GTO2deg2 field. Table 2 lists other relevant parameters for the two surveys. In constructing Table 2 we have reevaluated the DLS F2 results of Geller et al. (2010) using a rather than a threshold for selecting significant peaks in the weak lensing map. We have also included the Miyazaki et al. (2007) procedure for removing unreliable, but apparently high significance weak lensing peaks.
Figure 18 also shows the rest frame line-of-sight velocity dispersions for single massive systems in the foreground redshift surveys corresponding to weak lensing peaks with 4.25 in both surveys. The most telling and suggestive difference between the admittedly small samples of clusters in the two surveys is the demonstration that, as expected from the sensitivity curves, the Subaru map cleanly detects clusters with rest frame line-of sight velocity significantly below the limits of the DLS sensitivity at a fixed redshift.
Understanding both the completeness and the purity of weak lensing map cluster detections are, of course, crucial to their use as cosmological tools for measuring e.g. the cluster mass function (White et al. 2002; Hennawi & Spergel 2005). The purity of weak lensing cluster detection is consistent with the more pessimistic theoretical models (White et al. 2002; Hamana et al. 2004; Hennawi & Spergel 2005; Maturi et al. 2010). even for , The DLS weak lensing cluster sample is % complete relative to a sample drawn from the foreground SHELS redshift survey (Geller et al. 2010). The GTO2deg2 cluster catalog is complete (Section 4.2), but the sample is so small that we cannot draw a general conclusion. These samples certainly emphasize the need for more extensive detailed tests not dominated by small number statistics. The CFHTLS (Shan et al. (2011) makes substantial progress toward this goal, but the analysis is based on photometric redshifts rather than on a redshift survey that can separate superpositions along the line-of-sight unresolved by photometric redshifts.
6 Conclusion
Weak lensing surveys are a potential tool for identifying massive systems of galaxies. These mass selected cluster catalogs could provide important cosmological constraints. Objective tests of the completeness and purity are an important foundation the application of future surveys including DES, LSST, and EUCLID to the construction of catalogs of cluster candidates from weak lensing maps.
The Subaru GTO2deg2 field (centered at = 16h04m44s; =43∘11′24′′) is the second where we have carried out a dense foreground redshift survey as a test of the fidelity of the weak lensing map. In contrast with the 0.85′′ seeing of the DLS F2 field of our first survey (Geller et al. 2010), the Subaru field has median seeing of 0.66′′. The number of resolved sources in the Subaru field is 35 arcmin-2 in contrast with 22 arcmin-2 for the DLS field.
To match the sensitivity of the Subaru lensing map, the primary component of our redshift survey includes red galaxies ( and ) with SDSS Petrosian . The total number of galaxies with redshifts in the field is 4959: 4541 are new redshifts measured with Hectospec. This dense survey enables a variety of tests of the weak lensing map.
Our tests include (1) searching the redshift survey for massive systems along the line-of-sight toward weak lensing peaks with significance , the threshold originally used by Miyazaki et al (2007), (2) searching the redshift survey for all systems massive enough to produce a lensing signal to estimate the completeness of the weak lensing detections and (3) examining well-populated regions of the redshift survey in directions where there is no significant weak lensing signal to further test the fidelity of the weak lensing map.
We show that the procedure Miyazaki et al. (2007) used to eliminate contaminated, but apparently high confidence peaks from their weak lensing map improves the fidelity of the weak lensing map in comparison with the foreground redshift survey. These contaminated peaks should probably be removed from both E- and B-mode maps prior to analysis.
The B-mode map derived from a reanalysis of the Subaru data suggest that is a better cluster detection threshold than . Comparison with the foreground redshift survey confirms the implications of the B-mode map. In the Subaru map, 2/3 of the weak lensing peaks with are detections of individual massive systems. The third peak is a superpositon of of less massive systems. In the larger DLS F2 field, a deeper observation in poorer seeing (Table 2) all three of the peaks correspond to massive systems of galaxies. Thus for , the purity is %.
In the DLS F2 field, the SHELS foreground redshift survey identifies twice as many massive cluster candidates as the weak lensing map; in the Subaru field all of the cluster candidates are detected in both the redshift survey and the weak lensing map, but the sample is very small. These small samples suggest that for the completeness is %.
In contrast with the DLS F2 field, the Subaru map detects less massive systems at a fixed redshift as one would expect from the greater source density. This comparison suggests that robust measurements of the cluster mass function down to a mass of M⊙ for redshifts can be derived from weak lensing maps provided the purity and completeness could be understood.
Taken together, the Subaru GTO2deg2 and DLS F2 fields underscore the need for a large-area direct test of weak lensing cluster identification based on high significance peaks derived from weak lensing. The CFHTLS (Shan et al. (2011) is an important step in this direction. Well-designed foreground redshift surveys of this region will refine the correspondence (or lack of it) between systems of galaxies and weak lensing peaks.
References
- Abell (1958) Abell, G. O. 1958, ApJS, 3, 211
- Adelman-McCarthy et al. (2008) Adelman-McCarthy, J. K., et al. 2008, ApJS, 175, 297
- Bellagamba et al. (2011) Bellagamba, F., Maturi, M., Hamana, T., et al. 2011, MNRAS, 413, 1145
- Bergé et al. (2008) Bergé, J., et al. 2008, MNRAS, 385, 695
- de Putter & White (2005) de Putter, R., & White, M. 2005, New A, 10, 676
- Dietrich et al. (2007) Dietrich, J. P., Erben, T., Lamer, G., Schneider, P., Schwope, A., Hartlap, J., & Maturi, M. 2007, A&A, 470, 821
- Casertano et al. (2000) Casertano, S., et al. 2000, AJ, 120, 2747
- Dressler et al. (1999) Dressler, A., Smail, I., Poggianti, B. M., Butcher, H., Couch, W. J., Ellis, R. S., & Oemler, A., Jr. 1999, ApJS, 122, 51
- Fabricant et al. (1998) Fabricant, D. G., Hertz, E. N., Szentgyorgyi, A. H., Fata, R. G., Roll, J. B., & Zajac, J. M. 1998, Proc. SPIE, 3355, 285
- Fabricant et al. (2005) Fabricant, D., et al. 2005, PASP, 117, 1411
- Gavazzi & Soucail (2007) Gavazzi, R., & Soucail, G. 2007, A&A, 462, 459
- Geller et al. (2005) Geller, M. J., Dell’Antonio, I. P., Kurtz, M. J., Ramella, M., Fabricant, D. G., Caldwell, N., Tyson, J. A., & Wittman, D. 2005, ApJ, 635, L125
- Geller et al. (2010) Geller, M. J., Kurtz, M. J., Dell’Antonio, I. P., Ramella, M., & Fabricant, D. G. 2010, ApJ, 709, 832
- Girardi & Mezzetti (2001) Girardi, M., & Mezzetti, M. 2001, ApJ, 548, 79
- Gunn et al. (1986) Gunn, J. E., Hoessel, J. G., & Oke, J. B. 1986, ApJ, 306, 30
- Hamana et al. (2004) Hamana, T., Takada, M., & Yoshida, N. 2004, MNRAS, 350, 893
- Hamana et al. (2009) Hamana, T., Miyazaki, S., Kashikawa, N., Ellis, R. S., Massey, R. J., Refregier, A., & Taylor, J. E. 2009, PASJ, 61, 833
- Hennawi & Spergel (2005) Hennawi, J. F., & Spergel, D. N. 2005, ApJ, 624, 59
- Hoekstra (2001) Hoekstra, H. 2001, A&A, 370, 743
- Hoekstra et al. (1998) Hoekstra, H., Franx, M., Kuijken, K., & Squires, G. 1998, ApJ, 504, 636
- Hoekstra et al. (2011) Hoekstra, H., Hartlap, J., Hilbert, S., & van Uitert, E. 2011, MNRAS, 412, 2095
- Hetterscheidt et al. (2005) Hetterscheidt, M., Erben, T., Schneider, P., Maoli, R., van Waerbeke, L., & Mellier, Y. 2005, A&A, 442, 43
- Kaiser et al. (1995) Kaiser, N., Squires, G., & Broadhurst, T. 1995, ApJ, 449, 460
- Khiabanian & Dell’Antonio (2008) Khiabanian, H., & Dell’Antonio, I. P. 2008, ApJ, 684, 794
- Koester et al. (2007) Koester, B. P., et al. 2007, ApJ, 660, 239
- Kubo et al. (2009) Kubo, J. M., Khiabanian, H., Dell’Antonio, I. P., Wittman, D., & Tyson, J. A. 2009, ApJ, 702, 980
- Kurtz & Mink (1998) Kurtz, M. J., & Mink, D. J. 1998, PASP, 110, 934
- Leauthaud et al. (2007) Leauthaud, A., et al. 2007, ApJS, 172, 219
- Lubin et al. (1998) Lubin, L. M., Postman, M., Oke, J. B., Ratnatunga, K. U., Gunn, J. E., Hoessel, J. G., & Schneider, D. P. 1998, AJ, 116, 584
- Lubin et al. (2000) Lubin, L. M., Brunner, R., Metzger, M. R., Postman, M., & Oke, J. B. 2000, ApJ, 531, L5
- Lubin et al. (2004) Lubin, L. M., Mulchaey, J. S., & Postman, M. 2004, ApJ, 601, L9
- Maturi et al. (2007) Maturi, M., Schirmer, M., Meneghetti, M., Bartelmann, M., & Moscardini, L. 2007, A&A, 462, 473
- Maturi et al. (2010) Maturi, M., Angrick, C., Pace, F., & Bartelmann, M. 2010, A&A, 519, A23
- Mink et al. (2007) Mink, D. J., Wyatt, W. F., Caldwell, N., Conroy, M. A., Furesz, G., & Tokarz, S. P. 2007, Astronomical Data Analysis Software and Systems XVI, 376, 249
- Miyazaki et al. (2002) Miyazaki, S., et al. 2002, ApJ, 580, L97
- Miyazaki et al. (2007) Miyazaki, S., Hamana, T., Ellis, R. S., Kashikawa, N., Massey, R. J., Taylor, J., & Refregier, A. 2007, ApJ, 669, 714
- Mobasher et al. (2007) Mobasher, B., et al. 2007, ApJS, 172, 117
- Postman et al. (1998) Postman, M., Lubin, L. M., & Oke, J. B. 1998, AJ, 116, 560
- Rines & Diaferio (2006) Rines, K., & Diaferio, A. 2006, AJ, 132, 1275
- Rines et al. (2003) Rines, K., Geller, M. J., Kurtz, M. J., & Diaferio, A. 2003, AJ, 126, 2152
- Roll et al. (1998) Roll, J. B., Fabricant, D. G., & McLeod, B. A. 1998, Proc. SPIE, 3355, 324
- Schirmer et al. (2007) Schirmer, M., Erben, T., Hetterscheidt, M., & Schneider, P. 2007, A&A, 462, 875
- Schneider (2006) Schneider, P. 2006, Gravitational Lensing: Strong, Weak and Micro, Saas-Fee Advanced Courses, Volume 33. ISBN 978-3-540-30309-1. Springer-Verlag Berlin Heidelberg, 2006, p. 269, 269
- Shan et al. (2011) Shan, H., Kneib, J.-P., Tao, C., et al. 2011, arXiv:1108.1981
- Spergel et al. (2007) Spergel, D. N., et al. 2007, ApJS, 170, 377
- Struble & Rood (1999) Struble, M. F., & Rood, H. J. 1999, ApJS, 125, 35
- Taniguchi et al. (2007) Taniguchi, Y., et al. 2007, ApJS, 172, 9
- White et al. (2002) White, M., van Waerbeke, L., & Mackey, J. 2002, ApJ, 575, 640
- Williams et al. (1996) Williams, R. E., et al. 1996, AJ, 112, 1335
- Wittman et al. (2001) Wittman, D., Tyson, J. A., Margoniner, V. E., Cohen, J. G., & Dell’Antonio, I. P. 2001, ApJ, 557, L89
- Wittman et al. (2006) Wittman, D., Dell’Antonio, I. P., Hughes, J. P., Margoniner, V. E., Tyson, J. A., Cohen, J. G., & Norman, D. 2006, ApJ, 643, 128
| objID | ra | dec | redshift | z error | zSource | |||
|---|---|---|---|---|---|---|---|---|
| 587733442122744127 | 240.0929 | 42.7913 | 0.12636 | 0.00009 | 18.97 | 0.94 | 0.52 | Hecto |
| 587733442122744638 | 240.0663 | 42.8125 | 0.48417 | 0.00011 | 20.86 | 1.02 | 0.49 | Hecto |
| 587733442122745038 | 240.0662 | 42.7705 | 0.68305 | 0.00020 | 22.31 | 1.35 | 1.15 | Hecto |
| 587733442122745075 | 240.0767 | 42.7428 | 0.68472 | 0.00022 | 21.03 | 1.55 | 1.20 | Hecto |
| 587733442122809425 | 240.1192 | 42.6976 | 0.59909 | 0.00021 | 20.80 | 1.22 | 0.89 | Hecto |
| 587733442122809463 | 240.2103 | 42.7137 | 0.48322 | 0.00013 | 20.14 | 1.32 | 0.81 | Hecto |
| 587733442122809491 | 240.1748 | 42.6516 | 0.46796 | 0.00012 | 20.46 | 1.87 | 0.87 | Hecto |
| 587733442122809551 | 240.0543 | 42.6959 | 0.09460 | 0.00006 | 17.64 | 0.89 | 0.41 | Hecto |
| Property | GTO2deg2 | DLS F2 |
|---|---|---|
| Field Center () | 241.183, 43.190 | 139.885, 30.000 |
| Field Area(deg2) | 2.02 | 4.1 |
| Source Density (arcmin-2) | 35 | 22.4 |
| Median Seeing (′′) | 0.66 | 0.85 |
| Seeing Range (′′) | 0.63-0.76 | |
| Pixel Scale (′′) | 18 | 30 |
| Smoothing Length (arcmin) | 1.5 | 1.5 |
| N | 3 | 3 |
| Clusters detected | 2 | 3 |
| Rank | RA2000 | DEC2000 | z | N3 | err3 | N6 | err6 | Count | |||
|---|---|---|---|---|---|---|---|---|---|---|---|
| km/s | km/s | km/s | km/s | Excess4 | |||||||
| 0 | 5.784520 | 240.776778 | 42.769138 | 0.540 | 613 | 20 | 78 | 576 | 29 | 64 | y |
| 1 | 5.673880 | 240.715968 | 43.590494 | 0.413 | 619 | 15 | 68 | 598 | 26 | 58 | y |
| 2∗ | 4.451760 | 241.179641 | 43.451752 | ||||||||
| 3 | 4.426710 | 241.035219 | 42.658144 | 0.297 | 595 | 6 | 87 | 480 | 18 | 61 | y |
| 0.673 | 558 | 5 | 76 | 431 | 8 | 77 | |||||
| 4∗ | 4.383750 | 241.483689 | 43.451752 | ||||||||
| 5∗ | 4.352070 | 241.552100 | 43.590494 | ||||||||
| 6∗ | 4.201050 | 240.396718 | 42.918980 | ||||||||
| 7 | 3.819900 | 241.977766 | 43.630180 | ||||||||
| 8∗ | 3.802810 | 240.221891 | 42.597097 | ||||||||
| 9 | 3.784870 | 241.240451 | 43.645991 | ||||||||
| 10 | 3.734410 | 240.373915 | 42.769138 | 0.469 | 595 | 5 | 180 | 545 | 6 | 156 | y |
| 142 | 3.4 | 241.757 | 42.791 | 0.185 | 463 | 16 | 58 | 419 | 24 | 48 | |
| 373 | 2.9 | 240.616 | 42.569 | 0.602 | 639 | 8 | 97 | 639 | 8 | 97 |
| Peak ID | RA2000 | Dec2000 | S/N |
|---|---|---|---|
| B0 | 240.9592 | 43.7292 | 4.2373 |
| B1∗ | 241.2405 | 43.5516 | 3.8413 |
| B2 | 240.9896 | 43.6682 | 3.8035 |
| B3 | 241.5141 | 42.9023 | 3.7122 |