A Powerful AGN Outburst in RBS 797
Abstract
Utilizing ks of Chandra X-ray Observatory imaging, we present an analysis of the intracluster medium (ICM) and cavity system in the galaxy cluster RBS 797. In addition to the two previously known cavities in the cluster core, the new and deeper X-ray image has revealed additional structure associated with the active galactic nucleus (AGN). The surface brightness decrements of the two cavities are unusually large, and are consistent with elongated cavities lying close to our line-of-sight. We estimate a total AGN outburst energy and mean jet power of erg and , respectively, depending on the assumed geometrical configuration of the cavities. Thus, RBS 797 is apparently among the the most powerful AGN outbursts known in a cluster. The average mass accretion rate needed to power the AGN by accretion alone is . We show that accretion of cold gas onto the AGN at this level is plausible, but that Bondi accretion of the hot atmosphere is probably not. The BCG harbors an unresolved, non-thermal nuclear X-ray source with a bolometric luminosity of . The nuclear emission is probably associated with a rapidly-accreting, radiatively inefficient accretion flow. We present tentative evidence that star formation in the BCG is being triggered by the radio jets and suggest that the cavities may be driving weak shocks () into the ICM, similar to the process in the galaxy cluster MS 0735.6+7421.
Subject headings:
galaxies: active – galaxies: clusters: general – galaxies: clusters: intracluster medium – X-rays: galaxies: clusters1. Introduction
Evidence gathered over the last decade suggests that the growth of galaxies and supermassive black holes (SMBHs) are coupled, and that energetic feedback from active galactic nuclei (AGN) strongly influences galaxy evolution (e.g. Kormendy & Richstone, 1995; Silk & Rees, 1998; Kauffmann & Haehnelt, 2000; Tremaine et al., 2002). The discovery of AGN induced cavities in the hot halos surrounding many massive galaxies has strengthened this idea (see Peterson & Fabian, 2006; McNamara & Nulsen, 2007, for reviews) by revealing that AGN mechanical heating is capable of regulating halo radiative cooling (e.g. Bîrzan et al., 2004; Dunn & Fabian, 2006; Rafferty et al., 2006). Current models of radio-mode AGN feedback posit that cooling processes in a galaxy’s hot halo drives mass accretion onto a central SMBH, promoting AGN activity that eventually offsets halo cooling via a thermally regulated feedback loop (e.g. Croton et al., 2006; Bower et al., 2006; Sijacki et al., 2007). While there is direct evidence that halo cooling and feedback are linked (e.g. Cavagnolo et al., 2008a; Rafferty et al., 2008), the observational constraints on how AGN are fueled and powered are more difficult to establish.
Gas accretion alone can, in principle, fuel most AGN (e.g. Pizzolato & Soker, 2005; Allen et al., 2006). However, for some relatively gas-poor systems hosting energetic AGN, for example, Hercules A, Hydra A, MS 0735.6+7421, and 3C 444 where the output exceeds erg (Nulsen et al., 2005a; Wise et al., 2007; McNamara et al., 2005; Croston et al., 2010), it appears that gas accretion alone may have difficulty sustaining their AGN unless the accretion is unusually efficient. This problem has lead to speculation that some BCGs may host ultramassive black holes (; e.g. McNamara et al., 2009), or that some AGN are powered by the release of energy stored in a rapidly-spinning SMBH (e.g. McNamara et al., 2010). In this paper, we explore these and other issues through an analysis of the powerful AGN outburst in the RBS 797 (catalog ) cluster.
The discovery of AGN-induced cavities in the intracluster medium (ICM) of the galaxy cluster RBS 797 was first reported by Schindler et al. (2001) using data from the Chandra X-ray Observatory (CXO). Multifrequency radio observations showed that the cavities are co-spatial with extended radio emission centered on a strong, jetted radio source coincident with the RBS 797 brightest cluster galaxy (BCG) (De Filippis et al., 2002; Gitti et al., 2006; Bîrzan et al., 2008). The observations implicate an AGN in the BCG as the cavities’ progenitor, and Bîrzan et al. (2004, hereafter B04) estimate the AGN deposited erg of energy into the ICM at a rate of .
The B04 analysis assumed the cavities are roughly spherical, symmetric about the plane of the sky, and that their centers lie in a plane passing through the central AGN and perpendicular to our line-of-sight. However, the abnormally deep surface brightness decrements of the cavities, and the nebulous correlation between the radio and X-ray morphologies, suggests the system may be more complex than B04 assumed. Using a longer, follow-up CXO observation, we conclude that the cavities are probably elongated along the line-of-sight and provide evidence that additional cavities may be present at larger radii. We conservatively estimate the total AGN energy output and power are six times larger than the B04 values, erg and respectively.
Reduction of the X-ray and radio data is discussed in Section 2. Interpretation of observational results are given throughout Section 3, and a brief summary concludes the paper in Section 4. A CDM cosmology with , , and is adopted. At a redshift of , the look-back time is 3.9 Gyr, kpc arcsec-1, and Mpc. All spectral analysis errors are 90% confidence, while all other errors are 68% confidence.
2. Observations
2.1. X-ray Data
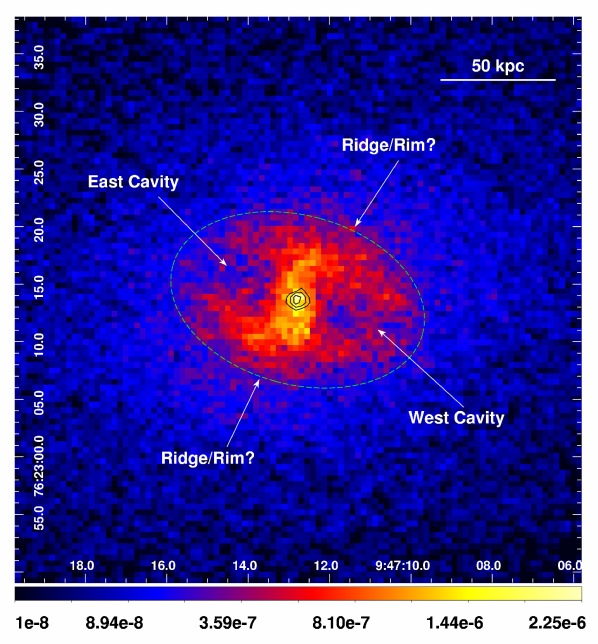
RBS 797 was observed with CXO in October 2000 for 11.4 ks using the ACIS-I array (ObsID 2202 (catalog ADS/Sa.CXO#Obs/02202)) and in July 2007 for 38.3 ks using the ACIS-S array (ObsID 7902 (catalog ADS/Sa.CXO#Obs/07902)). Datasets were reduced using CIAO and CALDB versions 4.2. Events were screened of cosmic rays using ASCA grades and vfaint filtering. The level-1 event files were reprocessed to apply the most up-to-date corrections for the time-dependent gain change, charge transfer inefficiency, and degraded quantum efficiency of the ACIS detector. The afterglow and dead area corrections were also applied. Time intervals affected by background flares exceeding 20% of the mean background count rate were isolated and removed using light curve filtering. The final, combined exposure time is 48.8 ks. Point sources were identified and removed via visual inspection and use of the CIAO tool wavdetect. We refer to the CXO data free of point sources and flares as the “clean” data. A mosaiced, fluxed image (see Figure 1) was generated by exposure correcting each clean dataset and reprojecting the normalized images to a common tangent point.
2.2. Radio Data
Very Large Array (VLA) radio images at 325 MHz (A-array), 1.4 GHz (A- and B-array), 4.8 GHz (A-array), and 8.4 GHz (D-array) are presented in Gitti et al. (2006) and Bîrzan et al. (2008). Our re-analysis of the archival VLA radio observations yielded no significant differences with these prior studies. Using the rms noise () values given in Gitti et al. (2006) and Bîrzan et al. (2008) for each observation, emission contours between and the peak image intensity were generated. These are the contours referenced and shown in all subsequent discussion and figures.
3. Results
3.1. Cavity Morphologies and ICM Substructure
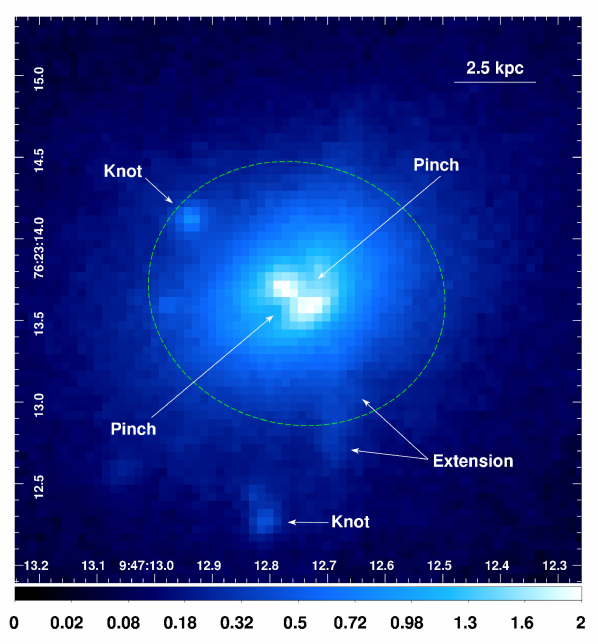
Shown in Figure 1 is the 0.7–2.0 keV CXO mosaiced clean image. Outside of kpc, the global ICM morphology is regular and elliptical in shape, with the appearance of being elongated along the northwest-southeast direction. The cavities discovered by Schindler et al. (2001) are clearly seen in the cluster core east and west of the nuclear X-ray source and appear to be enclosed by a thick, bright, elliptical ridge of emission which we discuss further in Section 3.3.1. The western cavity has more internal structure, and its boundaries are less well-defined, than the eastern cavity. The emission from the innermost region of the core is elongated north-south and has a distinct ‘S’-shape punctuated by a hard nuclear X-ray source.
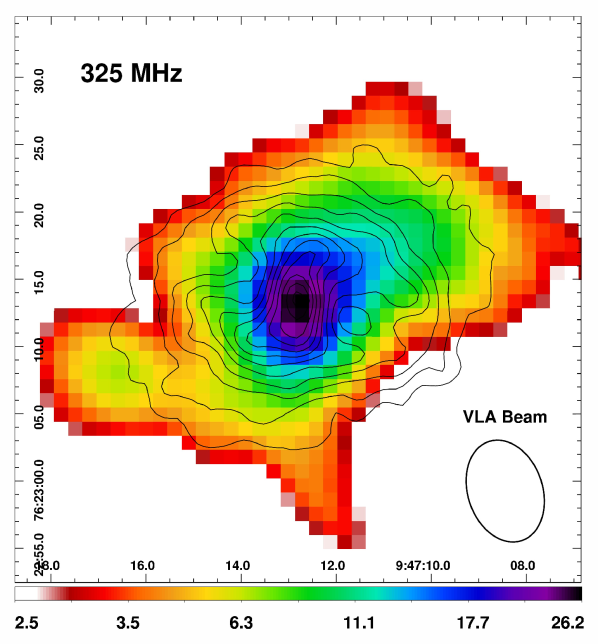
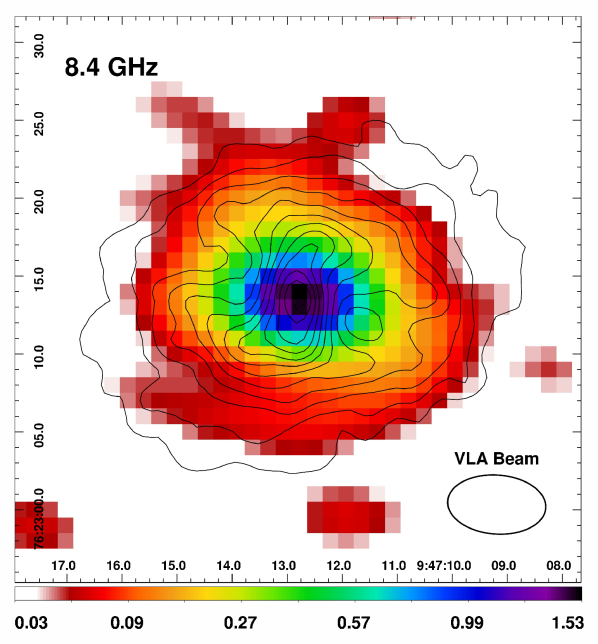
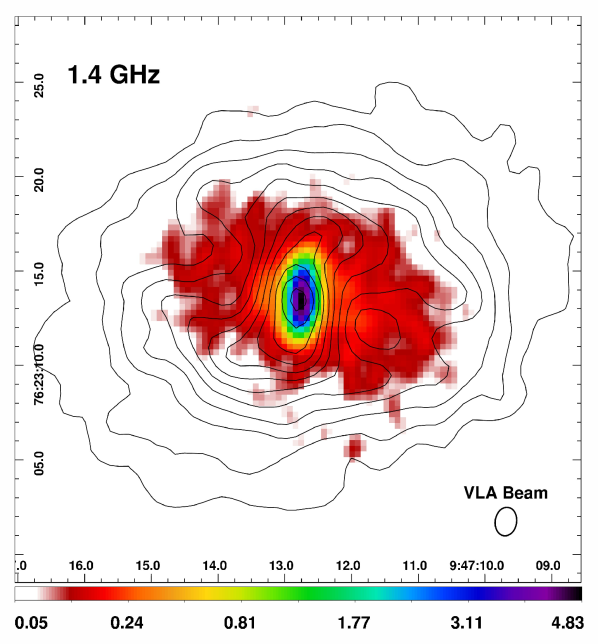
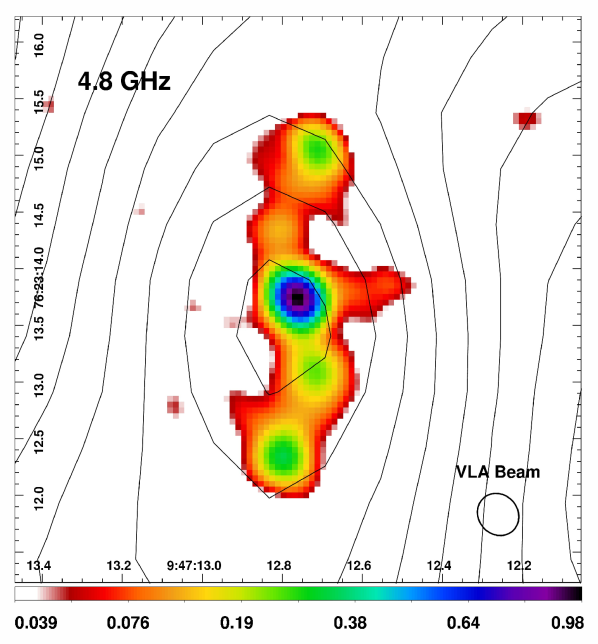
Multifrequency radio images overlaid with ICM X-ray contours are shown in Figure 2. RBS 797 radio properties are discussed in Gitti et al. (2006), and we summarize here. As seen in projection, the nuclear 4.8 GHz jets are almost orthogonal to the axis connecting the cavities. Radio imaging at resolution reveals the 325 MHz, 1.4 GHz, and 8.4 GHz radio emission are diffuse and extend well-beyond the cavities, more similar to the morphology of a radio mini-halo than relativistic plasma confined to the cavities (Cassano et al., 2008, Doria et al., in preparation). Of all the radio images, the 1.4 GHz emission imaged at resolution most closely traces the cavity morphologies, yet it is still diffuse and uniform over the cavities with little structure outside the radio core. Typically, the connection between a cavity system, coincident radio emission, and the progenitor AGN is unambiguous. This is not the case for RBS 797, which suggests the cavity system may be more complex than it appears. Indeed, there is a hint of barely resolved structure in the Chandra image associated with the 4.8 GHz radio structure, with X-ray deficits just beyond the tips of the radio jets, bounded to one side by the ’S’ shaped feature noted above. This is suggestive of potentially small cavities from a new outburst episode with asymmetric bright rims created by young radio jets.
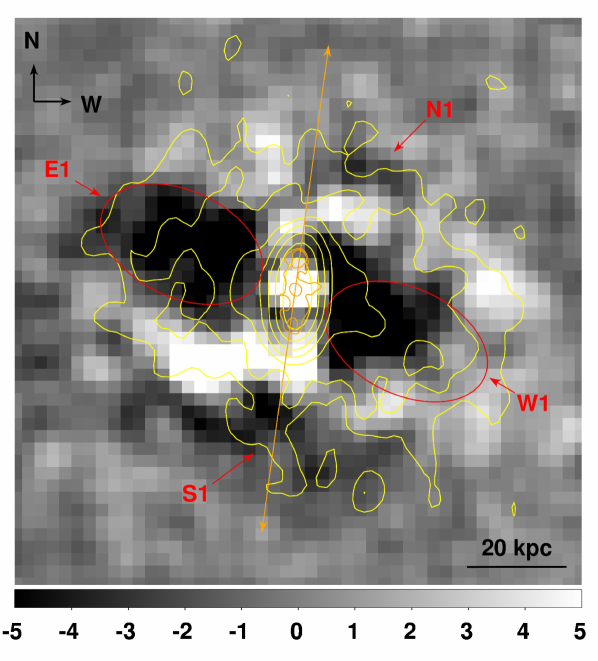
To better reveal the cavity morphologies, residual X-ray images of RBS 797 were constructed by modeling the ICM emission and subtracting it off. The X-ray isophotes of two exposure-corrected images – one smoothed by a Gaussian and another by a Gaussian – were fitted with ellipses using the IRAF task ellipse. The ellipse centers were fixed at the location of the BCG X-ray point source, and the eccentricities and position angles were free to vary. A 2D surface brightness model was created from each fit using the IRAF task bmodel, normalized to the parent X-ray image, and then subtracted off. The residual images are shown in Figure 3.
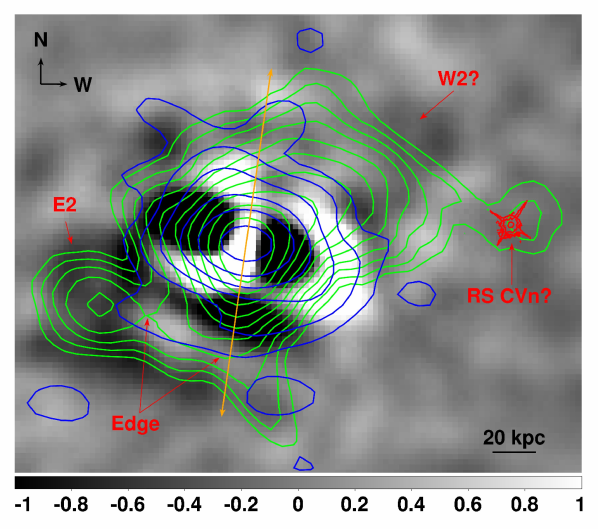
In addition to the central east and west cavities (labeled E1 and W1), tentative evidence for depressions north and south of the nucleus (labeled N1 and S1) are revealed. N1 and S1 lie along the 4.8 GHz jet axis and are coincident with spurs of significant 1.4 GHz emission. A possible depression coincident with the southeastern concentration of 325 MHz emission is also found (labeled E2), but no radio counterpart on the opposite side of the cluster is seen (labeled W2). The N1, S1, and E2 depressions do not show-up in surface brightness profiles extracted in wedges passing through each feature. So while coincidence with the radio emission hints at additional cavities, they may be spurious structures and a deeper image is required to confirm them. There is also an X-ray edge which extends southeast from E2 and sits along a ridge of 325 MHz and 8.4 GHz emission. No substructure associated with the western-most knot of 325 MHz emission is found, but there is a stellar object co-spatial with this region. The X-ray and radio properties of the object are consistent with those of a galactic RS CVn star (Seaquist, 1993) – if the star is less than 1 kpc away, and – suggesting the western 325 MHz emission may not be associated with the cluster.
3.2. Radial ICM Properties
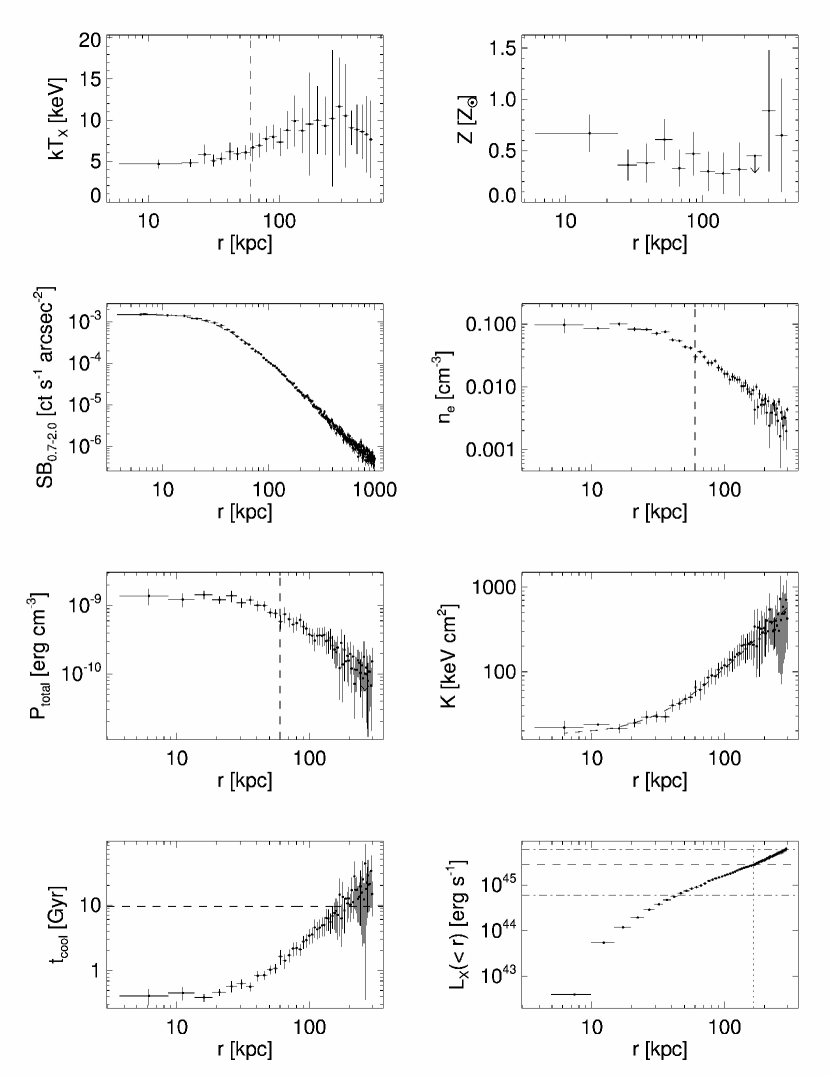
In order to analyze the RBS 797 cavity system and AGN outburst energetics in-detail, the radial ICM density, temperature, and pressure structure need to be measured. The radial profiles are shown in Figure 4. A temperature () profile was created by extracting spectra from concentric circular annuli (2500 source counts per annulus) centered on the cluster X-ray peak, binning the spectra to 25 counts per energy channel, and then fitting each spectrum in XSPEC 12.4 (Arnaud, 1996). Spectra were modeled with an absorbed, single-component MeKaL model (Mewe et al., 1985) over the energy range 0.7–7.0 . For each annulus, weighted responses were created and a background spectrum was extracted from the ObsID matched CALDB blank-sky dataset normalized using the ratio of 9–12 keV count rates for an identical off-axis, source-free region of the blank-sky and target datasets. The absorbing Galactic column density was fixed to (Kalberla et al., 2005), and a spectral model for the Galactic foreground was included as an additional, fixed background component during spectral fitting (see Vikhlinin et al. 2005 and Cavagnolo et al. 2008b for method). Gas metal abundance was free to vary and normalized to the Anders & Grevesse (1989) solar ratios. Spectral deprojection using the projct XSPEC model did not produce significantly different results, thus only projected quantities are discussed.
A 0.7–2.0 keV surface brightness profile was extracted from the CXO mosaiced clean image using concentric wide elliptical annuli centered on the BCG X-ray point source (central and cavities excluded). A deprojected electron density () profile was derived from the surface brightness profile using the method of Kriss et al. (1983) which incorporates the 0.7–2.0 keV count rates and best-fit normalizations from the spectral analysis (see Cavagnolo et al., 2009, for details). Errors for the density profile were estimated using 5000 Monte Carlo simulations of the original surface brightness profile. A total gas pressure profile was calculated as where and . Profiles of enclosed X-ray luminosity, entropy () and cooling time (, where is the cooling function), were also generated. Errors for each profile were determined by summing the individual parameter uncertainties in quadrature.
The radial profiles are consistent with those of a normal cool core cluster: outwardly increasing temperature profile, centrally peaked abundance profile, central cooling time of Myr within 9 kpc of the cluster center, and a pronounced low entropy core. Fitting the ICM entropy profile with the function , where [] is core entropy, [] is a normalization at 100 kpc, and is a dimensionless index, reveals , , and for (DOF). Further, the radial analysis does not indicate any significant temperature, density, or pressure discontinuities to signal the existence of large-scale shocks or cold fronts.
3.3. ICM Cavities
3.3.1 Cavity Energetics
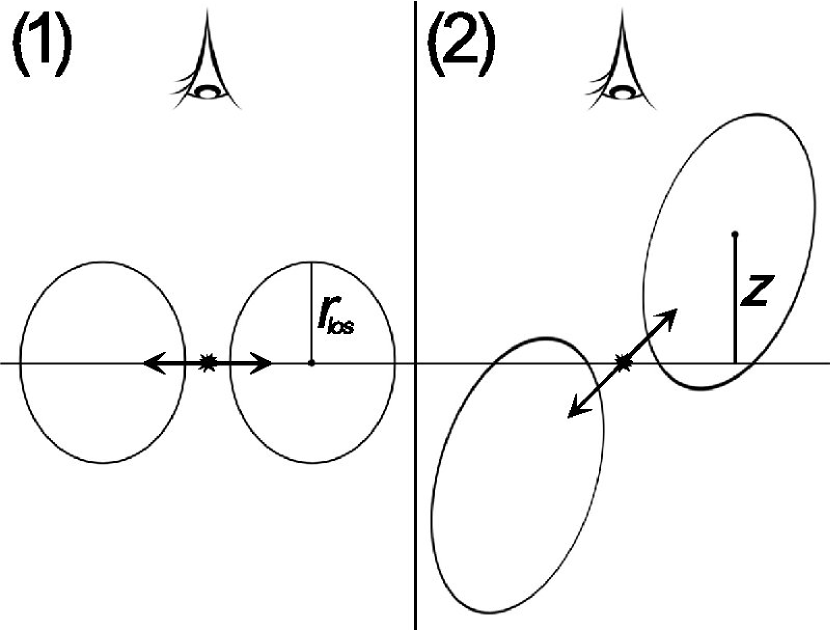
Of all the ICM substructure, the E1 and W1 cavities are unambiguous detections, and their energetics were determined following standard methods (see B04). Our fiducial cavity configuration assumes the cavities are symmetric about the plane of the sky, and the cavity centers lie in a plane which is perpendicular to our line-of-sight and passes through the central AGN (configuration-1 in Figure 5). Hereafter, we denote the line-of-sight distance of a cavity’s center from this plane as , and the cavity radius along the line-of-sight as . The volume of a cavity with is thus where and are the projected semi-major and -minor axes, respectively, of the by-eye determined ellipses in Figure 3. The projected morphologies of E1 and W1 are similar enough that congruent regions were used for both. Initially, the cavities were assumed to be roughly spherical and was set equal to the projected effective radius, . For configuration-1, the distance of each cavity from the central AGN, , is simply the projected distance from the ellipse centers to the BCG X-ray point source. A systematic error of 10% is assigned to the cavity dimensions.
Cavity ages were estimated using the , , and timescales discussed in B04. The age assumes a cavity reaches its present distance from the central AGN by moving at the local sound speed, while assumes the cavity buoyantly rises at its terminal velocity, and is simply the time required to refill the volume displaced by the cavity. The energy required to create each cavity is estimated by its enthalpy, , which was calculated assuming cavity pressure support is provided by a relativistic plasma (). We assume the cavities are buoyant structures and that the time-averaged power needed to create each cavity is . The individual cavity properties are given in Table 1 and the aggregate properties in Table 2.
For the representative assumption of configuration-1, we measure a total cavity energy erg and total power . These values are larger than those of B04 ( erg, ) by a factor of due to our larger E1 and W1 volumes. Using the B04 cavity volumes in place of our own produces no significant differences between our energetics calculations and those of B04. The largest uncertainties in the energetic calculations are the cavity volumes and their 3-dimensional locations in the ICM, issues we consider next.
3.3.2 Cavity Surface Brightness Decrements
A cavity’s morphology and location in the ICM affects the X-ray surface brightness decrement it induces. If the surface brightness of the undisturbed ICM can be estimated, then the decrement is useful for constraining the cavity line-of-sight size and, through simple geometric calculation, its distance from the launch point (see Wise et al., 2007, for details). We adopt the Wise et al. (2007) definition of surface brightness decrement, , as the ratio of the X-ray surface brightness inside the cavities to the value of the best-fit ICM surface brightness -model at the same radius. Note the potential for confusion, since if there is no decrement and while small values of correspond to large decrements. Consistent with the analysis of Schindler et al. (2001), we find the best-fit -model has parameters , , and for (DOF) = 79(97). Using a circular aperture with radius centered on the deepest part of each cavity, we measure mean decrements of and , with minima of and .
To check if the representative approximation for cavity configuration-1 can produce the measured decrements, the best-fit -model was integrated over each cavity with a column of gas equal to excluded. For this case, the most significant decrement obtained was , indicating that must exceed . If the centers of E1 and W1 lie in the plane of the sky, the minimum line-of-sight depths needed to reproduce the decrements of E1 and W1 are kpc and kpc. The energetics for these morphologies are given as configuration-1a in Tables 1 and 2. If the cavities are moving away from the AGN in the plane of the sky, then it is surprising to find that each has its shortest axis in the plane of the sky and perpendicular to its direction of motion. However, if the bright rims are masking the true extent of the cavities along this short axis, the cavities may be larger than we realize.
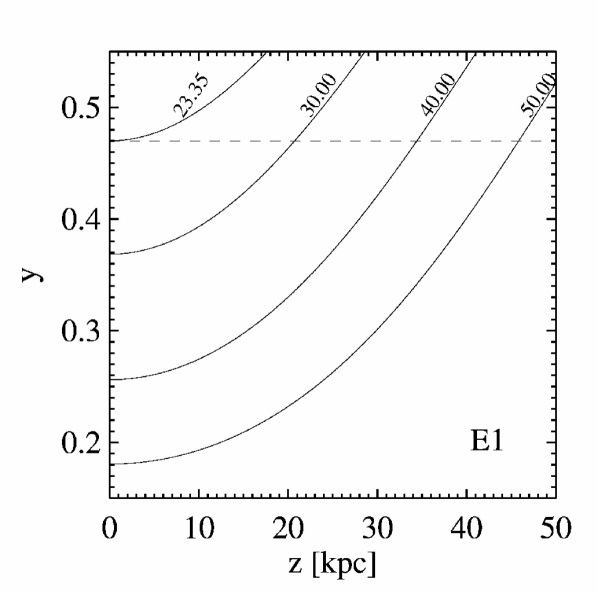
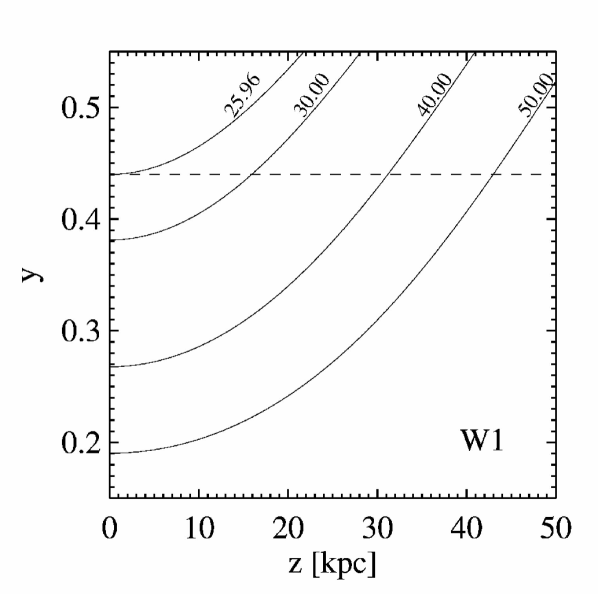
It is also possible that the cavities are inflating close to our line-of-sight and thus may be large, elongated structures as shown in configuration-2 of Figure 5. Presented in Figure 6 are curves showing how surface brightness decrement changes as a function of for various . The plots demonstrate that it is possible to reproduce the measured E1 and W1 decrements using larger cavities that have centers displaced from the plane of the sky. Consequently, the limiting case of is a lower-limit on the AGN outburst energetics. If the cavity system lies close to our line-of-sight, and is much larger and more complex than the data allows us to constrain, it may explain the additional ICM substructures seen in the residual images and the ambiguous relationship between the X-ray and radio morphologies.
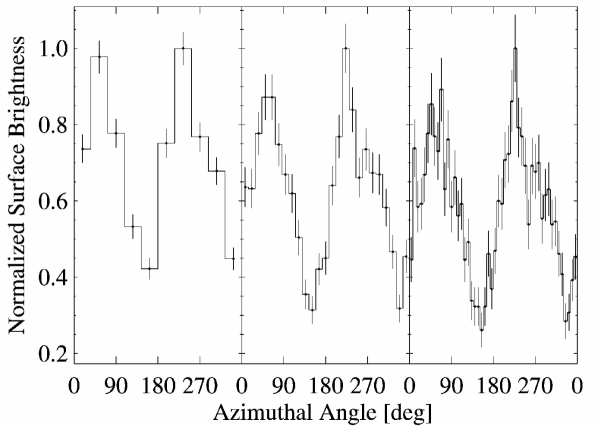
It should be noted that deep cavities like in RBS 797 are uncommon, with most other cavity systems having minima (B04). The large decrements raise the concern that the -model fit has been influenced by the rim-like structures of E1-W1 and produced artificially large decrements (small ). The prominent rims can be seen in Figure 7 which shows the normalized surface brightness variation in wedges of a wide annulus centered on the X-ray peak and passing through the cavity midpoints. In addition to excluding the cavities, we tried excluding the rims during -model fitting, but this did not provide insight as too much of the surface brightness profile was removed and the fit did not converge. Extrapolating the surface brightness profile at larger radii inward resulted in even lower decrements. The Wise et al. (2007) decrement model assumes a cavity replaces some X-ray emitting gas with non-emitting material, without disturbing ambient gas. To be valid, the model requires that there is little uplifted gas surrounding a cavity (c.f. Nulsen et al., 2005b; Blanton et al., 2001) and that the cavity is not driving significant shocks into its surroundings (see Section 3.3.3). The rims, and their possible connection to gas shocking, are discussed below.
3.3.3 Do the Rims Indicate Shocks?
The Chandra X-ray image of RBS 797 bears a strong resemblance to that of MS 0735.6+7421, with a bright elliptical region at its center enclosing two prominent cavities. In MS 0735.6+7421, the bright central region is bounded by Mach shocks. Although there is no evidence for density or temperature jumps in the Chandra data for RBS 797, the spatial resolution of the RBS 797 observations is poorer than for MS 0735.6+7421 (the angular scale of shocks in RBS 797 would be smaller). Based on their similar appearances, we suggest that the prominent central ellipse in the X-ray image of RBS 797 may also be surrounded by moderately strong shocks, and the lack of evidence for shocks may simply be a consequence of the poor spatial resolution.
A simple model that captures how a bright, shocked rim helps enhance a cavity decrement is to assume the shocked region is cylindrical and uniformly compressed. Ignoring emission outside the shocked cylinder, a compression gives a decrement of , hence a decrement of can be obtained with , i.e. not dissimilar from the shock Mach numbers in Hercules A and MS 0735.6+7421. This is a rough estimate (arguably pessimistic since the compressed gas is assumed to be uniform), but it demonstrates how bright rims created by shocks may enhance the cavity decrements. Assuming axial symmetry for the unshocked gas, including emission outside the cylinder adds more to the bright rim than the cavity center, increasing the surface brightness difference from rim to cavity, but generally reducing . Because the ICM surface brightness drops rapidly outside the shocked region, the correction due to emission from outside the cylinder is modest, and it scales as , so its effect decreases as the compression increases. Thus the analogy with MS 0735.6+7421 is also consistent with the relatively large cavity decrements found in RBS 797.
It is often assumed that cavity energetics calculations, like those in Section 3.3.1, provide a reasonable estimate of the physical quantity jet power, . However, and do not account for AGN output energy which may be channeled into shocks. If significant ICM shocking has occurred in RBS 797, then the cavity energetics clearly underestimate the AGN output, which directly impacts the discussion of AGN fueling in Section 3.4. In the cases where cavity and shock energies have been directly compared, they are in general comparable. Thus the impact of shocks on the power estimates may be modest.
3.4. Powering the Outburst
If the AGN was powered by mass accretion alone, then gives a lower limit to the gravitational binding energy released as mass accreted onto the SMBH. Then, the total mass accreted can be approximated as with an average accretion rate . Consequently, the black hole’s mass grew by at an average rate . Here, is the mass-energy conversion factor and we adopt the commonly used value (Frank et al., 2002). The accretion properties associated with each cavity configuration are given in Table 2, and lies in the range . Below, we consider if the accretion of cold or hot gas pervading the BCG could meet these requirements without being in conflict with observed BCG and ICM properties.
3.4.1 Cold Accretion
Optical nebulae and substantial quantities of cold molecular gas are found in many cool core clusters (Crawford et al., 1999; Edge, 2001). This gas may be the end point of thermal instabilities in the hot atmosphere, and potentially are a significant source of fuel for AGN activity and star formation (e.g. Pizzolato & Soker, 2005; Soker, 2006; Pizzolato & Soker, 2010). We are unaware of a molecular gas mass () measurement for RBS 797, so we estimate it using the - correlation in Edge (2001). An optical spectrum (3200-7600 Å) of the RBS 797 BCG reveals a strong emission line (Fischer et al., 1998; Schwope et al., 2000), which we used as a surrogate for by assuming a Balmer decrement of EWHβ/EWHα = 0.29 (Moustakas et al., 2006), where EW is line equivalent width. We estimate , which is sufficiently in excess of the needed to power the outburst. Thus, there is reason to believe that an ample cold gas reservoir is available to fuel the AGN. It must be noted that the - relation has substantial scatter (Salomé & Combes, 2003), and that the RBS 797 emission line measurements are highly uncertain (A. Schwope, private communication), so the estimate is simply a crude estimate.
Accreting gas from the reservoir will cause the central SMBH mass to grow, but, on average, black hole mass growth is coupled to the star formation properties of the host galaxy (e.g. Kormendy & Richstone, 1995; Ferrarese & Merritt, 2000). Assuming star formation accompanied the phase of accretion which powered the AGN outburst, the Magorrian relation (Magorrian et al., 1998) implies that for each unit of black hole mass growth, several hundred times as much goes into bulge stars (e.g. Häring & Rix, 2004). Thus, the mass accretion rate needed to power the RBS 797 outburst suggests that of star formation would be required to grow the galaxy and its SMBH along the Magorrian relation. The present BCG star formation rate (SFR) is –10 (see Section 3.6), implying that, if the SFR preceding and during the AGN outburst was of the order the present rate, the SMBH has grown faster than the slope of the Magorrian relation implies.
3.4.2 Hot Accretion
Direct accretion of the hot ICM via the Bondi mechanism provides another possible AGN fuel source. The accretion flow arising from this process is characterized by the Bondi equation (Equation 1) and is often compared with the Eddington limit describing the maximal accretion rate for a SMBH (Equation 2):
| (1) | |||||
| (2) |
where is a mass-energy conversion factor, is the mean entropy [] of gas within the Bondi radius, and is black hole mass []. We chose the relations of Tremaine et al. (2002) and Graham (2007) to estimate , and find a range of , from which we adopted the weighted mean value where the errors span the lowest and highest values of the individual estimates. For and , the relevant accretion rates are and . The Eddington and Bondi accretion ratios are given in Table 2, with and .
The value of integrated over the duration of the AGN outburst is apparently larger than the available hot gas supply near the Bondi radius ( pc). Using the upper limit of , , and assuming gas near has a mean temperature of 1.0 keV, a of unity requires be less than , corresponding to . This is nine times the measured ICM central density, although the gas density near the Bondi radius could be considerably higher and evade detection. Nevertheless, a sphere more than 1 kpc in radius would required to house up to needed to power the AGN. These are properties of a galactic corona (Sun et al., 2007b). A kpc, keV, corona would be easily detected in the CXO observations as a bright point source with a distinct thermal spectrum. However, the spectrum of the observed nuclear X-ray point source (see Section 3.5) is inconsistent with being thermal in origin (i.e. no keV Fe L-shell emission hump and no keV Fe K-shell emission line blend). If the pervading ICM is instead the source of accretion fuel, these numbers imply the inner-core of the cluster would have been fully consumed during the outburst ( 100 Myr), which seems unlikely.
Because the nucleus is unresolved, the gas density at the Bondi radius could be much higher, particularly if enhanced Compton cooling is significant (e.g. Russell et al., 2010). Furthermore, it is possible that the central gas density was much higher in the past, as the AGN was turning on. Therefore, Bondi accretion cannot be ruled out. However, RBS 797, like other powerful AGN in clusters, would only be able to power their AGN by Bondi accretion with great difficulty (Rafferty et al., 2006; McNamara et al., 2010).
3.4.3 Black Hole Spin
In an effort to find lower accretion rates which still produce powerful jets, we consider below if a rapidly-spinning SMBH could act as an alternate power source. We consider the spin model with the caveats that, like cold- and hot-mode accretion, spin is wrought with its own difficulties, is hard to evaluate for any one system, and how rapidly spinning black holes are created is unclear (see McNamara et al. 2009 and McNamara et al. 2010 for discussion on these points).
In hybrid spin models (e.g. Meier, 1999, 2001; Reynolds et al., 2006; Nemmen et al., 2007; Benson & Babul, 2009; Garofalo et al., 2010) jets are produced by a combination of the Blandford-Znajek (Blandford & Znajek, 1977) and Blandford-Payne (Blandford & Payne, 1982) mechanisms, i.e. by extracting energy from a spinning black hole and its accretion disk via the poloidal component of strong magnetic fields. In these hybrid models, the accretion rate sets an upper limit to the strength of the magnetic field that can thread the inner disk and the black hole, which, in turn, determines the emergent jet power. Of the model parameters, only is truly measured, so a range of and dimensionless spin values () can produce any particular . However, to avoid the need for excessively large accretion rates, which is the shortcoming of pure mass accretion mechanisms, needs to be as near unity as possible, i.e. the choice of is not completely arbitrary.
In the hybrid spin model of Nemmen et al. (2007), the jet efficiency ( above) is strongly dependent on black hole spin. For example, for a disk viscosity parameter of , we require a black hole spin parameter of to obtain . In general, a high jet efficiency demands a high spin parameter. Alternatively, for the jet efficiency would be , boosting the mass required to fuel the outburst by an order of magnitude and exacerbating the issues of accounting for the fuel discussed above. Additional relief can be found in the model of Garofalo et al. (2010) which has the feature that extremely powerful jets are produced when the material in the disk is orbiting retrograde relative to the spin of the SMBH. In the Garofalo et al. (2010) model, for and , the required mass accretion rates are or .
3.5. Nuclear Emission
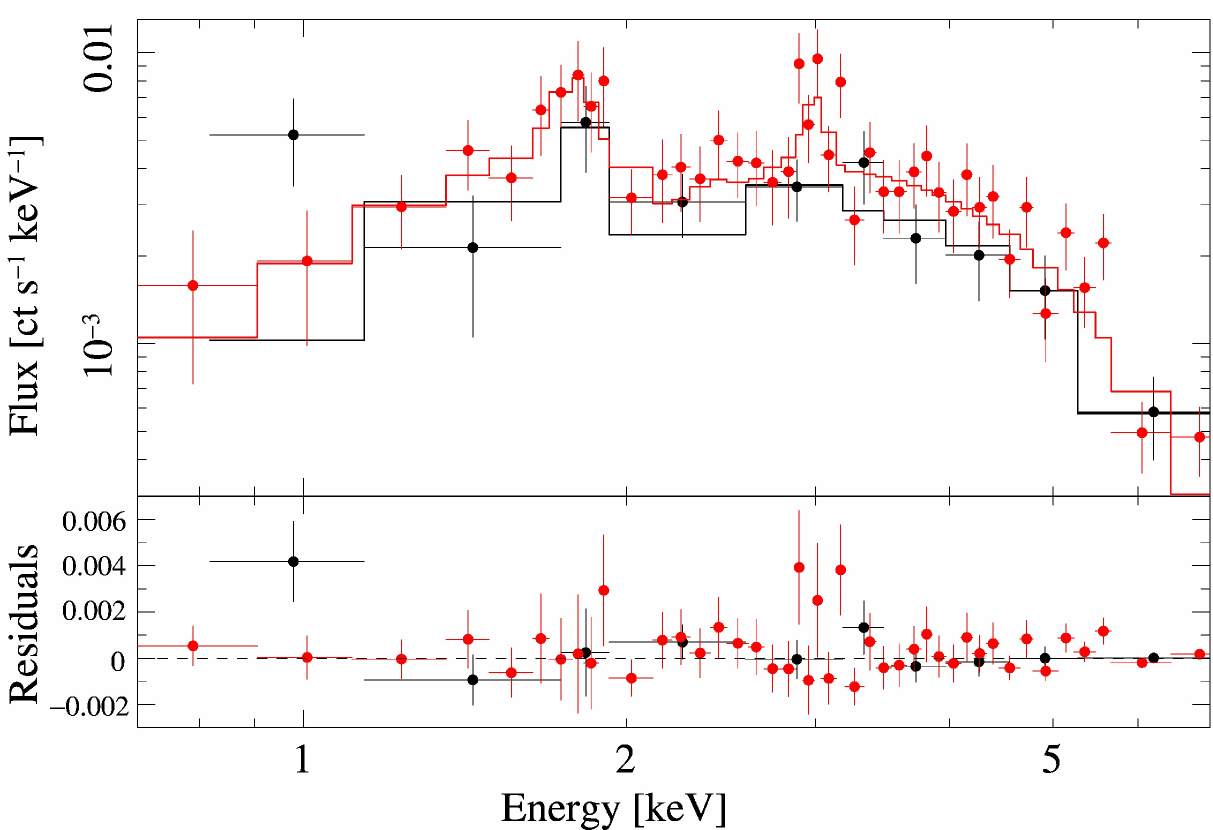
There is a bright BCG X-ray point source apparent in the Chandra image that coincides with the nucleus of the BCG, and its properties may also provide clues regarding on-going accretion processes. A source spectrum was extracted from a region enclosing 90% of the normalized CXO PSF specific to the nuclear source median photon energy and off-axis position. The source region had an effective radius of , and a background spectrum was taken from an enclosing annulus that had 5 times the area. The shape and features of the background-subtracted spectrum, shown in Figure 8, are inconsistent with thermal emission. The spectrum was modeled using an absorbed power law with two Gaussians added to account for emission features around 1.8 keV and 3.0 keV. Including an absorption edge component to further correct for the ACIS 2.0 keV iridium feature did not significantly improve any fit, resulted in optical depths consistent with zero, and did not negate the need for a Gaussian around 1.8 keV. For the entire bandpass of both CXO observations, the number of readout frames exposed to two or more X-ray photons (i.e. the pile-up percentage) inside an aperture twice the size of the source region was , and addition of a pileup component to the spectral analysis resulted in no significant improvements to the fits.
A variety of absorption models were fit to the spectrum, and the best-fit values are given in Table 3. The model with a power-law distribution of absorbers yielded the best statistical fit, and the low column densities indicate the nucleus may not be heavily obscured. If the Gaussian components represent emission line blends, they would be consistent with ion species of sulfur, silicon, argon and calcium, possibly indicating emission or reflection from dense, ionized material in or near the nucleus (e.g. Band et al., 1990; Iwasawa & Comastri, 1998).
If mass accretion is powering the nuclear emission, the X-ray source bolometric luminosity, , implies an accretion rate of , well into the regime where accretion flows are expected to be radiatively inefficient, e.g. advection-dominated flows (Narayan & Yi, 1995). Depending upon the exact properties of the accretion disk, for , the luminosity of a advection-dominated accretion disk is (Cao, 2002), which, for a point source, is too faint to be detected against the extended emission of the BCG nucleus (see Section 3.6). The low column densities suggested by the X-ray modeling could not conceal a source, so if there is a bright, undetected optical point source, the emission must be beamed away from us.
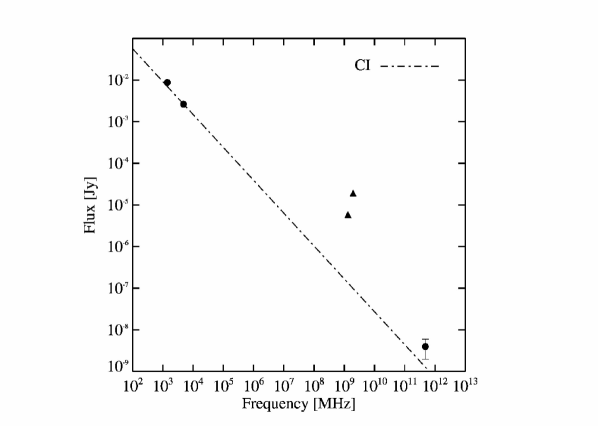
Extrapolation of the best-fit X-ray spectral model to radio frequencies reveals good agreement with the measured 1.4 GHz and 4.8 GHz nuclear radio fluxes. Further, the continuous injection synchrotron model of Heavens & Meisenheimer (1987) produced an acceptable fit to the X-ray, 1.4 GHz, and 4.8 GHz nuclear fluxes (see Figure 9). These results suggest the nuclear X-ray source may be unresolved synchrotron emission from the jets which are obvious in the high-resolution 4.8 GHz radio image. Regardless, there is no indication the X-ray source is the remnant of a very dense, hot gas phase which might be associated with a prior or on-going accretion event.
3.6. AGN-BCG Interaction and Constraints on Star Formation
The BCG’s stellar structure and star formation properties were investigated using archival observations from the Hubble Space Telescope (HST), GALEX, and the XMM-Newton/Optical Monitor (XOM). HST imaged RBS 797 using the ACS/WFC instrument and the F606W (4500–7500 Å; ) and F814W (6800–9800 Å; ) filters. Images produced using the Hubble Legacy Archive pipeline version 1.0 were used for analysis. The HST + image is shown in Figure 10. Comparison of the HST and CXO images reveals the BCG coincides with the nuclear X-ray source. The BCG has the appearance of being bifurcated, perhaps due to a dust lane, and there is no evidence of an optical point source. There are also several distinct knots of emission in the halo, and a faint arm of emission extending south from the BCG. There are two ACS artifacts in the image which begin at and from the BCG center. Within a aperture centered on the BCG, the measured magnitudes are mag and mag, consistent with non-HST measurements of Fischer et al. (1998), indicating the HST photometry in this region is unaffected.
RBS 797 was imaged in the far-UV (FUV; 1344–1786 Å) and near-UV (NUV; 1771–2831 Å) with GALEX, and the near-UV with the XMM-Newton/Optical-Monitor (XOM) using filters UVW1 (2410–3565 Å) and UVM2 (1970–2675 Å). The pipeline-reduced observations of GALEX Data Release 5 were used for analysis, and the XOM data was processed using SAS version 8.0.1. RBS 797 is detected in all but the UVM2 observation as an unresolved source co-spatial with the optical and X-ray BCG emission. The individual filter fluxes are Jy, Jy, Jy and Jy, all of which lie above the nuclear power-law emission we attribute to unresolved jets (see Section 3.5 and Figure 9).
A radial color profile of the central ( kpc) was extracted from the HST images and fitted with the function , where [mag dex-1] is the color gradient, is radius, and [mag] is a normalization. The best-fit parameters are and for (DOF) = 0.009(21), revealing a flat color profile.
BCGs, and elliptical galaxies in general, have red centers and bluer halos due to the higher metallicity of the central stellar populations (Mackie et al., 1990). BCGs in cooling flows with significant star formation have unusually blue cores relative to the quiescent halos (e.g. Rafferty et al., 2006). Our analysis shows a flat color profile, which is consistent with a modest level of nuclear star formation, but is inconsistent with star formation occurring at several tens of solar masses per year. Lacking calibrated colors, the color gradient analysis alone is ambiguous, since other factors, such as dust, emission line contamination in the passbands, and metallicity variations can alter the profile slope.
Star formation rates were estimated from the UV fluxes using the relations of Kennicutt (1998) and Salim et al. (2007). We estimate rates in the range 1–10 (see Table 4), which are probably consistent with the flat color profile. These estimates should be considered upper limits because sources of significant uncertainty, such as AGN contamination, have been neglected.
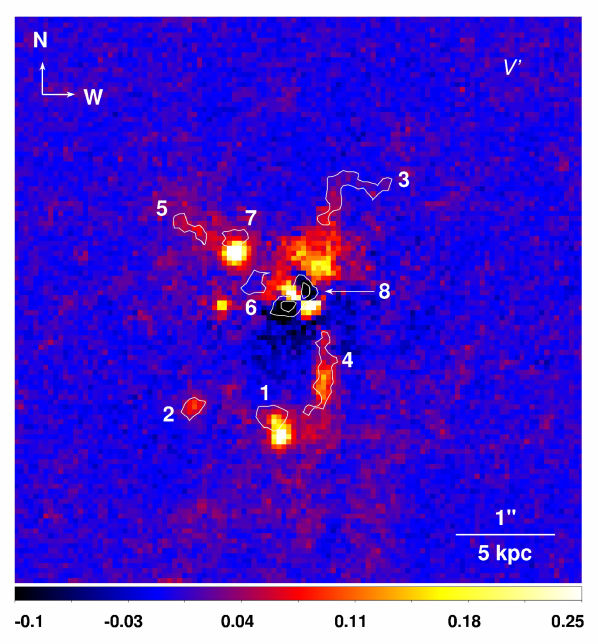
The HST images have revealed a great deal of structure in the BCG. In order to investigate this structure, residual galaxy images were constructed by first fitting the HST and isophotes with ellipses using the IRAF tool ellipse. Foreground stars and other contaminating sources were rejected using a combination of clipping and by masking. The ellipse centers were fixed at the galaxy centroid, and ellipticity and position angle were fixed at and , respectively – the mean values when they were free parameters. Galaxy light models were created using bmodel in IRAF and subtracted from the corresponding parent image, leaving the residual images shown in Figure 11. A color map was also generated by subtracting the fluxed image from the fluxed image.
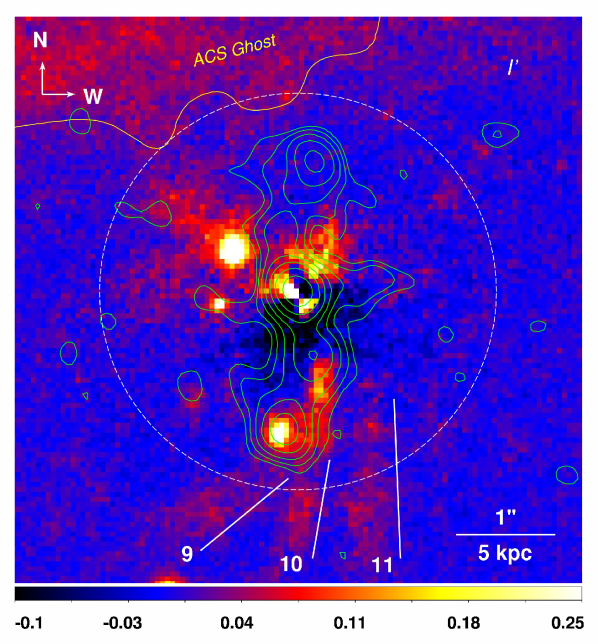
The close alignment of the optical substructure with the nuclear AGN outflow clearly indicates the jets are interacting with material in the BCG’s halo. An kpc radius spheroid kpc northeast of the nucleus resembles a galaxy which may be falling through the core and being stripped (see Sun et al., 2007a, for example). The numbered regions overlaid on the residual image are the areas of the color map which have the largest color difference with surrounding galaxy light. Regions 1–5 are relatively the bluest with , respectively. Regions 6–8 are relatively the reddest with +0.10, +0.15, and +0.18, respectively. Clusters like RBS 797 with a core entropy less than often host a BCG surrounded by extended nebulae (e.g. McDonald et al., 2010). Like these systems, the residual image reveals what appear to be 8–10 kpc long “whiskers” surrounding the BCG (regions 9–11). It is interesting that blue regions 1 and 4 reside at the point where the southern jet appears to be encountering whiskers 9 and 10.
It is unclear whether the structure is associated with dusty star formation, emission line nebulae or both. The influence of optical emission lines on the photometry was estimated crudely in the nucleus using the ratio of line EWs taken from Fischer et al. (1998) to HST filter widths. The nuclear contribution to the image is estimated at using the scaled line (see Section 3.4.1), and the combined , [O \@slowromancapii@], and [O \@slowromancapiii@] contribution to the nuclear image is . The observed structures have magnitude differences that significantly exceed these values, which suggests that emission lines alone may not be responsible for the structure. However, because the stellar continuum drops rapidly into the halo of the galaxy, bright knots of nebular emission would have larger equivalent widths at larger radii, and thus may be able to explain the extended structure.
4. Conclusions
We have presented results from a study of the AGN outburst in the galaxy cluster RBS 797. CXO observations have enabled us to constrain the energetics of the AGN outburst and analyze different powering mechanisms. We have shown the following:
-
1.
In addition to the two previously-known cavities near the cluster core, residual imaging reveals extensive structure in the ICM (Figure 3) associated with the AGN. The ICM substructure and deep cavity decrements lead us to speculate that the cavity system may be much larger and more complex than the present data allows us to constrain.
-
2.
We find that the two central cavities have surface brightness decrements that are unusually deep and are inconsistent with the cavities being spheres whose centers lie in a plane perpendicular to our line of sight which passes through the central AGN. Motivated by the decrement analysis, we propose that the cavities are either highly-elongated structures in the plane of the sky, or result from the superposition of much larger structures lying along our line of sight.
-
3.
Using the cavity decrements as a constraint, we estimate the total AGN outburst energy at erg with a total power output of . The cavities may be larger than we have assumed and we consider the energetics estimates to be lower limits. The thick, bright rims surrounding the cavities may also be signaling the presence of shocks, which would further boost the AGN energy output.
-
4.
We show that the AGN can be plausibly powered by accretion of cold gas, but accretion of hot gas via the Bondi mechanism is almost certainly implausible. We also demonstrate that the outburst could be powered by tapping the energy stored in a maximally spinning SMBH.
-
5.
Archival HST imagery has revealed a great deal of structure in the BCG associated with either star formation, nebular emission, or both. The association of the optical structure with the radio lobes and X-ray cavities indicates that the AGN is interacting with cooler gas in the host galaxy. While we are unable to determine if any regions of interest host star formation or line emission, the convergence of what appear to be extended optical filaments, bluish knots of emission, and the tip of one jet suggest there may be AGN driven star formation.
References
- Allen et al. (2006) Allen, S. W., Dunn, R. J. H., Fabian, A. C., Taylor, G. B., & Reynolds, C. S. 2006, MNRAS, 372, 21
- Anders & Grevesse (1989) Anders, E., & Grevesse, N. 1989, Geochim. Cosmochim. Acta, 53, 197
- Arnaud (1996) Arnaud, K. A. 1996, in Astronomical Society of the Pacific Conference Series, Vol. 101, Astronomical Data Analysis Software and Systems V, ed. G. H. Jacoby & J. Barnes, 17–+
- Band et al. (1990) Band, D. L., Klein, R. I., Castor, J. I., & Nash, J. K. 1990, ApJ, 362, 90
- Benson & Babul (2009) Benson, A. J., & Babul, A. 2009, MNRAS, 397, 1302
- Bîrzan et al. (2008) Bîrzan, L., McNamara, B. R., Nulsen, P. E. J., Carilli, C. L., & Wise, M. W. 2008, ApJ, 686, 859
- Bîrzan et al. (2004) Bîrzan, L., Rafferty, D. A., McNamara, B. R., Wise, M. W., & Nulsen, P. E. J. 2004, ApJ, 607, 800
- Blandford & Payne (1982) Blandford, R. D., & Payne, D. G. 1982, MNRAS, 199, 883
- Blandford & Znajek (1977) Blandford, R. D., & Znajek, R. L. 1977, MNRAS, 179, 433
- Blanton et al. (2001) Blanton, E. L., Sarazin, C. L., McNamara, B. R., & Wise, M. W. 2001, ApJ, 558, L15
- Bower et al. (2006) Bower, R. G., Benson, A. J., Malbon, R., Helly, J. C., Frenk, C. S., Baugh, C. M., Cole, S., & Lacey, C. G. 2006, MNRAS, 370, 645
- Cao (2002) Cao, X. 2002, ApJ, 570, L13
- Cassano et al. (2008) Cassano, R., Gitti, M., & Brunetti, G. 2008, A&A, 486, L31
- Cavagnolo et al. (2008a) Cavagnolo, K. W., Donahue, M., Voit, G. M., & Sun, M. 2008a, ApJ, 683, L107
- Cavagnolo et al. (2008b) —. 2008b, ApJ, 682, 821
- Cavagnolo et al. (2009) —. 2009, ApJS, 182, 12
- Crawford et al. (1999) Crawford, C. S., Allen, S. W., Ebeling, H., Edge, A. C., & Fabian, A. C. 1999, MNRAS, 306, 857
- Croston et al. (2010) Croston, J. H., Hardcastle, M. J., Mingo, B., Evans, D. A., Dicken, D., Morganti, R., & Tadhunter, C. N. 2010, ArXiv e-prints
- Croton et al. (2006) Croton, D. J., et al. 2006, MNRAS, 365, 11
- De Filippis et al. (2002) De Filippis, E., Schindler, S., & Castillo-Morales, A. 2002, arXiv e-prints: 0201349
- Dunn & Fabian (2006) Dunn, R. J. H., & Fabian, A. C. 2006, MNRAS, 373, 959
- Edge (2001) Edge, A. C. 2001, MNRAS, 328, 762
- Ferrarese & Merritt (2000) Ferrarese, L., & Merritt, D. 2000, ApJ, 539, L9
- Fischer et al. (1998) Fischer, J.-U., Hasinger, G., Schwope, A. D., Brunner, H., Boller, T., Trümper, J., Voges, W., & Neizvestnyj, S. 1998, Astronomische Nachrichten, 319, 347
- Frank et al. (2002) Frank, J., King, A., & Raine, D. J. 2002, Accretion Power in Astrophysics: Third Edition, ed. Frank, J., King, A., & Raine, D. J.
- Garofalo et al. (2010) Garofalo, D., Evans, D. A., & Sambruna, R. M. 2010, MNRAS, 820
- Gitti et al. (2006) Gitti, M., Feretti, L., & Schindler, S. 2006, A&A, 448, 853
- Graham (2007) Graham, A. W. 2007, MNRAS, 379, 711
- Häring & Rix (2004) Häring, N., & Rix, H. 2004, ApJ, 604, L89
- Heavens & Meisenheimer (1987) Heavens, A. F., & Meisenheimer, K. 1987, MNRAS, 225, 335
- Iwasawa & Comastri (1998) Iwasawa, K., & Comastri, A. 1998, MNRAS, 297, 1219
- Kalberla et al. (2005) Kalberla, P. M. W., Burton, W. B., Hartmann, D., Arnal, E. M., Bajaja, E., Morras, R., & Pöppel, W. G. L. 2005, A&A, 440, 775
- Kauffmann & Haehnelt (2000) Kauffmann, G., & Haehnelt, M. 2000, MNRAS, 311, 576
- Kennicutt (1998) Kennicutt, Jr., R. C. 1998, ARA&A, 36, 189
- Kormendy & Richstone (1995) Kormendy, J., & Richstone, D. 1995, ARA&A, 33, 581
- Kriss et al. (1983) Kriss, G. A., Cioffi, D. F., & Canizares, C. R. 1983, ApJ, 272, 439
- Mackie et al. (1990) Mackie, G., Visvanathan, N., & Carter, D. 1990, ApJS, 73, 637
- Magorrian et al. (1998) Magorrian, J., et al. 1998, AJ, 115, 2285
- McDonald et al. (2010) McDonald, M., Veilleux, S., Rupke, D. S. N., & Mushotzky, R. 2010, ApJ, 721, 1262
- McNamara et al. (2009) McNamara, B. R., Kazemzadeh, F., Rafferty, D. A., Bîrzan, L., Nulsen, P. E. J., Kirkpatrick, C. C., & Wise, M. W. 2009, ApJ, 698, 594
- McNamara & Nulsen (2007) McNamara, B. R., & Nulsen, P. E. J. 2007, ARA&A, 45, 117
- McNamara et al. (2005) McNamara, B. R., Nulsen, P. E. J., Wise, M. W., Rafferty, D. A., Carilli, C., Sarazin, C. L., & Blanton, E. L. 2005, Nature, 433, 45
- McNamara et al. (2010) McNamara, B. R., Rohanizadegan, M., & Nulsen, P. E. J. 2010, arXiv e-prints: 1007.1227
- Meier (1999) Meier, D. L. 1999, ApJ, 522, 753
- Meier (2001) —. 2001, ApJ, 548, L9
- Mewe et al. (1985) Mewe, R., Gronenschild, E. H. B. M., & van den Oord, G. H. J. 1985, A&AS, 62, 197
- Moustakas et al. (2006) Moustakas, J., Kennicutt, Jr., R. C., & Tremonti, C. A. 2006, ApJ, 642, 775
- Narayan & Yi (1995) Narayan, R., & Yi, I. 1995, ApJ, 452, 710
- Nemmen et al. (2007) Nemmen, R. S., Bower, R. G., Babul, A., & Storchi-Bergmann, T. 2007, MNRAS, 377, 1652
- Nulsen et al. (2005a) Nulsen, P. E. J., Hambrick, D. C., McNamara, B. R., Rafferty, D., Bîrzan, L., Wise, M. W., & David, L. P. 2005a, ApJ, 625, L9
- Nulsen et al. (2005b) Nulsen, P. E. J., McNamara, B. R., Wise, M. W., & David, L. P. 2005b, ApJ, 628, 629
- Peterson & Fabian (2006) Peterson, J. R., & Fabian, A. C. 2006, Phys. Rep., 427, 1
- Pizzolato & Soker (2005) Pizzolato, F., & Soker, N. 2005, ApJ, 632, 821
- Pizzolato & Soker (2010) —. 2010, MNRAS, 408, 961
- Rafferty et al. (2008) Rafferty, D. A., McNamara, B. R., & Nulsen, P. E. J. 2008, ApJ, 687, 899
- Rafferty et al. (2006) Rafferty, D. A., McNamara, B. R., Nulsen, P. E. J., & Wise, M. W. 2006, ApJ, 652, 216
- Reynolds et al. (2006) Reynolds, C. S., Garofalo, D., & Begelman, M. C. 2006, ApJ, 651, 1023
- Russell et al. (2010) Russell, H. R., Fabian, A. C., Sanders, J. S., Johnstone, R. M., Blundell, K. M., Brandt, W. N., & Crawford, C. S. 2010, MNRAS, 402, 1561
- Salim et al. (2007) Salim, S., et al. 2007, ApJS, 173, 267
- Salomé & Combes (2003) Salomé, P., & Combes, F. 2003, A&A, 412, 657
- Schindler et al. (2001) Schindler, S., Castillo-Morales, A., De Filippis, E., Schwope, A., & Wambsganss, J. 2001, A&A, 376, L27
- Schwope et al. (2000) Schwope, A., et al. 2000, Astronomische Nachrichten, 321, 1
- Seaquist (1993) Seaquist, E. R. 1993, Reports on Progress in Physics, 56, 1145
- Sijacki et al. (2007) Sijacki, D., Springel, V., di Matteo, T., & Hernquist, L. 2007, MNRAS, 380, 877
- Silk & Rees (1998) Silk, J., & Rees, M. J. 1998, A&A, 331, L1
- Soker (2006) Soker, N. 2006, New Astronomy, 12, 38
- Sun et al. (2007a) Sun, M., Donahue, M., & Voit, G. M. 2007a, ApJ, 671, 190
- Sun et al. (2007b) Sun, M., Jones, C., Forman, W., Vikhlinin, A., Donahue, M., & Voit, M. 2007b, ApJ, 657, 197
- Tremaine et al. (2002) Tremaine, S., et al. 2002, ApJ, 574, 740
- Vikhlinin et al. (2005) Vikhlinin, A., Markevitch, M., Murray, S. S., Jones, C., Forman, W., & Van Speybroeck, L. 2005, ApJ, 628, 655
- Wise et al. (2007) Wise, M. W., McNamara, B. R., Nulsen, P. E. J., Houck, J. C., & David, L. P. 2007, ApJ, 659, 1153
| Config. | ID | |||||||||
|---|---|---|---|---|---|---|---|---|---|---|
| - | - | kpc | kpc | kpc | kpc | Myr | Myr | Myr | erg | erg s-1 |
| (1) | (2) | (3) | (4) | (5) | (6) | (7) | (8) | (9) | (10) | (11) |
| 1 | E1 | |||||||||
| 1a | ||||||||||
| 1 | W1 | |||||||||
| 1a |
Note. — Col. (1) Cavity configuration; Col. (2) Cavity identification; Col. (3) Semi-major axis; Col. (4) Semi-minor axis; Col. (5) Line-of-sight cavity radius; Col. (6) Distance from central AGN; Col. (7) Sound speed age; Col. (8) Buoyancy age; Col. (9) Refill age; Col. (10) Cavity energy; Col. (11) Cavity power using .
| Row | Param. | Units | Config-1 | Config-1a |
|---|---|---|---|---|
| (1) | erg | |||
| (2) | ||||
| (3) | ||||
| (4) | ||||
| (5) | ||||
| (6) | ||||
| (7) | – | |||
| (8) | – |
Note. — Row (1) Cavity energy; Row (2) Cavity power; Row (3) Mass accreted; Row (4) Mass accretion rate; Row (5) Black hole mass increase; Row (6) Black hole mass growth rate; Row (7) Eddington ratio; Row (8) Bondi ratio.
| Absorber | Param. | DOF | Goodness | |||||||||
|---|---|---|---|---|---|---|---|---|---|---|---|---|
| - | - | keV | eV | - | - | - | - | |||||
| (1) | (2) | (3) | (4) | (5) | (6) | (7) | (8) | (9) | (10) | (11) | (12) | (13) |
| None | [2.4, 3.4] | [63, 119] | [8.4, 14.9] | 1.88 | 61 | 56% | ||||||
| Neutrala | [1.8, 3.0] | [31, 58] | [0.6, 1.8] | 0.354 | 1.17 | 60 | 29% | |||||
| Warmb | [1.8, 2.9] | [57, 44] | [0.9, 1.5] | 1.01 | 59 | 13% | ||||||
| Power-lawc | 0.5–7.5 | [1.8, 3.0] | [54, 35] | [0.9, 1.4] | 1.00 | 58 | % |
Note. — For all models, . Col. (1) XSPEC absorber models: () is zwabs, () is pcfabs, () is pwab; Col. (2) Absorbing column density; Col. (3) Power-law index; Col. (4) Power-law normalization with units () ph keV-1 cm-2 s-1 at 1 keV; Col. (5) Gaussian central energies; Col. (6) Gaussian widths; Col. (7) Gaussian normalizations with units () ph cm-2 s-1; Col. (8) Model-dependent parameter: () absorber redshift, () absorber covering fraction, () absorber power law index of covering fraction; Col. (9) Model 0.7-7.0 keV luminosity; Col. (10) Unabsorbed model bolometric (0.01-100.0 keV) luminosity; Col. (11) Reduced of best-fit model; Col. (12) Model degrees of freedom; Col. (13) Percent of 10,000 Monte Carlo realizations with less than best-fit .
| Source | ID | [Ref.] | ||
|---|---|---|---|---|
| - | - | ()/( ) | ||
| (1) | (2) | (3) | (4) | (5) |
| GALEX | NUV | [1] | ||
| XOM | UVW1 | [2] | ||
| GALEX | FUV | [2] | ||
| GALEX | FUV | [1] | ||
| XOM | UVM2 | [2] |