Bias Dependent Conductivity Fluctuations in Low-Doped La1-xCaxMnO3 Manganite Single Crystals
Abstract
Low frequency noise in current biased La0.82Ca0.18MnO3 single crystals has been investigated in a wide temperature range from 79 K to 290 K. Despite pronounced changes in magnetic properties and dissipation mechanisms of the sample with changing temperature, the noise spectra were found to be always of the type and their intensity (except the lowest temperature studied) scaled as a square of the bias. At liquid nitrogen temperatures and under bias exceeding some threshold value, the behavior of the noise deviates from the quasi-equilibrium modulation noise and starts to depend in a non monotonic way on bias. It has been verified that the observed noise obeys Dutta and Horn model of noise in solids. The appearance of nonequilibrium noise and its dependence on bias have been associated with changes in the distribution of activation energies in the underlying energy landscape. These changes have been correlated with bias induced changes in the intrinsic tunneling mechanism dominating dissipation in La0.82Ca0.18MnO3 at low temperatures.
pacs:
72.70.+m Noise processes and phenomena, 72.15.-v Electronic conduction in metals and alloys, 73.43.Jn Tunneling, 75.47.Gk Colossal magnetoresistanceI Introduction
Ultraslow relaxation in a variety of physical and nonphysical systems, manifesting itself in noise power spectral density (PSD) of the fluctuating observable quantity, with , continues to be one of the most exciting and puzzling effects attracting the attention of many research groups.DH ; weiss-rew The most commonly investigated low frequency fluctuations in solid state system are conductivity fluctuations. It is generally recognized that conductivity noise in solids arises from superposition of many elementary Lorentzian contributions of individual fluctuators with well defined and specifically distributed characteristics relaxation rates.weiss-rew Theoretical models of noise in solids relate changes in the noise PSD to changes in the energy landscape in which charge carriers are moving and dissipating energy. Therefore, studies of noise in solid state systems are important not only from the point of view of improving the performance of solid state devices but also provide a unique tool for understanding the nature and dynamics of transport processes in an investigated system.weiss-tool
The issue of noise in colossal magnetoresistance (CMR) manganites with general formulae R1-xAxMnO3, where R is a rare-earth ion and A a divalent or tetravalent cation, was addressed in many publications in the last decade. Almost all of them revealed prominent broad band conductivity fluctuations with PSD following law. Low-doped La1-xCaxMnO3 (LCMO) system exhibits metal-to-insulator (M-I) transition in the vicinity of Curie temperature . Above the M-I transition the conductivity of LCMO is dominated by hopping mechanism which strongly depends on oxygen stoichiometry and the tolerance factor. Sources of noise at were therefore initially associated with dynamics of oxygen vacancies. raquet
Early experiments concentrated on the noise peak associated with M-I transition, in the vicinity of which a 3 to 4 order of magnitude increase of the noise level has been observed in Ca and Sr doped manganites, see e.g. raquet ; raquetPRL ; podz ; alers ; ahn . The noise peak around M-I transition has been interpreted in terms of percolative nature of the transition between charge ordered insulating and metallic ferromagnetic states, podz or in terms of magnetic fluctuations coupled to the resistivity. alers It became however soon evident that this unusually large noise is not an intrinsic property of doped manganites. It was found that noise peak appears only in notably strained films while it is completely absent in single crystals and in high quality, almost strain-free, epitaxial films. reut ; palani ; ourAPL Small noise peak showing sometimes around in high quality samples could be easily suppressed by application of a small magnetic field and was attributed to magnetic fluctuations in the vicinity of the phase transition. Experimental observations of direct correlation between magnetic noise and magnetoresistance allowed to conclude that the enhanced noise originates in charge carriers density fluctuations. rana Current, temperature, and magnetic field dependence of noise in grain boundary junctions, provided clear evidence that noise is caused by localized states with fluctuating magnetic moments in heavily disordered grain boundary regions. phillip
Conductivity noise with spectrum is generally related to resistance fluctuations which are measured by applying dc current and recorded as voltage fluctuations. When the resistance fluctuations are just probed by current, and not influenced by its flow, then PSD of the noise scales as the square of the bias current. Such modulation noise is referred to as quasi-equilibrium noise. There is a mounting experimental evidence that quasi-equilibrium noise in doped manganites is accompanied by the noise that arises from, or is directly modified by, the passage of current through the sample. ourAPL ; barone ; nowak This type of noise is referred to as nonequilibrium noise, and its dependence on bias is considerably different from a quadratic one.
Our system of interest is La0.82Ca0.18MnO3 (0.18 LCMO) single crystal, a highly correlated electron system with a complex interplay of charge, orbital, and spin ordering, what leads to remarkable changes in transport characteristics and magnetic state of the sample with decreasing temperature. In this way 0.18 LCMO compound provides us with a unique opportunity of studying noise properties in the same solid-state sample, in markedly different transport regimes and magnetic properties, using temperature and current bias as independent factors modifying the state of the active fluctuators.
In this paper we demonstrate that equilibrium noise in La0.82Ca0.18MnO3 single crystals preserves its character under changing temperature, despite significant changes in magnetic and transport properties of the system. Bias dependent nonequilibrium fluctuations appear only at low temperatures, well below the Curie temperature. Properties of the nonequilibrium noise differ significantly from those of quasi-equilibrium one. A combined analysis of noise and transport characteristics permits us to associate marked changes in the noise behavior to changes in the low temperature intrinsic tunneling mechanism.
II Experimental background
La0.82Ca0.18MnO3 crystals were grown by a floating zone method using radiative heating.crystal The crystallographic orientations of the crystal and wafers were determined by Laue method with accuracy of . X-ray data of the crystal were compatible with the perovskite structure orthorhombic unit cell, Å, Å, Å. The as-grown crystal, in form of a cylinder, about 4 cm long and 4 mm in diameter, was cut into individual small rectangular 6 3 2 mm3 bars, with the longest dimension along the crystallographic direction. Current and voltage leads were indium soldered to gold/chromium contacts deposited by thermal evaporation in vacuum.
For noise measurements the sample was thermally anchored to the sample holder of a variable temperature liquid nitrogen cryostat. Conductivity noise was measured in a conventional 4-point contact arrangement by biasing the sample with dc current supplied by high output impedance current source and measuring the resulting voltage fluctuations. Four in-line contacts were placed along the longest dimension of the bar. The separation between voltage contacts was 0.3 mm. The voltage signal was amplified by a home made room temperature low noise preamplifier, located at the top of the cryostat, and further processed by a computer assisted digital signal analyzer. To eliminate environmental interferences and noise contributed by the measuring chain, the PSD measured at zero current was subtracted from the data obtained at a given current flow for each measurement.
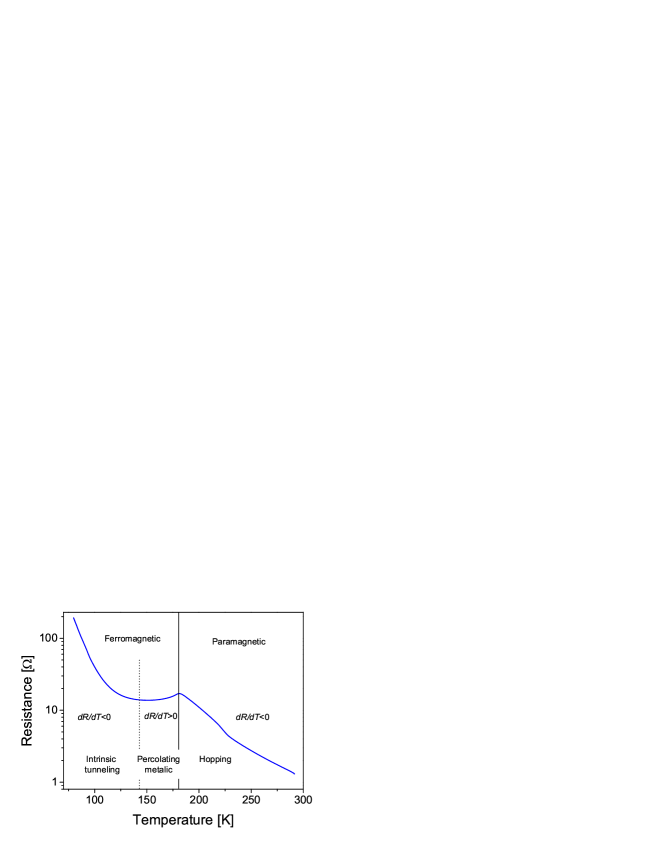
Remarkable changes in transport properties and magnetic state of 0.18 LCMO system upon changing temperature are illustrated in Fig. 1. At high temperatures the sample is in paramagnetic insulating state and the resistivity, dominated by hopping mechanism, increases with decreasing temperature. The resistivity reaches a pronounced maximum related to the metal-insulator (M-I) transition at K. The maximum appears at temperature very close to the Curie temperature of the paramagnetic-to-ferromagnetic transition. determined by independent magnetization measurements is K. Intrinsic phase separation (PS) associated with metal-insulator (M-I) transition at leads to percolation conductivity in the ferromagnetic (FM) state at . Therefore, at temperatures below the magnetic ordering temperature the resistivity decreases in a metallic-like way with , although its absolute value is much higher than that of common metals. With further temperature decrease, the resistivity reaches a shallow minimum around K, followed by a strong upturn at temperatures below some 100 K.
Detailed magnetic measurements of our sample did not reveal any peculiarities at temperatures below , suggesting that in the investigated temperature range there is only one magnetic transition at . Low temperature resistivity is dominated by tunneling across intrinsic barriers associated with extended structural defects, such as twins and grain boundaries, and/or with inclusions of insulating FM phase interrupting metallic percolating paths.PRB018
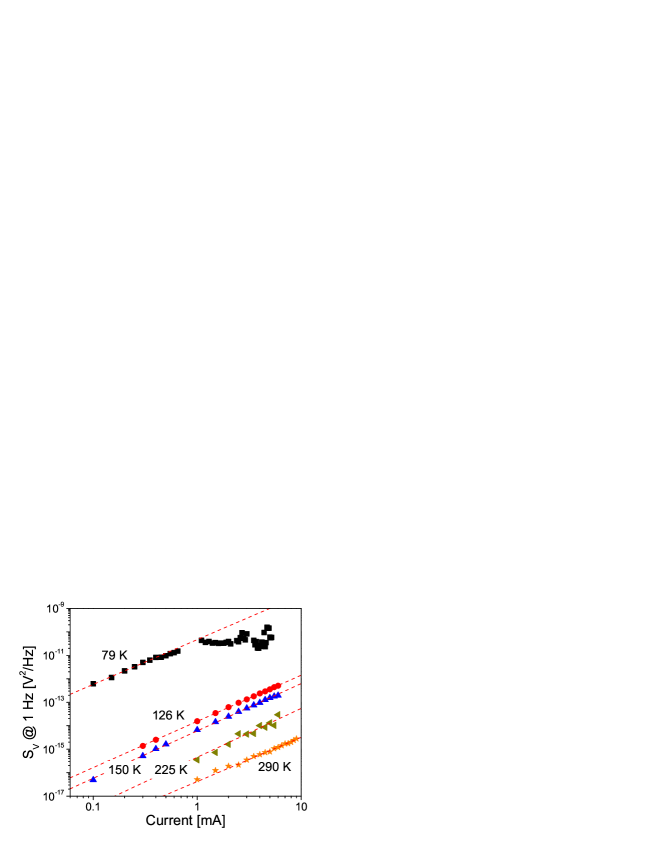
Despite changes in the dissipation mechanism and magnetic state of the sample, the experimentally observed voltage noise was found to have spectrum in the entire investigated temperature and bias range. To get a first insight into the nature of the observed noise, we have measured the dependence of the noise intensity on bias current. We found that for all temperatures, with the exception of the 79 K data, for currents exceeding 1 mA, the noise intensity scales as the square of the bias current, as illustrated in Fig. 2. Proportionality of voltage noise to the current squared indicates that the noise is due to bias independent resistivity fluctuations which are unaffected by the current flow.
At low temperatures, where electrical transport in our sample is dominated by tunneling mechanism,PRB018 at currents exceeding some threshold current 1 mA, the proportionality of the voltage noise to breaks down and the resistivity fluctuations start to be influenced by the current. This is a manifestation of a nonequilibrium noise similar to that frequently observed in nonlinear, nonohmic systems. zygulski However, in a difference to other nonlinear systems, the crossover to nonequilibrium noise in our sample is not associated with the onset of strong nonlinearity in the current-voltage characteristics. nowak Moreover, the intensity of nonequilibrium noise initially decreases with increasing bias, to change in a nonmonotonic way with further increase of the bias.
The puzzling properties of the low temperature noise in La0.82Ca0.18MnO3 single crystalline sample should be related to the underlying changes in its transport properties. An efficient way to approach the problem is to detect possible changes in the energy environment of the fluctuators responsible for the noise. A tool for such analysis is provided by relevant theoretical models of nonexponential relaxation kinetics resulting in noise. DH ; weiss-rew
III Theoretical background
III.1 1/f noise in solids
noise spectra in condensed-matter systems are believed to come from assembly of elementary fluctuators with well defined characteristic relaxation rates . The spectrum of each elementary fluctuator is Lorentzian, and the resulting normalized PSD of the fluctuating quantity ,
| (1) |
will have form, with for the distribution function . If the elementary fluctuators are thermally activated, the characteristic rate , and the required distribution of is provided by flat distribution of activation energies, .
Dutta and Horn, (DH) have shown that spectra with arise not only for but also for the distribution function that does not vary much in the range of from till , where and are the lowest and the highest frequency of the measurements DH . For a detailed discussion of DH model assumptions see reference weiss-rew, .
When is a slowly varying function of the activation energy then
| (2) |
In the majority of solid state systems is a constant of the order of phonon frequencies Hz. DH But if a disordered system undergoes a phase transition at transition temperature , then for the noise spectra in the vicinity of we obtain the same Eq. 2 but with replaced by , where is the correlation length and is a dynamic critical exponent. imry As a result, while analyzing experimental data using Eq. 2 one may obtain unreasonably large values of .
In the experiments we have measured the noise in the frequency range from Hz to Hz. Therefore, may be considered as a small addition to and we can further expand the function from the right-hand side of Eq. (2) as
| (3) |
Within the DH approximation, at low frequencies, -vs.- dependence should be linear at a fixed temperature. It follows from Eqs. 2 and 3 that the slope of -vs.- plot is proportional to . This slope is directly related to PSD exponent through a general relation
| (4) |
DH model leads to a specific relation between temperature derivative of the spectral density and the derivative
| (5) |
Equation (5) contains crucial reciprocity between the frequency and temperature dependence of the noise magnitude and is frequently used as a self-consistency test for the validity of DH approach for a given physical system. The relevant test consists in verifying whether the dependence of the noise intensity on frequency at a constant temperature, and on temperature at a constant frequency, are consistent with each other. If this is the case, one may use Eq. (2) to attribute a single distribution of activation energies to the ensemble of active fluctuators. Flat distribution of temperature independent activation energies in DH model gives rise to a pure spectrum and a linear temperature dependence of the noise level at low frequencies. Departures of from unity indicate non-zero derivatives of energy distribution , and excess of high (), or low energy () fluctuators in the ensemble.
III.2 Inelastic transport across an inhomogeneous medium.
At lowest temperatures studied in the experiment, charges in the investigated system are transmitted by tunneling across classically forbidden regions. Electron wave functions in tunneling barriers decay exponentially over the characteristic length . When the decay length exceeds the barrier thickness , then direct tunneling, both elastic and inelastic, dominates the conduction mechanism. Elastic contribution to the differential conductance -versus-voltage characteristic is a parabola Wolf , with
| (6) |
where is proportional to .
The inelastic contribution to the differential conductance is given by with the Eliashberg electron-boson interaction function . Wolf For most metals, in the case of phonons as mediating bosons, the shape of the average Eliashberg spectral function resembles that of the phonon density of states . Maximov Let us look, for example, at obtained in neutron scattering experiments for a polycrystalline sample of La0.625Ca0.375MnO3. Adams One can see that, within the range of 10 to 70 meV, the average deviation of the phonon density of states from its mean value does not exceed 20 %. Therefore, in this energy interval one may use the approximation , which results in a linear behavior of vs. ; . kirtley Such situation has been frequently observed in disordered perovskite oxides, high cuprates and various CMR manganites. bel
With increasing thickness of the tunneling barrier, hopping along chains of localized states is favored. While hopping along localized states path, a carrier does not cross quantum-mechanically the entire distance between the electrodes, but rather jumps from the junction electrode to the first state, lose the phase memory, moves to the second nano-island and, eventually, after completing all the hopping path, jumps to the opposite electrode. Such case was considered by Glazman and Matveev GM ; Beasley in their model (GM) of indirect tunneling in disordered materials. The GM model applies very well to low temperature transport in perovskite manganites. PRB018 ; gross ; bertina
In the GM model, temperature and voltage dependencies of the tunnel conductance are expressed as multistep tunneling via localized states:
| (7) |
where conductance represents bias and temperature independent elastic tunneling term, while describe tunneling through localized states.
| (8) | |||
| (9) |
where coefficients and depend exponentially on barrier thickness.
Resuming, the differential conductance of a thin, inhomogeneous, insulating barrier is a power function of the voltage, see also Ref. CEJP, ,
| (10) |
where index characterizes the tunneling regime: corresponds to elastic tunneling with the energy relaxation in the conducting regions of the system, whereas other are signatures of inelastic tunneling in which an electron losses its energy inside the insulating region. By finding the value of index from experimental data one can infer information about the physics of electron transport processes across the dielectric layer.
IV Results and discussion
IV.1 Applicability of DH model
It should be noticed that deviations or inconsistencies with DH model in solid state systems are rare.weiss-rew In particular, it has been already demonstrated that noise in various half-metallic oxides obeys the DH model.raquet Nevertheless, as a first step we perform tests of the applicability of DH model to our data by checking the reciprocity condition expressed in Eq. (5) which relates the temperature and frequency derivatives of the dimensionless PSD at fixed and values. Figure 3 compares left and right sides of Eq. (5) for frequency equal to 2 Hz, current bias of 1.5 mA and all temperatures studied. The overall agreement is good, including also the 79 K data, and even the change of the sign around 175 K is well reproduced in the both dependencies.
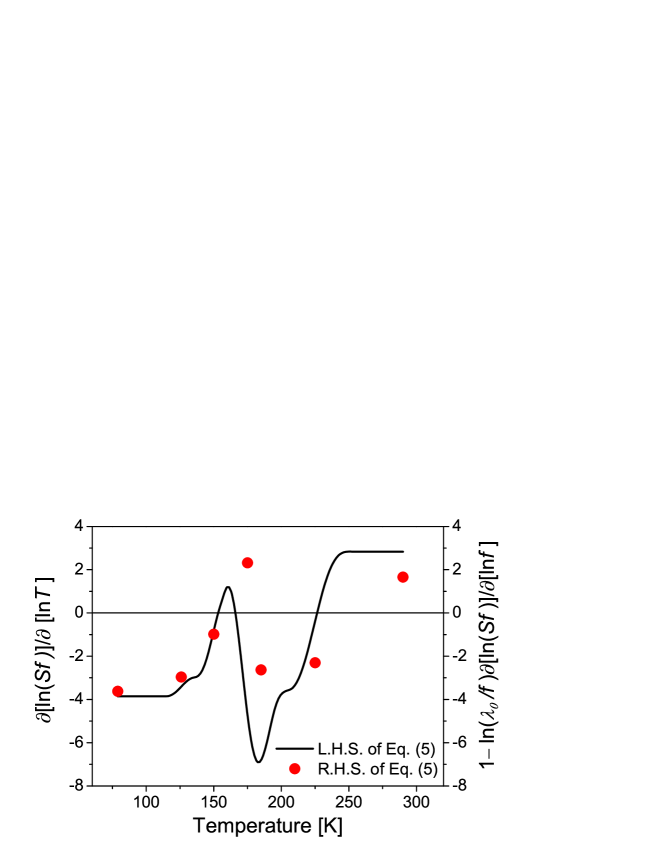
Canonical DH approach assumes that is temperature independent. We find a small violation of this assumption for temperatures around Curie temperature . The parameter estimated from the best agreement, in the least-squares sense, between two dependencies plotted in Fig. 3 was found to be Hz. Thus obtained is physically reasonable, although it is about two orders of magnitude higher than a typical phonon frequency. We attribute this discrepancy to the existence of the phase transition in the investigated system at K. weiss-rew ; imry Indeed, separate estimations of for each individual temperature render values close to the expected phonon frequency at high and low temperatures, while values of for temperatures close to are unphysical and diverge.
We conclude that the frequency-temperature dependence reciprocity condition is fulfilled and that the observed noise does obey the DH model in entire investigated temperature range. We are allowed therefore, to assume that the observed noise is due to thermally activated kinetics of active fluctuators with the distribution of activation energies given by Eq. (2), and the derivative of activation energy distribution proportional to the slope of -vs.- characteristics.
IV.2 Quasi-equilibrium noise.
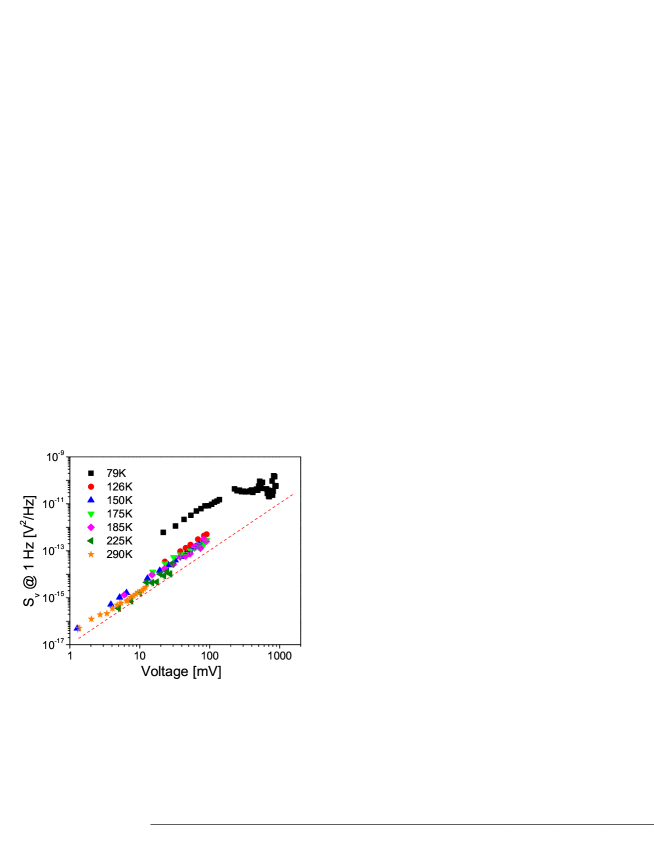
Figure 4 shows the data from Fig. 2 replotted as a function of bias voltage. Within the experimental accuracy data recorded at all temperatures, with the exception of K, collapse into single line . This is equivalent to the statement that , meaning that the reduced spectral density of resistance fluctuation is temperature independent. Temperature independent implies that the dependence of resistance fluctuations on temperature follows the temperature dependence of the resistance of the sample . Experimentally revealed condition assures as well that the coupling of the fluctuators to resistance fluctuations is temperature independent. Observe that temperature independence of the coupling of system fluctuations to the measured physical parameter is one of the most problematic condition assumed in the Dutta-Horn model of noise and its violation frequently leads to some deviations of the experimental data from the simplest version of the model.weiss-rew On the other hand the temperature independence of the above coupling is quite surprising result if one takes into account pronounced changes of the magnetic state and dissipation mechanism in the sample with changing temperature.
Upper panel of Figure 5 shows data recorded at 150 K for different bias currents and plotted as a function of , while the lower panel shows the same data normalized by dc voltage squared, .
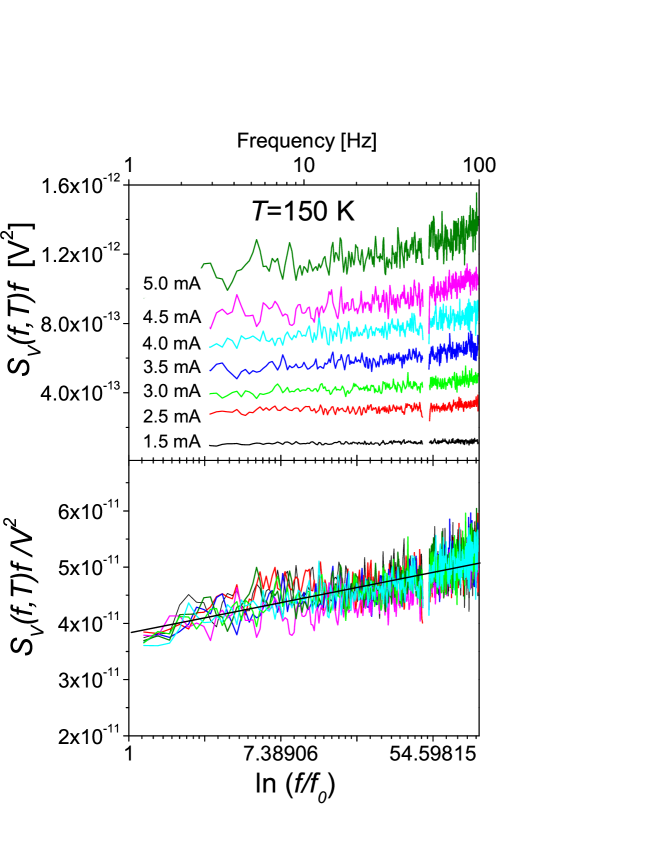
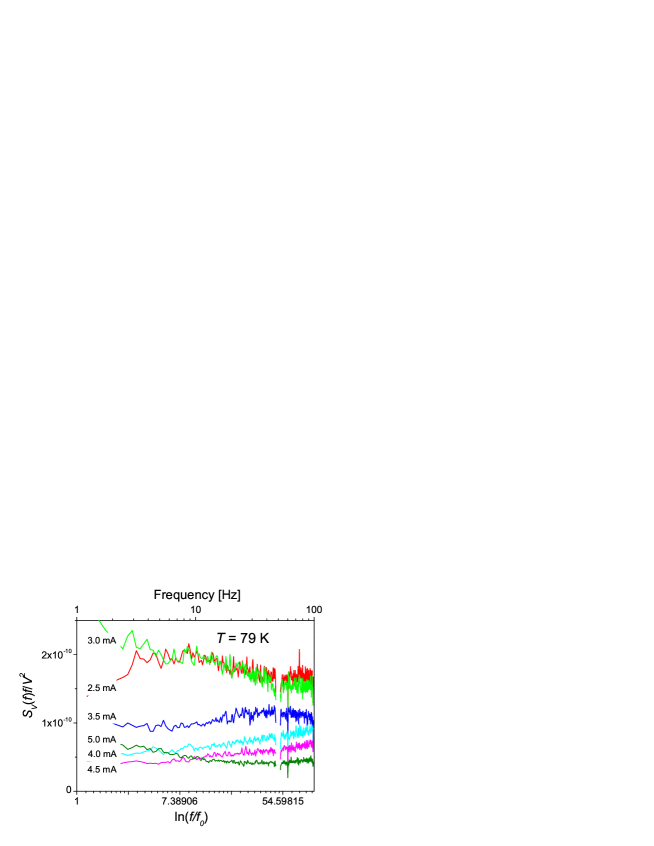
First of all, one observes that vs. at a fixed temperature is indeed a linear function as predicted by Eq. (3) (similar results were obtained for other currents as well). Moreover, all normalized spectra recorded at different currents collapse to a single line, consistently with the dependence of the equilibrium noise. The conductivity noise at 150 K is thus only probed and not modified by current flow. By fitting the normalized data to a linear function (a solid straight line in Fig. 5) one obtains the derivative . Therefore, we may conclude immediately that at K bias current has no influence whatsoever on the distribution of activation energies since the slope of each spectrum is the same within the experimental accuracy, meaning that does not depend on bias. The same independence of the slope factor, and consequently function, on current has been confirmed for all temperatures with exception of 79 K data. Here, even a brief look at the plot -vs- from Fig. 6 proves that at 79 K, in a marked difference to higher temperatures, the distribution function and its derivative are strongly influenced by the current flow. This is reflected in a strong dependence of the spectral exponent on current flow at 79 K, see Eq. 4, in contrast to a very weak current influence on at higher temperatures.
IV.3 Nonequilibrium noise.
In order to measure resistance fluctuations in the equilibrium state, a small current is applied to a sample with the only aim to convert the resistivity fluctuations into measurable voltage noise. In this case the dimensionless PSD spectrum is a constant which does not depend on voltage, or current, bias.
It can be clearly seen in Figs. 2 and 4, that noise at 79 K looses its equilibrium character at bias exceeding 1 mA, or equivalently, 200 mV. Above the threshold bias the noise is no more proportional to bias squared. The nonequilibrium noise intensity changes in a nonmonotonic way with increasing bias and decreases with increasing bias at certain bias ranges.
There are several reasons why it may happen. We shall discuss here four possibilities which can have direct relation to our study. The first two are artifacts associated with shunting parts of the sample under the voltage contacts by the contact pads or simple overheating of a sample due to dissipation at high current biases. The third possibility is a direct influence of the external bias on elementary fluctuators. Let us consider a single two-state system with equal activation energies of both states, symmetric two well energy structure, at zero bias. If the energy structure of the fluctuator is stressed by the bias, the energy difference between metastable states 1 and 2 will increase with increasing bias. The total switching rate is a sum of the two switching rates for two metastable states. Machlup This mechanism may lead to increasing asymmetry in the energy structure of the involved fluctuators and, consequently, in a decrease of noise intensity with increasing bias. A fourth possibility of remarkable bias enforced modifications of the noise PSD, which would be most important for inhomogeneous samples, are changes in the mechanisms of electron transmission through the investigated sample.
Let us first convince the reader that the observed nonequillibrium noise is not an artifact resulting simply from contacts influence or overheating of the sample by flowing current, as indicated above. At low temperatures the resistivity of the LCMO crystal increases by more than an order of magnitude. Therefore, voltage contacts shunting effects may become significant, in particular for contacts separated by distances comparable, or smaller than the sample thickness, as in our case. However, one expects shunting to manifest itself as a weaker than quadratic dependence of the noise power on bias, but not as a decrease of the noise with increasing bias, as in our experiments. The decisive test for contacts effects consisted in comparing the results of standard 4-point measurements with data obtained in an inverted contact arrangement, in which current was fed into the sample through inside pair of voltage contact and voltage noise measured at outside current contacts. The bias at which the onset of nonequillibrium noise appears in the inverted contact arrangement was found to be the same as the onset bias measured using standard contact arrangement. Moreover, in early experiments we have used much bigger, 2.6 mm separation between the voltage contacts. The measured value of low temperature resistivity of our sample was not dependent on the distance between the voltage contacts. Together, the above observations enabled us to reject the possibility that low temperature noise behavior is associated with contact artifacts.
The increase of the resistance by more than an order of magnitude leads to increase of the the power dissipated in the sample with respect to the power dissipated at higher temperatures at the same current flow. This is clearly seen in Fig. 4 where the nonequillibrium noise at 79 K appears at bias voltages, and power levels, significantly exceeding those reached at higher temperatures. Temperature independence of the normalized spectral density of resistivity fluctuations causes the measured noise to follow the temperature evolution of the sample resistance squared. At temperatures below K the resistance decreases with increasing temperature, see Fig. 1. Therefore, one may suspect that decrease of the noise at 79 K for currents above 1 mA and deviations from the equilibrium quadratic scaling may be due to simple overheating by current flow. Indeed, it is possible to explain qualitatively the noise behavior if one assumes that current flow above 1 mA increases the temperature of the sample, thus causing the resistivity decrease, what should lead to the decrease of the noise. This scenario requires however huge overheating of the sample by almost 100 K. This is unlikely in our experimental arrangement. Moreover, the changes in sample resistance measured at 79 K as a function of current are negligible with respect to those required to explain the noise behavior by overheating. Therefore, a simple overheating scenario outlined above cannot explain our data.
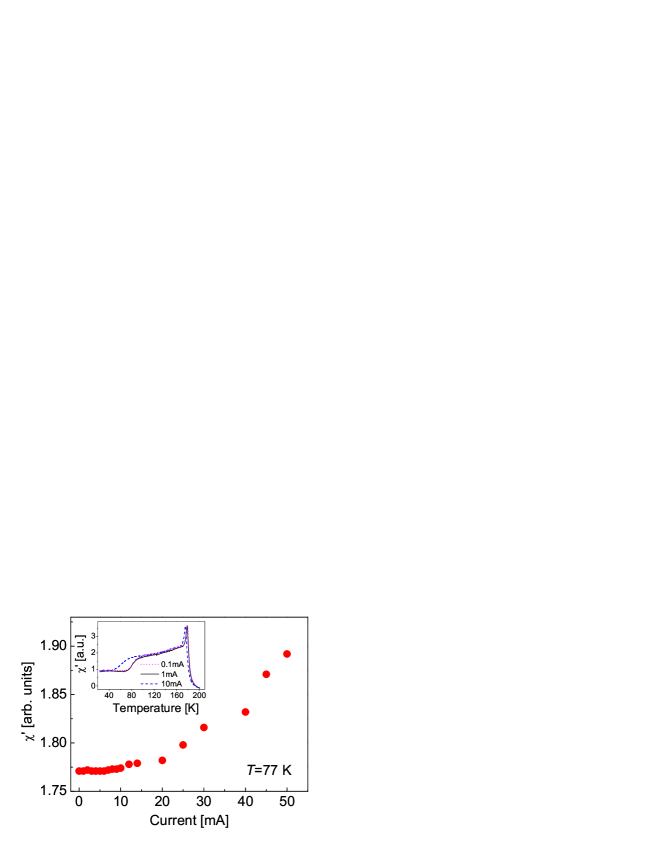
Nevertheless, to completely reject the plausibility of the overheating scenario we have performed independent measurements of the sample magnetic susceptibility under current flow. Figure 7 shows the real part of magnetic susceptibility as a function of dc current, while the insert demonstrates the temperature dependence of susceptibility measured at different currents. It is evident that at 77 K there is noticeable increase of the sample temperature for currents above mA. This current level is almost an order of magnitude higher than the threshold current at which nonequilibrium noise appears. Therefore, independent measurements of temperature and current dependence of magnetic susceptibility enable us to fully reject the overheating scenario.
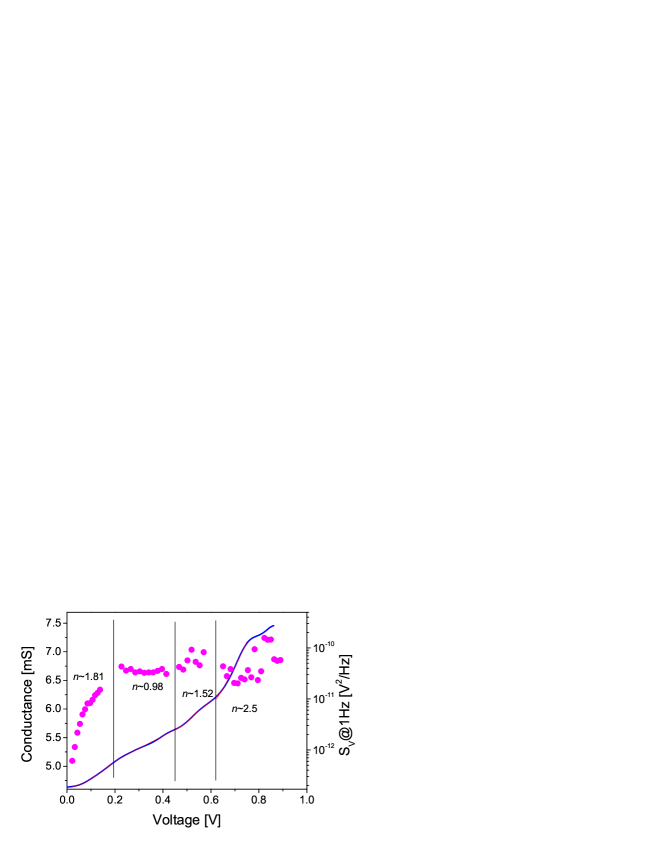
To find the real origin of the noise evolution with increasing bias at 79 K, we have performed the measurements of the voltage dependence of the differential conductance and compared it with Eq. 10. We have determined the conductance exponent by fitting the characteristics to Eq. 10 in several voltage ranges and verified the results by differentiating the experimental curves and calculating the value of as
| (11) |
Figure 8 shows details of the dependence of noise intensity and sample conductance on bias voltage at 79 K, together with the evaluated values of exponents . We find that for voltages below 195 mV . Most probably, the dominating tunneling mechanism in this voltage range is direct elastic tunneling across the insulating interlayer between the conducting banks, see the previous section. For the bias range between the two first maxima of the noise, i.e. between 195 and 450 mV, the dependence is almost linear with . It has been argued kirtley that a linear conduction background with appears due to strong direct inelastic tunneling involving a broad continuum density of states of bosonic excitations inside the tunneling barrier. This situation has been frequently experimentally observed in disordered perovskite materials like high- superconductors and various CMR manganites. bel
For voltages between 450 mV to 620 mV, i.e., above the second peak of the noise, we find that is composed of two shifted nonlinear pieces, each with , giving the overall exponent in this range . At voltages between 620 and 870 mV, i.e., above the second peak, we find . The two last voltage ranges correspond to indirect inelastic tunneling via more than two conducting inclusions inside the insulating interlayer. GM
Changes of the exponent reflect changes in the conduction mechanism. As we have discussed in details previously, the electron transport in La0.82Ca0.18MnO3 at low temperatures is dominated by intrinsic tunneling mechanism. PRB018 It is therefore tempting to analyze the behavior of the exponent in terms of changing tunneling mechanisms. This approach encounters, however, formal difficulty associated with the fact that our sample does not constitute a well defined single tunnel junction. The tunneling conductance in bulk La0.82Ca0.18MnO3 is associated with intrinsic tunnel barriers appearing spontaneously along the ferromagnetic metallic percolation paths.PRB018 The exact nature and individual properties of the barriers cannot be characterized as one has an experimental access only to some averaged ensemble-like tunnel characteristic of the sample. Therefore, we can only approximate the characteristics of intrinsic junctions with the known characteristics of well defined discrete junctions.
The scenario in which the noise intensity varies with changing bias due to changes in conduction mechanism can be outlined as follows. At low bias voltages a direct tunneling mechanism is dominating, is close to 2 for dominantly elastic charge transmissions and close to 1 in the inelastic tunneling regime. Crossover to nonequilibrium noise is associated with the change of from 2 to 1, i.e., from elastic to inelastic transmission, which occurs when . At higher voltages the probability of indirect inelastic tunneling is much higher since the number of involved localized states in the barrier grows with increasing bias. Beasley The conductivity of an inelastic channel increases exponentially with increasing number of the localized states in the barrier. Therefore, the current is shunted by channels with higher whenever available. The experimentally determined exponent corresponds to admixture of indirect tunneling through channels with two () and three () localized states in the barrier. A similar mechanism has been invoked previously to explain unusual decrease of the noise with increasing bias in magnetic tunnel junctions. nowak
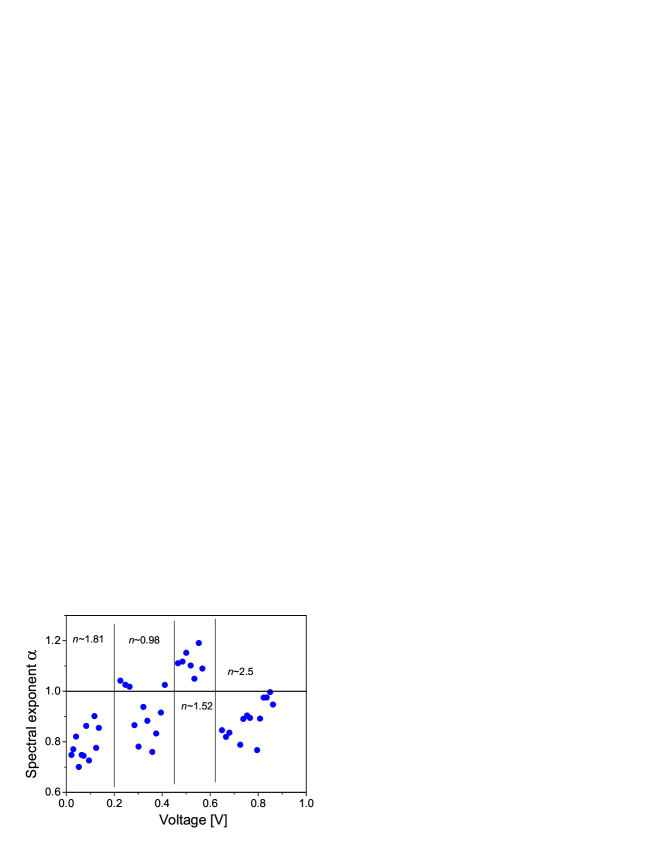
Figure 9 shows how the spectral exponent at 79 K behaves with increasing voltage bias. The exponent reflects directly changes in the derivative obtained from the slope of -vs-ln characteristics and related to by Eq. (4). Figures 8 and 9 evidence apparent correlations between the behavior of the noise, evolution of the exponent , and corresponding values. It seems that significant changes in the difference , or equivalently the changes of the sign of the derivative , appear in close vicinity of voltages for which , i.e. for voltages at which the distribution function is a constant independent on the magnitude of an activation energy.
Changes of the conduction mechanism, reflected by changes in , are accompanied by clear noise peaks. The peaks can be seen as manifestation of excess partition noise at specific voltages at which alternative inelastic channels with different are available for electron transfer. We conclude that Figs. 8 and 9 evidence a clear correlation between bias induced changes in the noise and modifications of characteristics reflecting changes in the intrinsic tunneling mechanism.
The explanation of noise decrease with increasing bias can be straightforwardly based on a scenario in which bias causes changes in the symmetry of two level fluctuators in the ensemble responsible for generating the observed noise. Elementary fluctuators in intrinsic tunnel junctions can be associated, for example, with charge traps within tunnel barriers and two distinct states of a fluctuator with empty and loaded state of the trap, or alternatively, with charged oxygen vacancies jumping between two sites. Electrostatic field of the charge trap modulates the height of the tunnel energy barrier and, consequently, the resistivity of the junction, according to the trap occupancy state.
An alternative mechanism consists in bias induced changes to the regions where relaxation of tunneling charges takes place. At low bias, when elastic tunneling dominates, the transmitted electrons relax energy in conducting regions through interactions with bosonic degrees of freedom, whereas for inelastic tunneling the relaxation occurs inside the insulating barriers. If in the latter case the activation energy of defects within the barrier is higher than that of the conducting regions, then the noise will decrease with increasing intensity of the inelastic tunneling events. The observed bias induced changes in distribution with changing bias do allow, at this stage, to choose one from the above discussed scenarios. One has however to note that the energy threshold corresponding to the onset on nonequlibrium noise at threshold bias of 200 mV is much lower than the activation energy of oxygen vacancies in perovskites. At the same time we observe that this is the energy level of the Jahn-Teller distortions in manganites. Jooss
V Conclusions
In conclusion, we have investigated conductivity fluctuations in current biased La0.82Ca0.18MnO3 single crystals in a wide range of bias current and temperature, a very good model object for studying the noise processes in inhomogeneous conducting media since different magnetic and electric transport properties within a temperature interval from the liquid-nitrogen temperature up to ambient one. The observed noise retains spectra in entire experimentally explored range of bias and temperature despite pronounced changes in the dissipation mechanism and magnetic state that occur in the same range. The voltage noise measured at constant current bias was found to have characteristics of a quasi-equilibrium modulation noise with intensity scaling as , indicating that the conductivity fluctuations are only revealed by the current flow and not stimulated or modified by it. Only at liquid nitrogen temperatures the observed noise behaves like nonequilibrium one and its intensity not only does not scale with the square of the bias but even decreases locally with increasing bias.
We have verified that in entire experimentally investigated range the noise fulfils the Dutta-Horn model frequency-temperature reciprocity condition. We have concluded therefore that noise in our system arises from a superposition of thermally activated processes with broad distribution of activation energies. However, basing this conclusion just on the consistency between temperature and frequency dependence of the noise has to be taken with the grain of salt since the noise model based on serious kinetics of a random walk in random potential (RWRP), a model that in principle could apply well to our 0.18 LCMO sample, produces frequency-temperature reciprocity relation identical to Eq. (5). Only in-depth analysis of non-Gaussian components of the noise, provided they exist, enables one to distinguish between the reality of two models.weiss-rew We did not observe any non-Gaussian noise components in the experiment and are unable to distinguish between the two models.
Nevertheless, we have tentatively accepted the conclusion that the noise indeed arises from the DH mechanism and inferred the distributions of activation energies in the elementary fluctuations ensembles by analyzing the power spectral density of the noise within the framework of the DH approach. We have found that the appearance of a nonequilibrium noise is directly linked with the onset of bias dependence of the distribution of activation energies . We have found clear correlations between the changes of the energy distribution and the power exponent of the curves. Changes in the power exponent, i.e., the hallmarks of the changes in the dissipation mechanism, are correlated with changes in the noise behavior. We have discussed two possible scenarios: (i) a direct influence of the electric field on fluctuators which in this case should be charged and (ii) an effect of the spatial change of the region where the electron energy dissipates during its traveling across an inhomogeneous sample. Both models are appropriate in our case and we are performing additional studies in order to reveal the most probable one.
The results obtained in the work open a perspective for applying the noise tool to investigate the nature and physics involved in metastable resistivity states which can be enforced in low-doped manganites by applying strong pulsed electric field/current at low temperature. PRB018 ; PRB020 Our first experiments have confirmed this assumption and their analysis will be published elsewhere.
Acknowledgements.
This research was supported by the Israeli Science Foundation administered by the Israel Academy of Sciences and Humanities (grant 754/09).References
- (1) P. Dutta and P. M. Horn, Rev. Mod. Phys. 53, 497 (1981).
- (2) M. B. Weissman, Rev. Mod. Phys. 60, 537 (1998).
- (3) M. B. Weissman, Annu. Rev. Mater. Sci. 26, 395 (1996).
- (4) B. Raquet, J. M. P. Coy, and S. von Moln ar, Phys. Rev. B 59, 12435 (1999).
- (5) B. Raquet, A. Anane, S. Wirth, P. Xiong, and S. von Moln ar, Phys. Rev. Lett. 84, 4485 (2000).
- (6) V. Podzorov, M. Uehara, M. E. Gershenson, T. Y. Koo, and S-W. Cheong, Phys. Rev. B 61, R3784 (2000).
- (7) G. B. Alers, A. P. Ramirez, and S. Jin, Appl. Phys. Lett. 68, 3644 (1996).
- (8) K. H. Ahn, T. Lookman, A. R. Bishop, Nature 428, 401 (2004).
- (9) X. D. Wu, B. Dolgin, G. Jung, V. Markovich, Y. Yuzhelevski, M. Belogolovskii, Ya. M. Mukovskii, Appl. Phys. Lett. 90, 242110 (2007).
- (10) P. Reutler, A. Bensaid, F. Herbstritt, C. Hofener, A. Marx, and R. Gross, Phys. Rev. B 62, 11619 (2000).
- (11) A. Palanisami, R. D. Merithew, M. B. Weissman, M. P. Warusawithana, F. M. Hess, and J. N. Eckstein, Phys. Rev. B 66, 092407 (2002).
- (12) D. S. Rana, M. Ziese, S. K. Malik, Phys. Rev. B 74, 094406 (2006).
- (13) J. B. Philipp, L. Alff, A. Marx, and R. Gross, Phys. Rev. B 66, 224417 (2002).
- (14) C. Barone, C. Adamo, A. Galdi, P. Orgiani, A. Yu. Petrov, O. Quaranta, L. Maritato, and S. Pagano, Phys. Rev. B 75, 174431 (2007).
- (15) A. Gokce, E. R. Nowak, S. H. Yang and S. S. P. Parkin, J. Appl. Phys. 99, 08A906 (2006).
- (16) D. A Shulyatev, A. A. Arsenov, S. G. Karabashev, Ya. M. Mukovskii, J. Crys. Growth, 198/199, 511 (1999).
- (17) Y. Yuzhelevski, V. Markovich, V. Dikovsky, G. Gorodetsky, G. Jung, D. A. Shulyatev, and Ya. M. Mukovskii, Phys. Rev. B 64, 224428 (2001).
- (18) G. P. Zhigalski, Phys. Usp., 46, 449 (2003).
- (19) E. Pytte and Y. Imry, Phys. Rev. B 35, 1465 (1987).
- (20) E. L. Wolf, Principles of Electron Tunneling Spectroscopy (Oxford University Press, Oxford, 1985).
- (21) E. G. Maksimov and O. V. Dolgov, Phys. Usp. 50, 933 (2007).
- (22) C. P. Adams, J. W. Lynn, V. N. Smolyaninova, A. Biswas, R. L. Greene, W. Ratcliff, S.-W. Cheong, Y. M. Mukovskii, D. A. Shulyatev, Phys. Rev. B 70, 134414 (2004).
- (23) J. R. Kirtley, D. J. Scalapino, Phys. Rev. Lett. 65, 799 (1990).
- (24) M. A. Belogolovskii, Yu. F. Revenko, A. Yu. Gerasimenko, V. M. Svistunov, E. Hatta, G. Plitnik, V. E. Shaternik, and E. M. Rudenko, Low Temp. Phys. 28, 391 (2002).
- (25) L. I. Glazman and K. A. Matveev, Sov. Phys. JETP 67, 1276 (1988).
- (26) Y. Xu, D. Ephron, and M. Beasley, Phys. Rev. B 52, 2843 (1995).
- (27) J. Klein, C. Hofener, S. Uhlenbruck, L. Al, B. Buchner, and R. Gross, Europhys. Lett. 47, 371 (1999).
- (28) K. B. Chashka, B. Fisher, J. Genossar, L. Patlagan, G. M. Reisner, and E. Shimshoni, Phys. Rev. B 63, 064403 (2001).
- (29) M. Belogolovskii, Cent. Eur. J. Phys. 7, 304 (2009).
- (30) S. Machlup, J. Appl. Phys. 25, 341 (1954).
- (31) V. Markovich, G. Jung, Y. Yuzhelevski, G. Gorodetsky, A. Szewczyk, M. Gutowska, D. A. Shulyatev and Ya. M. Mukovskii, Phys. Rev. B 70, 064414 (2004).
- (32) Ch. Jooss, J. Hoffmann, J. Fladerer, M. Ehrhardt, T. Beetz, L. Wu, and Y. Zhu, Phys. Rev. B 77, 132409 (2008).