Substellar Objects in Nearby Young Clusters (SONYC) III: Chamaeleon-I 111Based on observations collected at the European Organisation for Astronomical Research in the Southern Hemisphere, Chile (programs 078.C-0049 and 382.C-0174)
Abstract
SONYC – Substellar Objects in Nearby Young Clusters – is a survey program to investigate the frequency and properties of substellar objects with masses down to a few times that of Jupiter in nearby star-forming regions. In this third paper, we present our recent results in the Chamaeleon-I star forming region. We have carried out deep optical and near-infrared imaging in four bands () using VIMOS on the ESO Very Large Telescope and SOFI on the New Technology Telescope, and combined our data with mid-infrared data from the Spitzer Space Telescope. The survey covers 0.25 deg2 on the sky, and reaches completeness limits of 23.0 in the I-band, 18.3 in the J-band, and 16.7 in -band. Follow-up spectroscopy of the candidates selected from the optical photometry () was carried out using the multi-object spectrograph VIMOS on the VLT. We identify 13 objects consistent with M spectral types, 11 of which are previously known M-dwarfs with confirmed membership in the cluster. The 2 newly reported objects have effective temperatures above the substellar limit. We also present two new candidate members of Chamaeleon-I, selected from our photometry combined with the Spitzer data. Based on the results of our survey, we estimate that the number of missing very-low-mass members down to and is , i.e. of the total cluster population according to the current census.
Subject headings:
stars: circumstellar matter, formation, low-mass, brown dwarfs – planetary systems1. Introduction
Brown dwarfs () are an important class of object to test the mass dependence in the formation and early evolution of stars and planets. As of today, the origin of these substellar objects it not clear (Whitworth & Goodwin, 2005); they may be the result of turbulent fragmentation (Padoan & Nordlund, 2004) or ejections from multiple systems (Bate, 2009). In addition, brown dwarfs might have been ejected from protoplanetary disks (Stamatellos & Whitworth, 2009) where they have formed by disk fragmentation, and we might observe the overlap of star and planet forming processes. Further issues that can be addressed by investigating young brown dwarfs are, among others, the evolution of accretion disks (e.g., the impact of photoevaporation), the formation of multiple systems (Bate, 2009), the mass dependence of planet formation (Payne & Lodato, 2007), and the early regulation of angular momentum (Scholz & Eislöffel, 2004, 2005).
The prerequisite for tackling these issues is to obtain a reliable picture of the frequency and properties of young brown dwarfs. The currently available surveys are affected by two major biases: a) In most regions they do not extend below the deuterium-burning limit (), i.e. they do not cover the regime of free-floating objects with planetary masses. In several regions, however, it has been shown that the mass function extends to 0.01 (Zapatero Osorio et al., 2000; Lucas et al., 2005; Luhman et al., 2008) or even below, and a lower mass limit (the “bottom of the IMF”) has not been found yet, which indicates that our census of substellar objects is incomplete at the lowest masses; b) Some of the deepest surveys are biased by design, either because they are based on mid-infrared data from Spitzer and thus will only find objects surrounded by dusty disks (e.g., Luhman et al. 2008) or because they are carried out using narrow-band methane imaging, which probes only a specific range of spectral types (e.g., Haisch et al. 2010). While samples obtained with these methods are useful to constrain the mass function, they are of limited use for other purposes (for example, Spitzer samples cannot reliably probe disk lifetimes as a function of mass).
Our program SONYC (Substellar Objects in Nearby Young Clusters) aims to mitigate these selection effects and to help in establishing a more complete census of brown dwarfs. The project is based on three basic principles:
1) By making extensive use of 4- to 8-m-class telescopes, we aim to reach mass limits of and below, with the specific goal of probing the bottom of the IMF.
2) The primary means of identifying candidates is broadband imaging in the optical and near-infrared, thus aiming to detect the photosphere. This results in large samples of candidates, i.e. requires extensive follow-up spectroscopy. This dataset is complemented by publicly available Spitzer data.
3) By probing several star forming regions we want to probe for environmental differences in the frequency and properties of substellar objects.
So far, we have published results for two regions, NGC 1333 (Scholz et al., 2009) and Ophiuchus (Geers et al., 2010). In NGC 1333 we identify 19 substellar objects, 12 of them previously unknown. We tentatively find a cutoff in the mass function between 0.01 and 0.02. This may be the first sign that we have reached the bottom of the IMF. In Ophiuchus we spectroscopically confirm a previously unknown brown dwarf, and identify a number of new candidates based on Spitzer data. In this region, however, the current census is highly incomplete due to strong and variable extinction.
In this paper we present the SONYC results for the star forming region Chamaeleon I (hereafter Cha-I). Cha-I harbors a rich population of known YSOs (Luhman, 2007), most of them grouped in two clusters, each dominated by a bright A star. Cha-I is less compact than NGC1333 and has less extinction than -Oph. Previous surveys have identified a significant number of substellar objects (Comerón et al., 1999; Neuhäuser & Comerón, 1999; Oasa et al., 1999; Comerón et al., 2004; López Martí et al., 2004). Extensive photometric and spectroscopic studies of the region (Luhman et al., 2004; Luhman, 2007; Luhman & Muench, 2008; Luhman et al., 2008) result in 40 spectroscopically confirmed objects below the hydrogen-burning limit. Among these are a few objects with estimated masses at or below the deuterium-burning limit (Luhman et al., 2006, 2008). Throughout this paper we will use the current membership census, referred to as the “Luhman census”, by Luhman (2007, 215 objects, his table 6), complemented by the new members in Luhman & Muench (2008, 8 objects) and Luhman et al. (2008, 4 objects).
This paper is organized as follows. Observations and data reduction are described in Section 2. In Section 3 we describe selection of substellar candidates from photometry, and the spectroscopic follow-up of the candidate objects in Cha-I. The results are discussed in Section 4, and conclusions are presented in Section 5.
2. Observations and data reduction
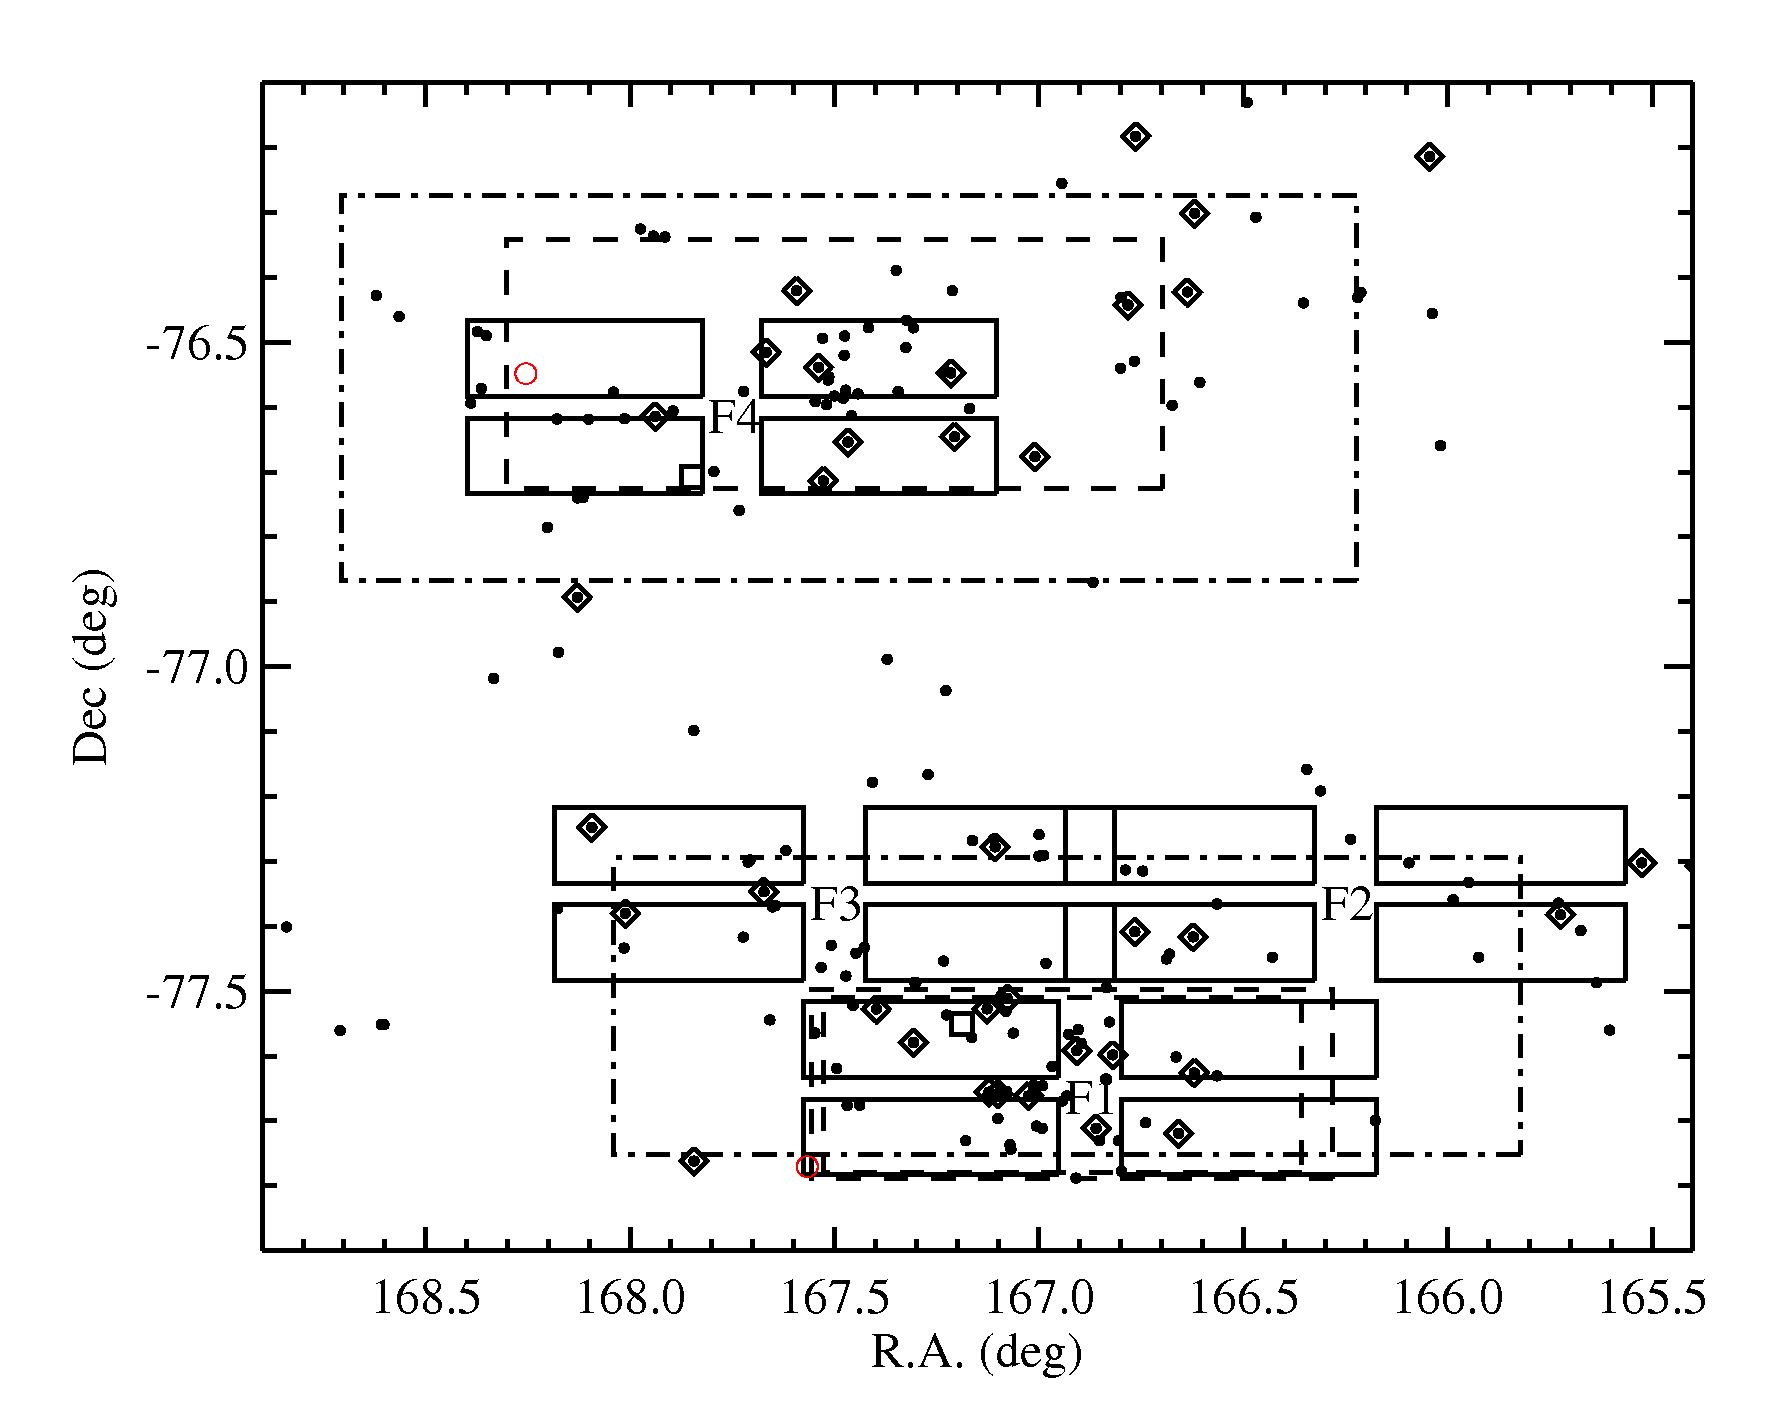
This study is primarily based on data from the European Southern Observatory, obtained in runs 078.C-0049 and 382.C-0174. The first campaign provided deep optical and near-infrared imaging. From the optical dataset we selected a list of candidate members which were observed using multi-object spectroscopy in the second run. Additionally, we made use of the archival Spitzer images for our target regions. In the following we describe the observations, the basic reduction and photometry. The fields covered by our surveys are outlined in Figure 1.
2.1. Optical imaging
We used VIMOS at the VLT to observe Cha-I in the optical wavelength regime. VIMOS is a wide-field imager with 4 CCDs arranged in a array. Each detector covers a field of view of with a pixel resolution of 02. The four quadrants are separated by gaps of approximately . Four pointings were observed, each in the - and -band filters. See Table 1 for more details about the VIMOS imaging run. With this observing strategy we do not cover the gaps between the chips, i.e. the survey is spatially incomplete. Most of the currently known young population of Cha-I is clustered around the two bright stars HD 97048 and HD 97300. These two areas (with the bright stars in the central gaps of the VIMOS array) are covered in our fields 1 and 4. The two remaining fields are located adjacent to each other and north of field 1. Taken together, the SONYC fields cover 38% of the known Cha-I population, including 17 known brown dwarfs.
| field | (J2000) | (J2000) | filter | UT date | airmass | seeingaameasured as a typical FWHM of unsaturated sources in our images | notes |
|---|---|---|---|---|---|---|---|
| Optical and near-infrared imaging | |||||||
| 1 | 11:07:30 | -77:39:00 | , | Jan 17, 2007 | 1.7 | 0.9′′ | s in , s in |
| 2 | 11:05:00 | -77:21:00 | , | Feb 10, 2007 | 1.7 | 0.7′′ | s in , s in |
| 3 | 11:10:00 | -77:21:00 | , | Feb 11, 2007 | 1.7 | 0.8′′ | (9 for Q3)s in , (10 for Q4) s in |
| 4 | 11:11:00 | -76:36:00 | , | Feb 05, 2007 | 1.6 | 0.5′′ | s in , s in |
| 1 | 11:07:30 | -77:39:00 | , | Nov 11, 2006 | 1.9 | 1.0′′ | s in , s in |
| 2 | 11:05:00 | -77:21:00 | , | Dec 05, 2006 | 2.0 | 1.2′′ | s in , s in |
| 3 | 11:10:00 | -77:21:00 | , | Dec 20, 2006 | 1.6 | 0.9′′ | s in , s in |
| 4 | 11:11:00 | -76:36:00 | , | Nov 16, 2006 | 1.9 | 1.1′′ | s in , s in |
| Spectroscopy | |||||||
| 1 | 11:07:30 | -77:39:00 | LR_red | Feb 16, 2009 | 1.7 | s | |
| 3 | 11:10:00 | -77:21:00 | LR_red | Mar 05, 2009 | 1.7 | s | |
| 4 | 11:11:00 | -76:36:00 | LR_red | Mar 06, 2009 | 1.7 | s | |
A standard image reduction was preformed for each individual science observation, using the VIMOS pipeline recipes. The individual images were then combined and the world coordinate system was calibrated against objects found in the 2MASS point source catalog with .
Sources were identified and extracted from each CCD chip using the Source Extractor (SExtractor) software package (Bertin & Arnouts, 1996). For object identification we required at least 5 pixel to be above the threshold detection limit. SExtractor automatic aperture fitting photometry routines were used to calculate the flux of each detected source. We further rejected objects with flux signal-to-noise of less than 5, overly elongated objects (), and objects which could not be found in both the and catalogs.
To calibrate the I-band photometry we compared our instrumental magnitudes with those in Table 1 of Luhman (2007), for objects with . No photometric calibration was available for -band, so in order to compare color magnitude diagrams for different CCD chips and fields, we calculated the median instrumental of all catalog objects in the range , . We then subtracted the difference between the median for each chip and the median for F2, CCD chip #1.
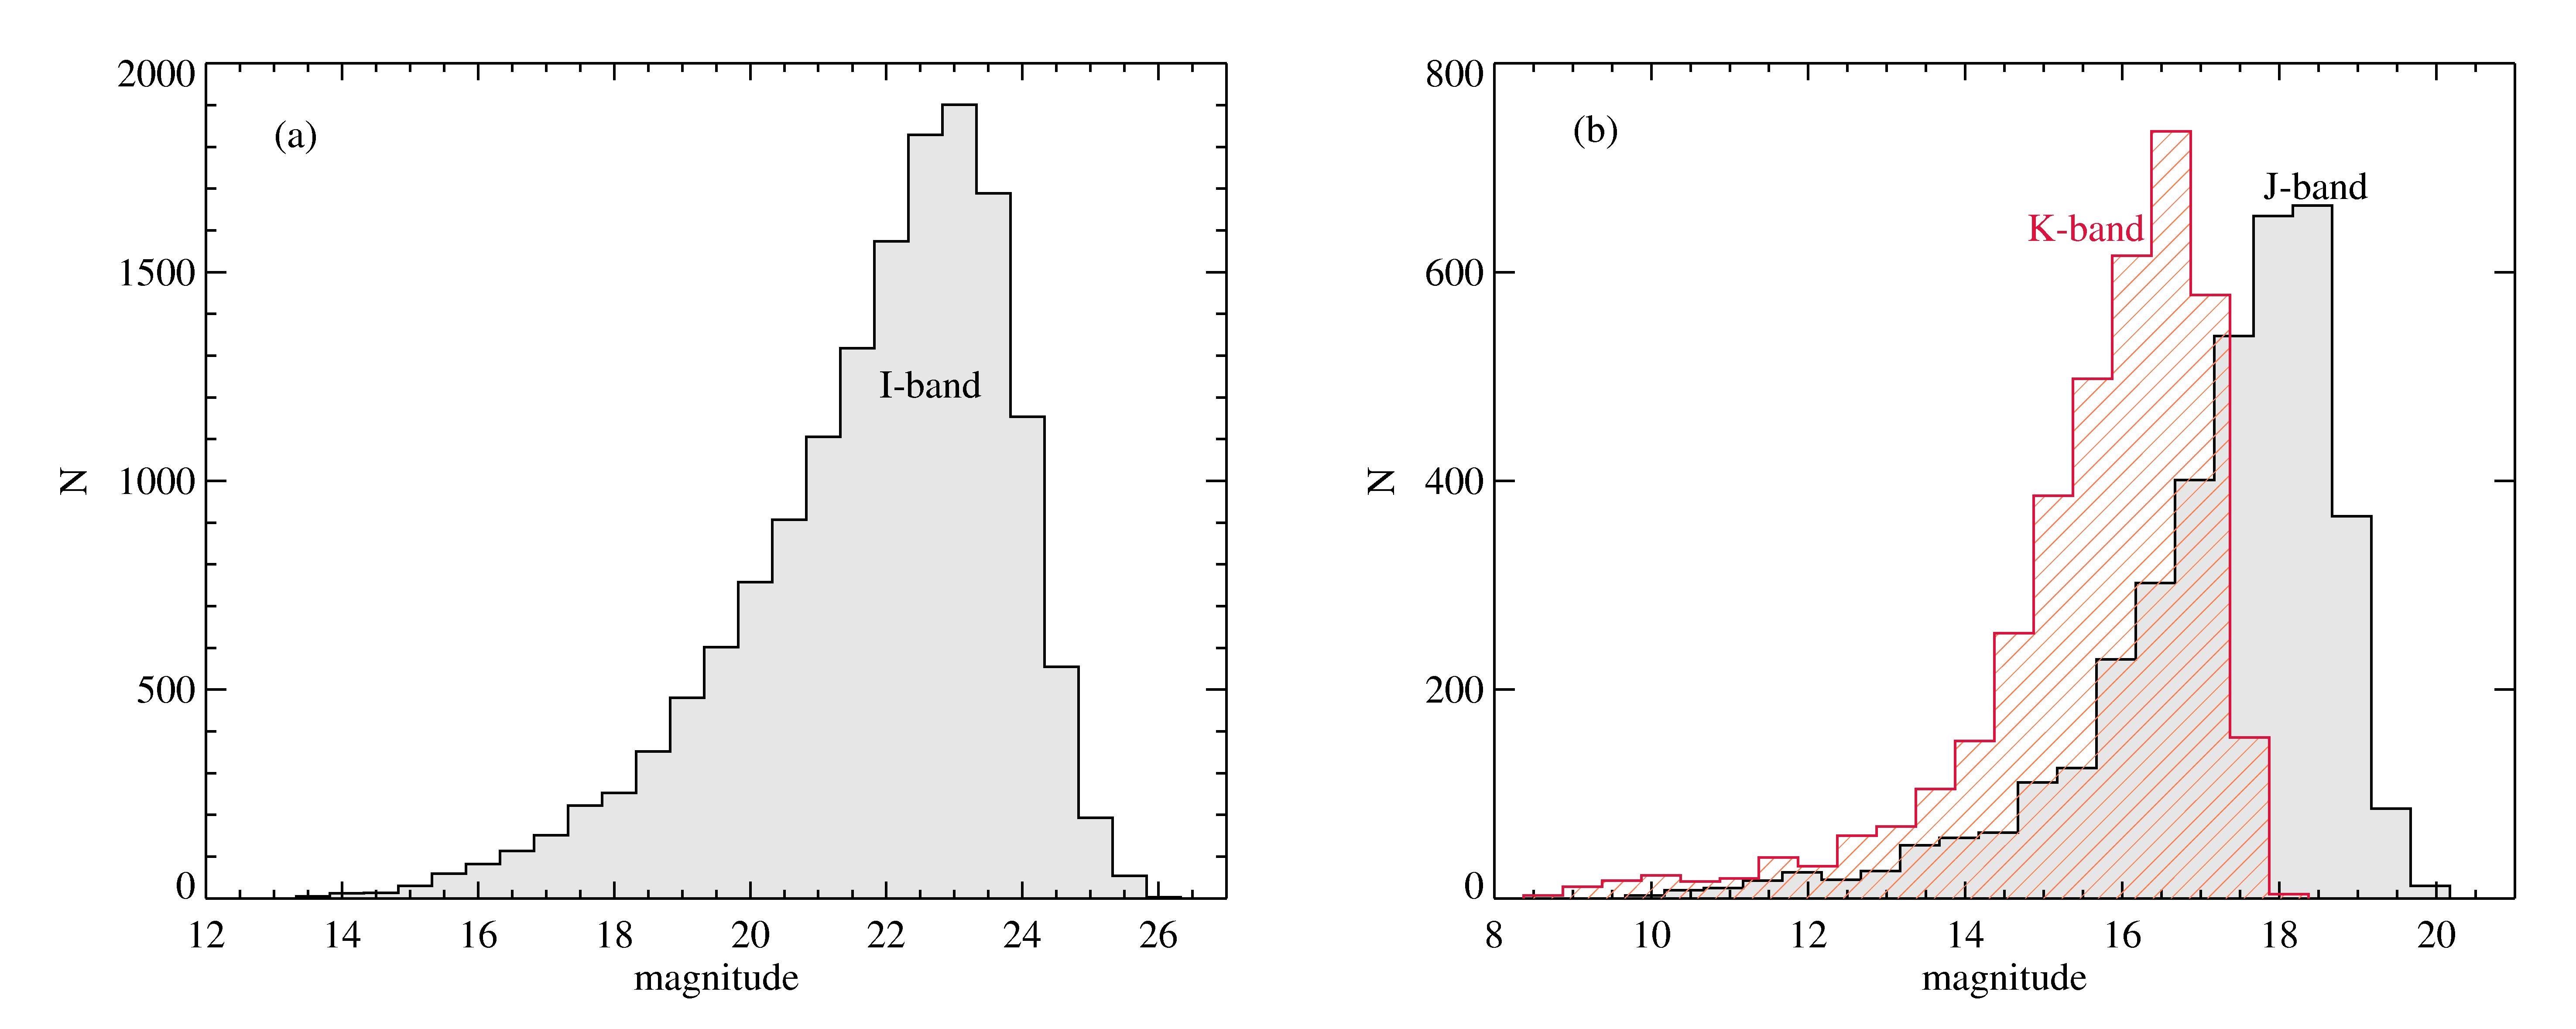
From the histogram of the magnitudes (see Figure 2), we derive the completeness limit of the optical survey at mag, and the limiting magnitude of about 25 mag.
2.2. Near-infrared imaging
The near-infrared observations were designed to provide - and -band photometry for the same area covered in the optical survey with VIMOS. We used SOFI at the NTT in its wide-field mode resulting in a field of view of and a pixel scale of 0288. The definitions of the SOFI filters are comparable to the 2MASS bands (Carpenter, 2001). See Table 1 for more details about the SOFI run.
Standard data reduction including sky subtraction, bad pixel, flat field, and the detector row cross-talk correction, was performed using IDL and DPUSER222http://www.mpe.mpg.de/~ott/dpuser (T. Ott). The 32 integrations per VIMOS quadrant were combined into a single mosaic using a simple shift-and-add algorithm. Shifts between the individual exposures were determined by cross-correlation, performed by the routine (part of the ESO package; Devillard 1997). The images were then shifted and median averaged.
For the source detection we used SExtractor, requiring at least 5 pixels with flux above the 3.5 detection limit. Saturated and extended sources were rejected from further consideration. For the photometric calibration, we identified all 2MASS sources matching the - and -band sources in our images with signal-to-noise better than 10. The number of useful calibrators per field ranges from 85 to 164. With these stars we determined the zeropoint ZP1 and ZP2 and a color coefficients C1 and C2 to transfer our magnitudes (, ) to the 2MASS system: and . With one exception, the color terms are 0.02 or smaller, and do not have significant effects on the calibration, which is in agreement with the findings in Carpenter (2001). The zeropoints are 1.15 to 1.23 mag in and -0.53 to -0.59 mag in . The spread can be explained with the variations in airmass between our fields. The typical error in the photometric calibration is 0.06 mag. From the histogram of the magnitudes (see Figure 2), we derive the completeness limits of the NIR part of the survey: mag, and mag. The limiting magnitudes are about and .
The WCS system for all images was determined with ccmap in IRAF, based on the 2MASS sources. Typically, we used 50-150 2MASS stars per VIMOS quadrant; the resulting accuracy in RA and DEC is .
2.3. Spitzer photometry
In addition to our optical and near-infrared images, we use IRAC data from the Spitzer Space Telescope to identify candidates. The regions of our optical/near-infrared survey are covered by five AORs: 3955968, 6526208, 12620032 from the program #36 (PI: Fazio), 3651328 from program #6 (PI: G. Fazio), and 3960320 from program #37 (PI: G. Fazio). The three first mentioned AORs are much deeper than the other two (100 s vs. 12 s integration time). Our analysis is based on the pipeline reduced PBCD images in the four IRAC channels at 3.6, 4.5, 5.8, and 8.0 µm from these five AORs. Using daofind within IRAF we searched for objects with peak fluxes exceeding 5 times the noise in the image. This yields significant contamination, particularly in the bright cloud cores of Cha-I. Therefore we required an object to be detected in all four IRAC images of the same AOR within pixel. Note that the PBCD images for these AORs are sampled to 0.6”/pix. For the resulting clean object catalogs we carried out aperture photometry using daophot. We chose relatively small apertures of 5 pix and a background annulus of 5-10 pix. We determined aperture corrections using a small sample of isolated bright stars, to shift our photometry to the standard aperture of 10 native pixels, as given in the IRAC handbook. The IRAC photometry catalogs were cross-correlated with the object catalog from our deep - and -band images. In this combined near/mid-infrared catalogs we will search for objects with the typical mid-infrared excess as expected for sources with disks.
2.4. Multi-object spectroscopy
The optical spectra have been obtained using VIMOS/VLT in the Multi-Object Spectroscopy (MOS) mode. The FOV in the MOS mode is the same as in the imaging mode. We have observed three out of four fields covered by the imaging run (F1, F3, and F4), using the low resolution red grism (LRred). We covered the wavelength regime between 5500 Å and 9500 Å, with the spectral resolution of R210, slit width of 1′′ and a spatial scale of 0205. The total on-source time for each field was 41610 s. Data reduction was performed using the VIMOS pipeline provided by ESO. Data reduction steps include bias subtraction, flat-field and bad-pixel correction, wavelength and flux calibration, as well as the final extraction of the spectra. As no jittering offsets have been applied between the individual exposures, fringe correction could not be performed. Our spectra therefore suffer strong fringing effects longwards of 8000 Å. In total, we have arranged 308 slits across the three observed fields (126 in F1, 81 in F3, and 101 in F4). After discarding empty slits and very noisy spectra, we are left with spectra of 229 objects ready for inspection.
3. Selection of substellar candidates in Cha-I
3.1. Optical color-magnitude diagram
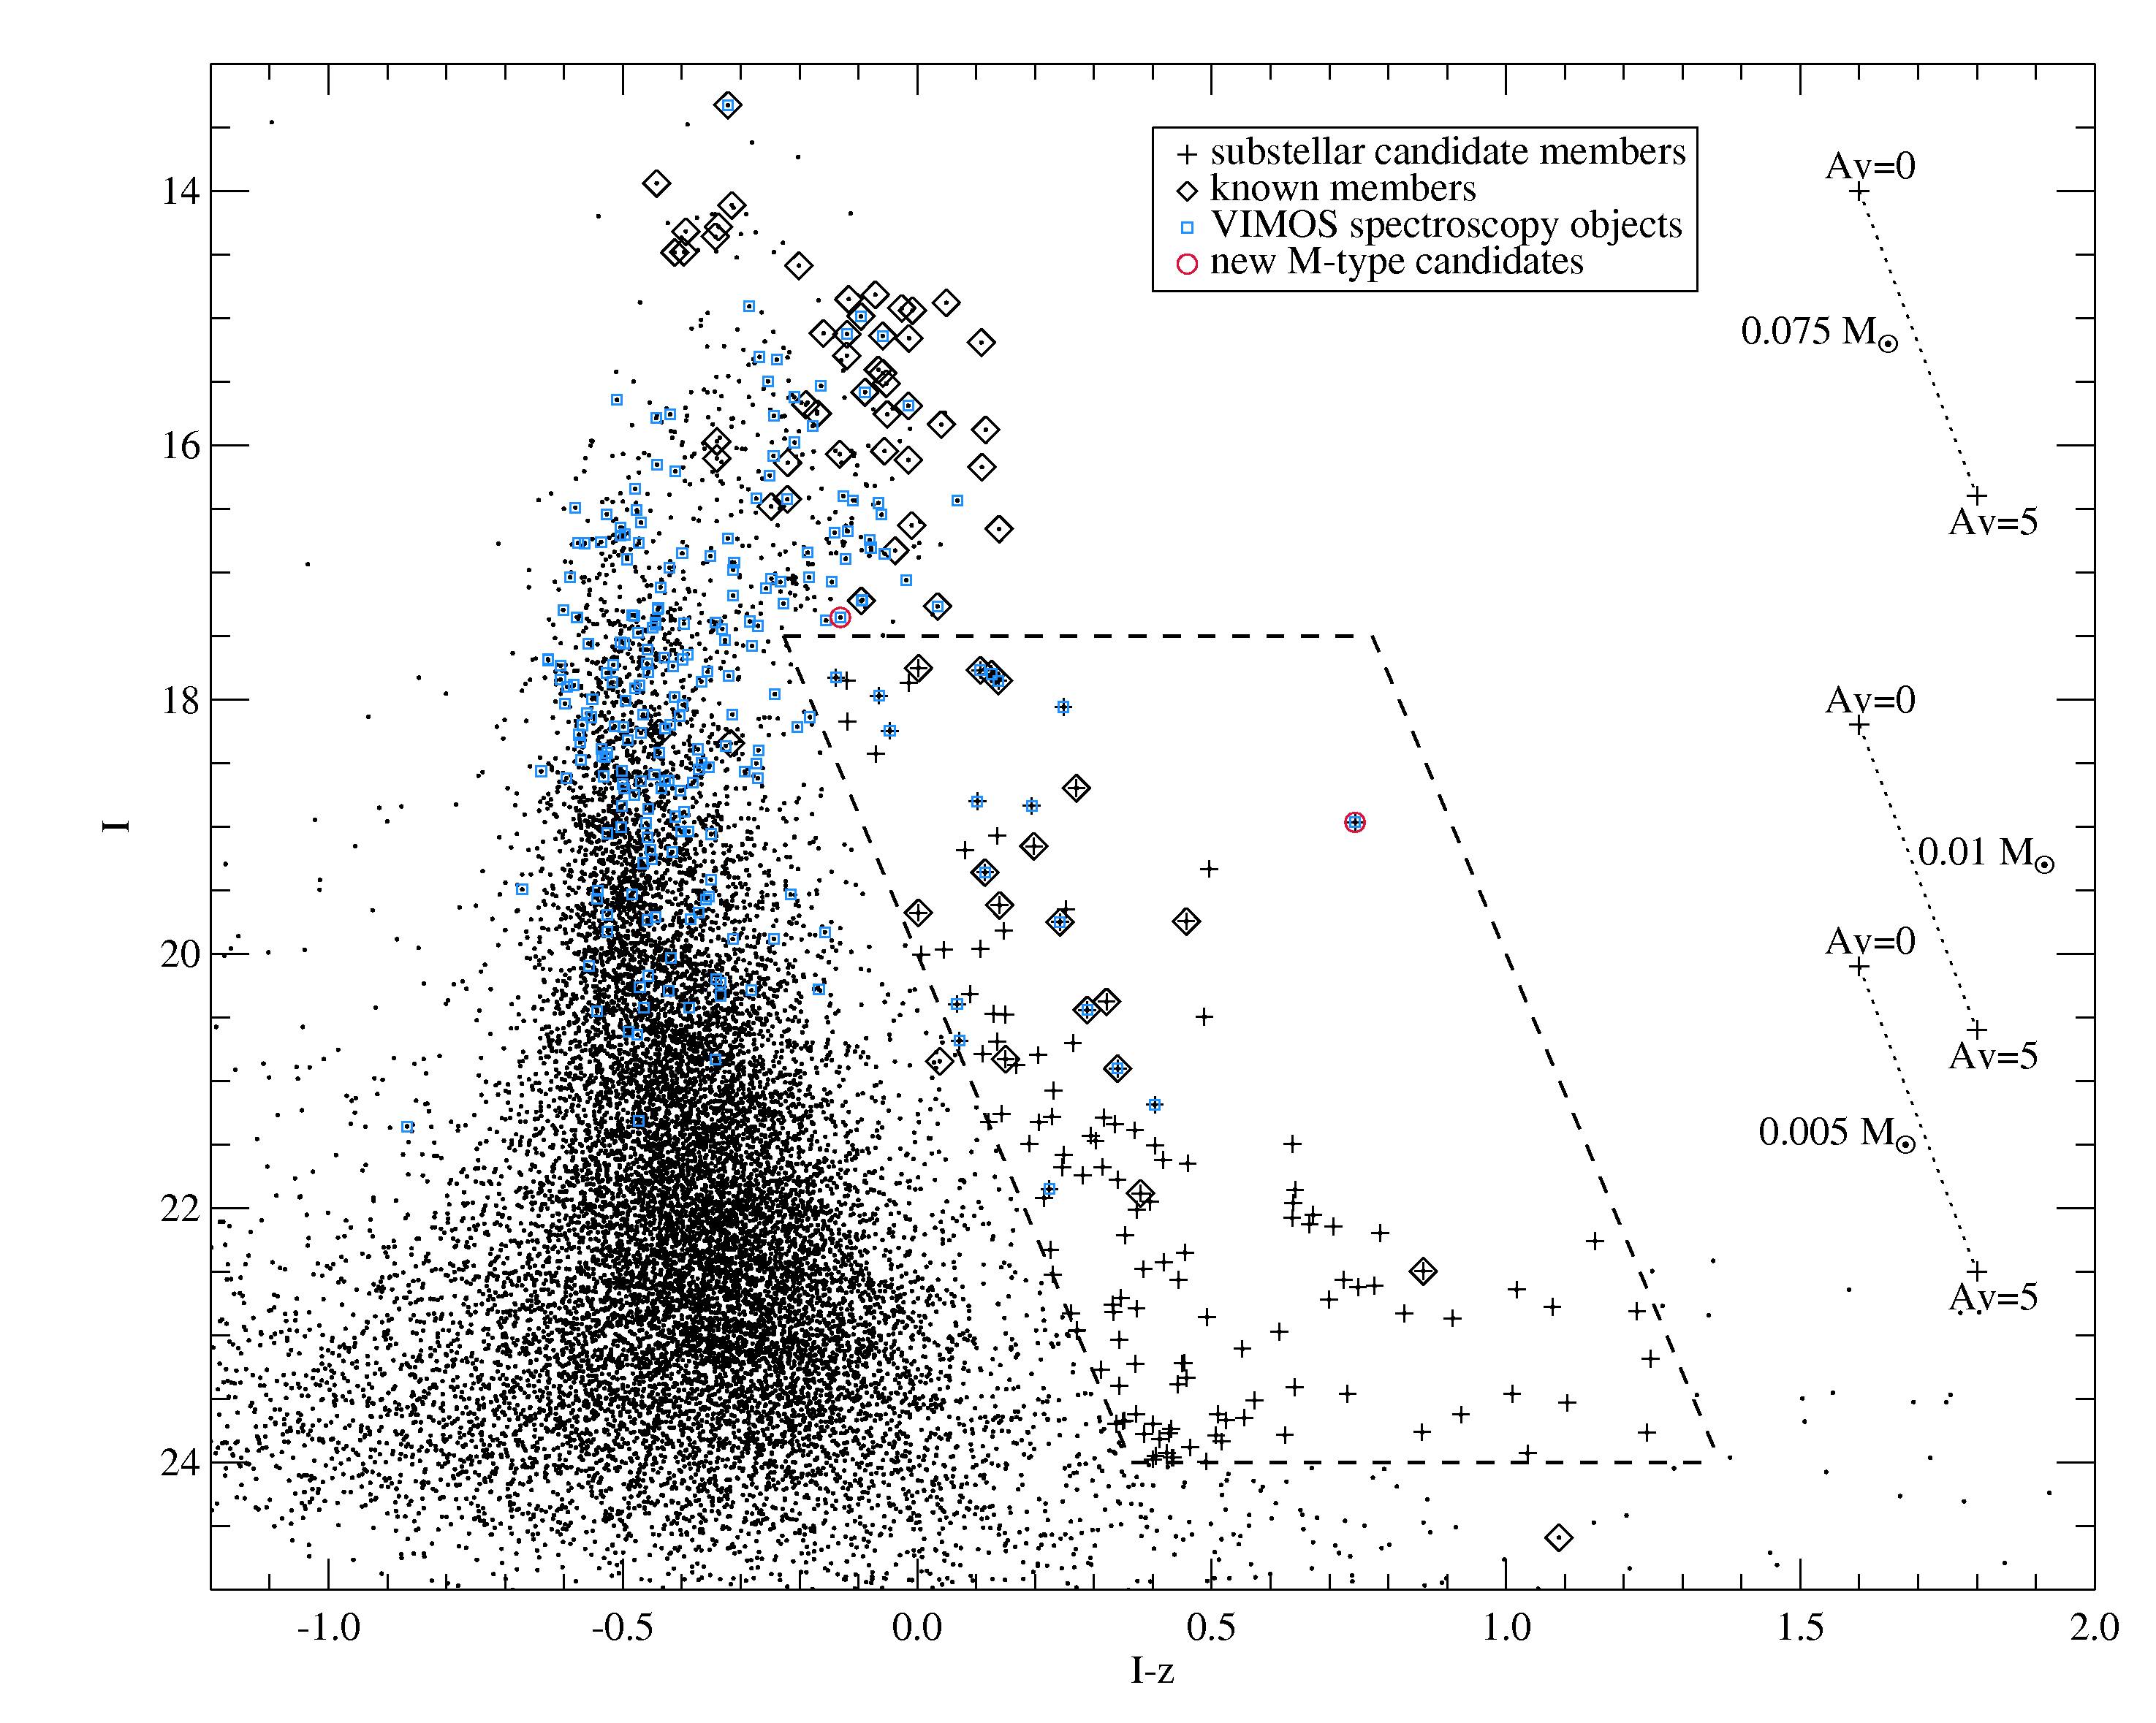
The (I, I-z) color-magnitude diagram of the sources observed in the four Cha-I fields is shown in Figure 3. Previously spectroscopically confirmed M-type members (Luhman census) are shown as diamonds. On the right-hand side of the diagram, we plot the expected -band brightness of Cha-I members with the mass 0.075, 0.015, and 0.005 , each at =0 and 5. For the calculation we use COND03 (Baraffe et al., 2003) and DUSTY00 (Chabrier et al., 2000) evolutionary models.
Very-low-mass (VLM) objects are expected to occupy a distinct region on the red side of the broad cumulation of the background main-sequence stars. We construct the selection box in the CMD such that it encompasses the majority of the known members of the spectral type M6 or later. 142 sources found within the selection box served as candidates for spectroscopic follow-up with VIMOS.
The faintest confirmed member in the color-magnitude diagram has . We identify this source as 2M J11070369-7724307. Luhman et al. (2008) published the spectrum, and estimated spectral type M and effective temperature of 2795 K. The source suffers the extinction of (estimate from Luhman et al. 2008 and our color, assuming the intrinsic ), which is higer than the average extinction in Cha-I (see Section 4.1). According to DUSTY00 and COND03 models, a 2550 K (M8.5) object at the distance of Cha-I and is expected to have , in agreement with our photometry.
3.2. Spectroscopic follow-up
Slits were allocated to 60 out of 142 objects selected from the optical CMD, using the VIMOS Mask Preparation Software (VMMPS). A number of slits were also placed on the already known M dwarfs in the region. To fully use the multiplexing capability of the spectrograph, remaining slits were placed on the randomly chosen objects within the FOV. As already mentioned above, some slits appear to be empty, or have poor signal-to-noise ratio. Blue squares in Figure 3 show 229 objects with the VIMOS spectra that can be used for spectral classification; 18 of those are found within the selection box. The approximate cutoff for spectroscopy is evident from the CMD, as the spectra of the vast majority of the objects fainter than exhibit S/N too low to allow conclusive classification.
Our goal is to identify young members of Cha-I with masses in the substellar regime, which typically corresponds to objects with effective temperature below 3000 K. The photometrically chosen sample might be contaminated by embedded stellar members of Cha-I, reddened background M-type stars, and (less likely) late M- and early L-type objects in the foreground. The red portion of M-dwarf spectra is dominated by molecular features (mainly TiO and VO; Kirkpatrick et al. 1991, 1995), which allows a relatively simple preliminary selection of candidates based on visual inspection. Here we included all the objects with a clear evidence, but also, for the sake of caution, those objects with only a tentative evidence of molecular features. Another property that was used in the selection is the slope, which should be positive in the red portion of the optical regime for M-type stars. Earlier stellar types typically have negative slopes, or appear flat (late K-type). Among the rejected spectra we mainly find flat spectra with no, or with very weak indication of molecular features (late K-dwarfs, or reddened earlier-type stars), and reddened featureless spectra (background or embedded stars of spectral type earlier than K).
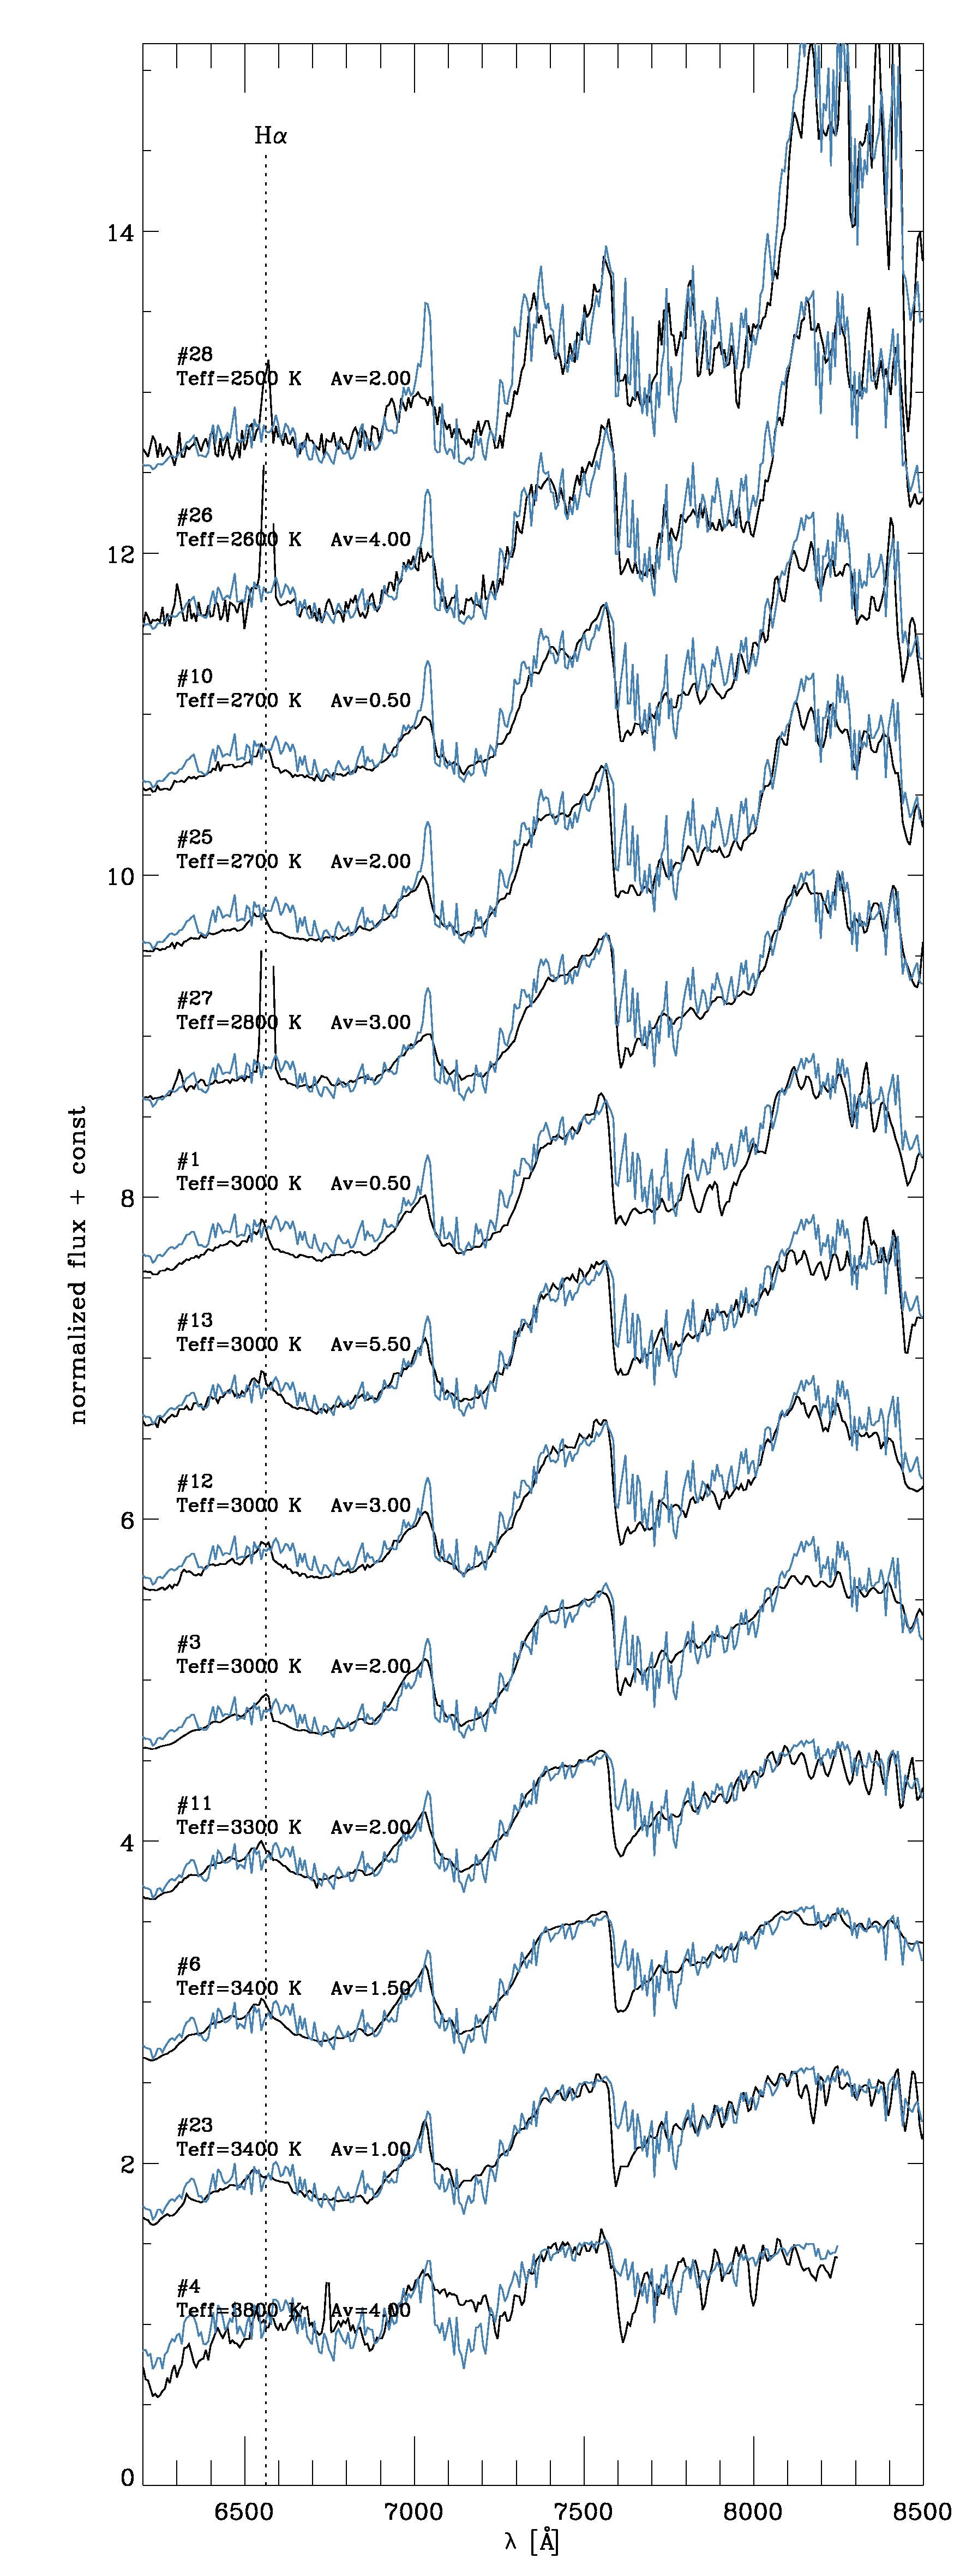
After this preliminary selection, our sample contains 28 spectra. To determine the effective temperature of our candidate objects we performed spectral fitting using the AMES-Dusty models (Allard et al., 2001). Model spectra are previously smoothed by a boxcar function to match the wavelength step of the VIMOS spectra. We compared the effect of log in range 3.5–6.0 for constant effective temperature and found that gravity does not significantly change the shape of the optical low-resolution spectra. We search for the lowest by varying the effective temperature , and the interstellar extinction , for the lowest available log (3.5 or 4.0). We vary between 2000 K and 3900 K, in steps of 100 K, and from 0 to 6, in steps of 0.5 mag. To de-redden our spectra, we apply the extinction law from Cardelli et al. (1989), assuming = 4. Due to the low resolution, it is the overall shape and the broad features in the spectrum that finally determine the best fit. To keep the fitting range as broad as possible, we set the wavelength limits at 6200 and 8500 Å. The cut at the red side is set to exclude the fringe-dominated portion of the spectra, while the cut at 6200 Å is set to avoid the problematic region around 6100 Å, where the models typically overestimate the observed flux. The results of our spectral fitting are given in Table 2, and shown in Figure 4. We show only the objects with the best-fit at or below 3800 K because the objects found at the edge of the fitting grid could be even warmer. The uncertainty is 100 K for the derived effective temperature, and 0.5 mag for the extinction, which reflects the spacing of the grid.
The models predict a much sharper peak at 7000 Å than apparent in our spectra, a discrepancy that becomes more pronounced for lower temperatures. According to Kirkpatrick et al. (1991), the TiO bandhead at 7050 Å is found in all late-K to late-M spectra, but is strongest in early- to mid-M objects. Reid et al. (1995) suggest that the depth of this feature provides a reliable spectral typing scheme for K7 – M6.5 dwarfs. At later types, however, the depth of the TiO feature decreases, which reflects both saturation in the TiO bandheads, and the presence of increasingly strong VO bandheads (Reid et al., 1995). This behaviour is observed in our spectra, but is not well reproduced by the models. In the same spectral region, object #4 shows flux levels above the model prediction and in this aspect stands out from the rest of the spectra in Figure 4. This might indicate that the object is hotter than our best-fit temperature at 3800 K.
We have to point out that the spectra shown in Figure 4 are not corrected for telluric absorption. However, the two above mentioned spectral regions where models do not fit the spectra well (6100 and 7050 Å) are free from atmospheric bands. The only region where the effects of telluric absorption are evident, is a deep O2 absorption at Å.
The majority of the sources (11/13) shown in Figure 4 are previously identified members of Cha-I according to the Luhman census. The effective temperatures obtained by our model fits are in agreement with those from the literature. The mean of the difference between the two sets of is 20 K, with a standard deviation of 150 K. The two newly discovered objects with M-dwarf spectral features have effective temperatures of 3400 and 3800 K, placing them among the early M-type objects. The extinction estimate for these two sources lies in the range which is consistent with the extinction towards Chamaeleon. However, without other clear signatures of youth, we cannot yet claim cluster membership. Further spectroscopy is needed to clarify their status.
| ID | (J2000) | (J2000) | (K) | AV (mag) | ReferenceaaReferences for the published spectra: L04: Luhman et al. (2004), L07: Luhman (2007) | name |
|---|---|---|---|---|---|---|
| 1 | 11 09 45.1833 | -77 40 33.4442 | 3000 | 0.5 | L07 | ESO H566 |
| 3 | 11 08 16.9700 | -77 44 11.6052 | 3000 | 2.0 | L04 | Cha H13 |
| 4 | 11 10 18.7603 | -77 46 13.8007 | 3800 | 4.0 | this work | |
| 6 | 11 10 11.5437 | -77 33 51.9489 | 3400 | 1.5 | L07 | |
| 10 | 11 12 02.7459 | -77 22 48.1824 | 2700 | 0.5 | L07 | |
| 11 | 11 10 50.7099 | -77 18 03.2794 | 3300 | 2.0 | L07 | ESO H568 |
| 12 | 11 07 59.9412 | -77 15 31.9702 | 3000 | 3.0 | L07 | ESO H561 |
| 13 | 11 08 55.9646 | -77 27 13.2001 | 3000 | 5.5 | L07 | ISO 167 |
| 23 | 11 13 01.2000 | -76 32 54.0509 | 3400 | 1.0 | this work | |
| 25 | 11 08 51.7863 | -76 32 50.4529 | 2700 | 2.0 | L04, L07 | |
| 26 | 11 08 49.5341 | -76 38 44.0479 | 2600 | 4.0 | L07 | |
| 27 | 11 09 52.1734 | -76 39 12.6947 | 2800 | 3.0 | L04 | ISO 217 |
| 28 | 11 10 06.5998 | -76 42 48.4937 | 2500 | 2.0 | L07 |
3.3. Candidates from near-infrared and Spitzer photometry
| ID | (J2000) | (J2000) | J (mag) | J-K (mag) | 3.6 µm | 4.5 µm | 5.8 µm | 8.0 µm | Notes |
|---|---|---|---|---|---|---|---|---|---|
| IR1 | 11 08 45.38 | -77 33 03.2 | 17.956 | 2.106 | 15.298 | 14.912 | 14.877 | 13.461 | extended? |
| IR2 | 11 11 23.87 | -76 42 29.1 | 18.195 | 2.142 | 14.847 | 14.319 | 13.945 | 12.916 | extended? |
The second candidate selection was carried out based on our near-infrared catalog, which was complemented by Spitzer/IRAC data, as outlined in Sect. 2.3. In total, our catalog has 3768 sources detected in - and -band. 64 of them are known members of Cha-I, according to the Luhman census.
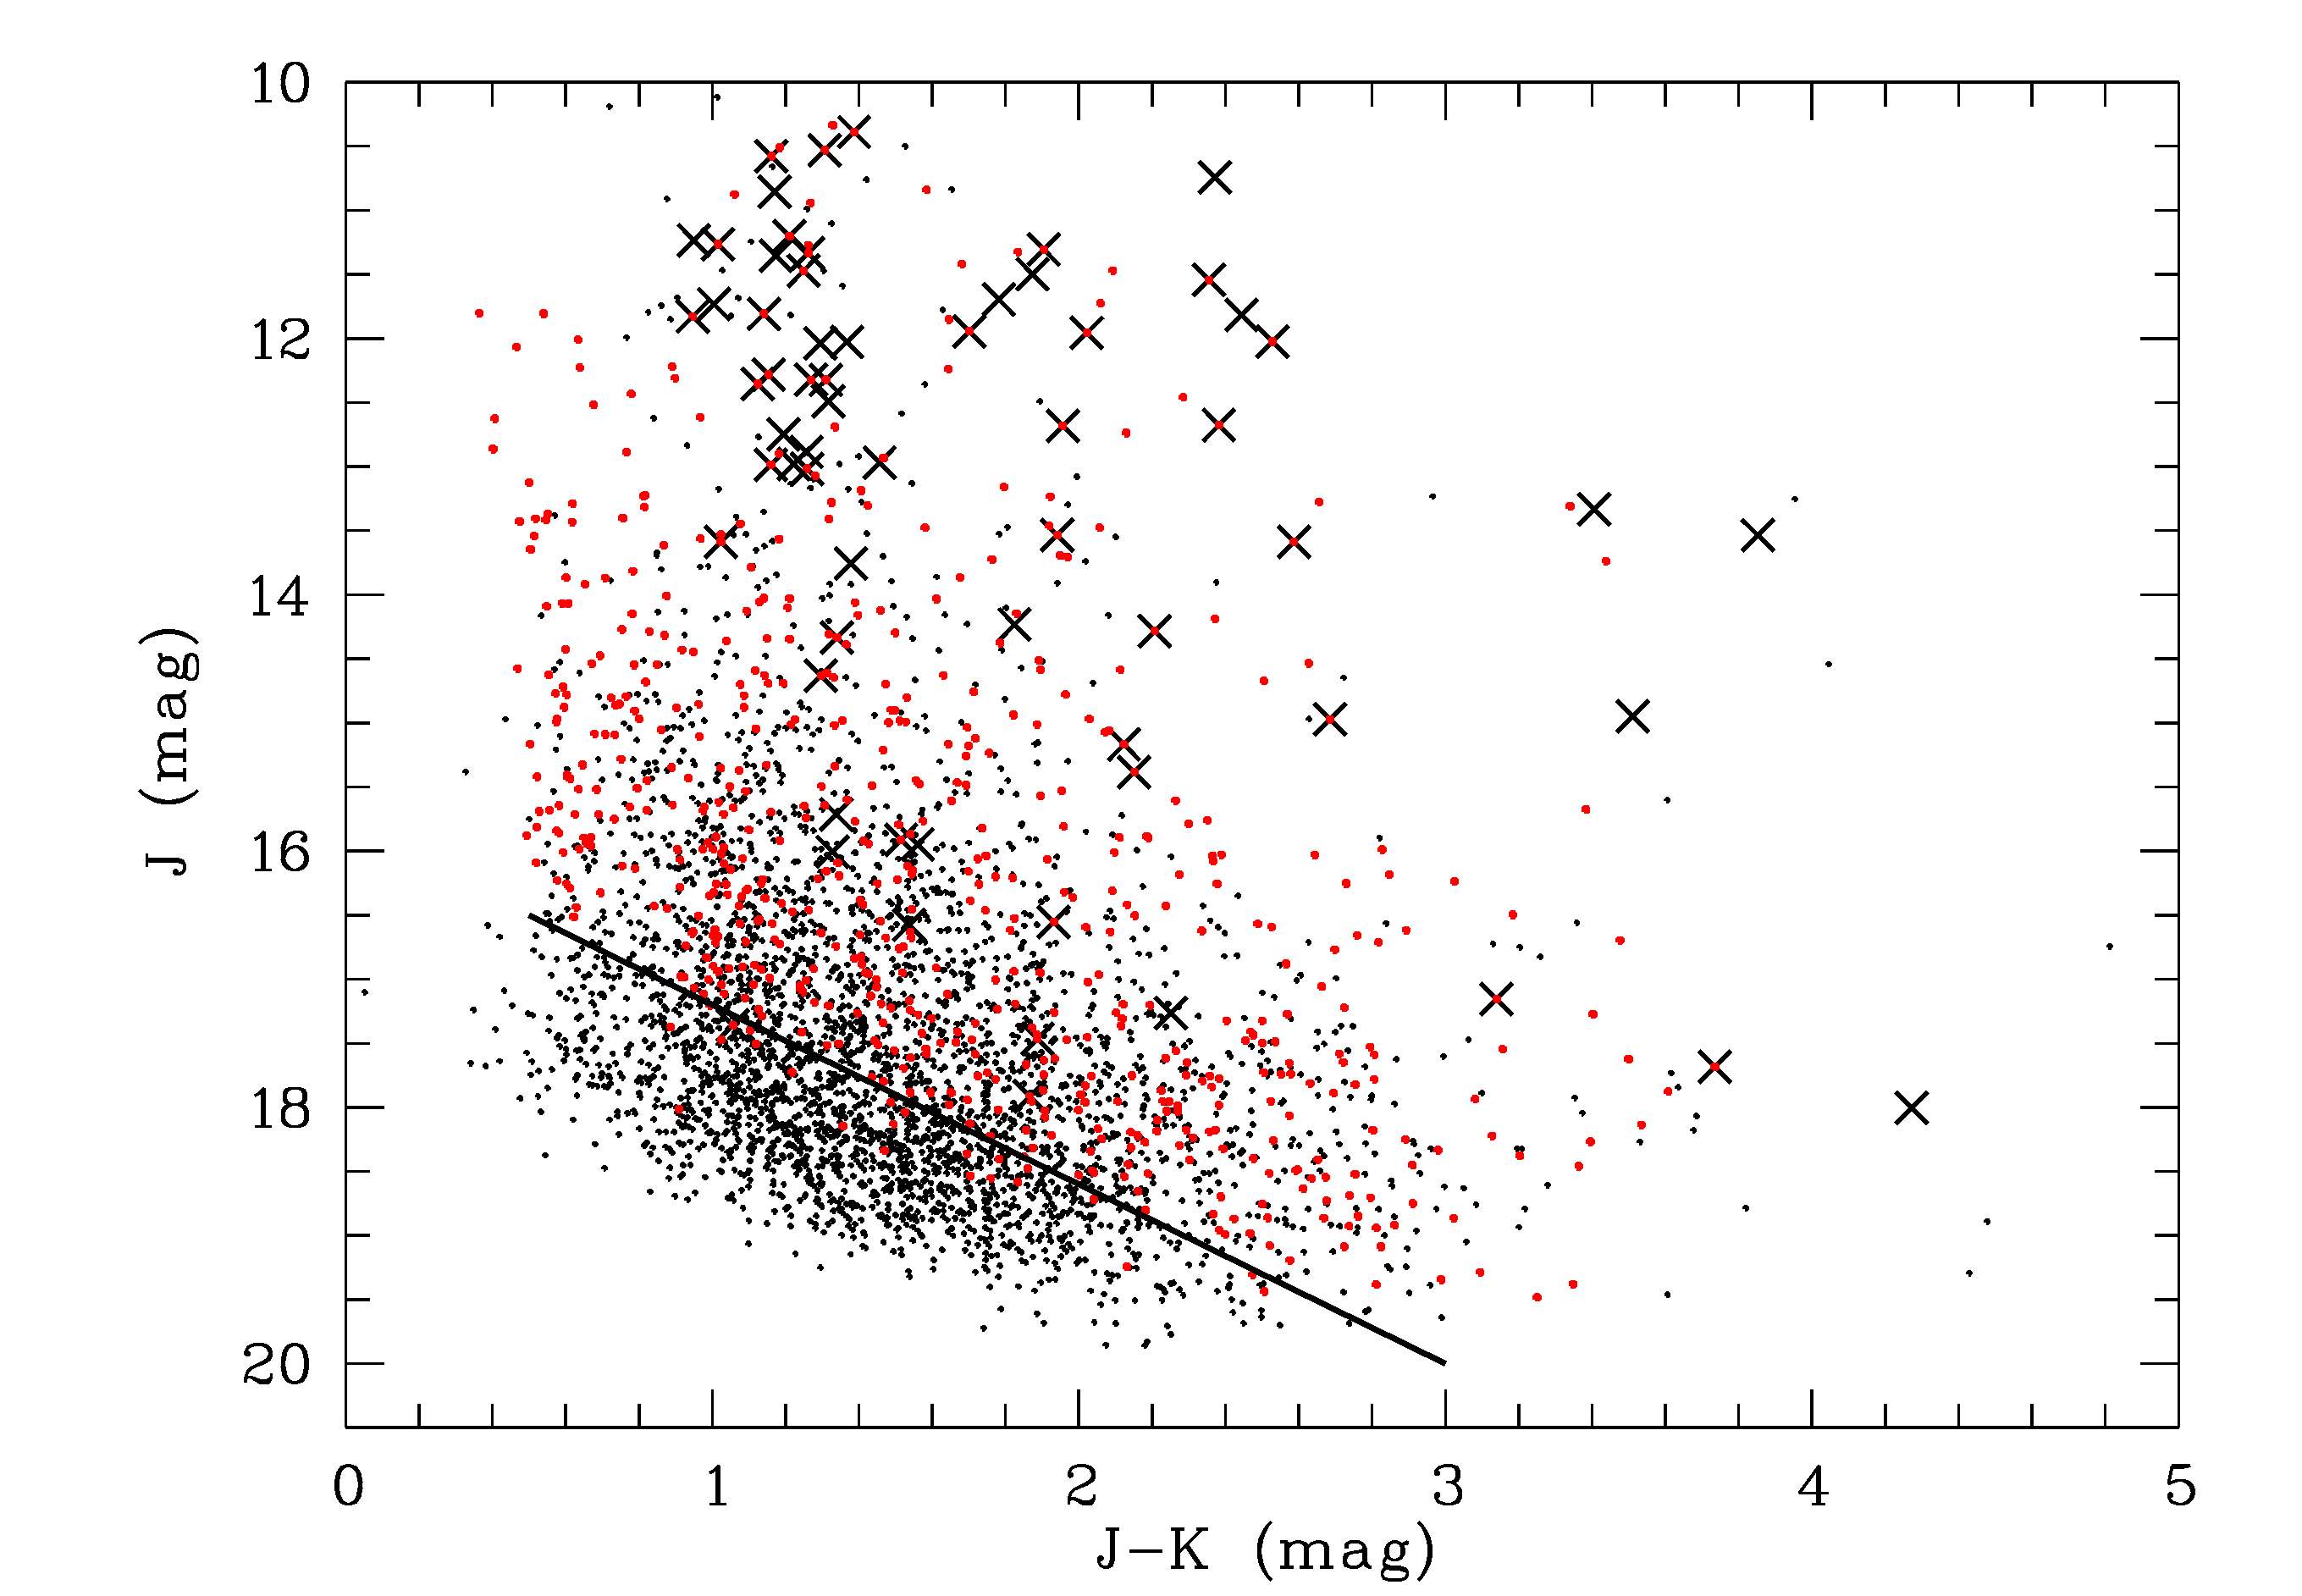
In this catalog are 643 objects with Spitzer/IRAC counterpart within 30, most of them (521) in the deep images from program #36. In Figure 5 we show the color-magnitude diagram generated from our catalog. Known Cha-I members are marked with crosses; objects with Spitzer counterpart are plotted in red. As can be seen in the diagram, the Spitzer survey misses many objects at the faint end of our catalog. The approximate magnitude limit of the combined catalog is shown with the solid line. The limit ranges from for mag. According to the COND03 and DUSTY00 isochrones, this limit corresponds to masses of .
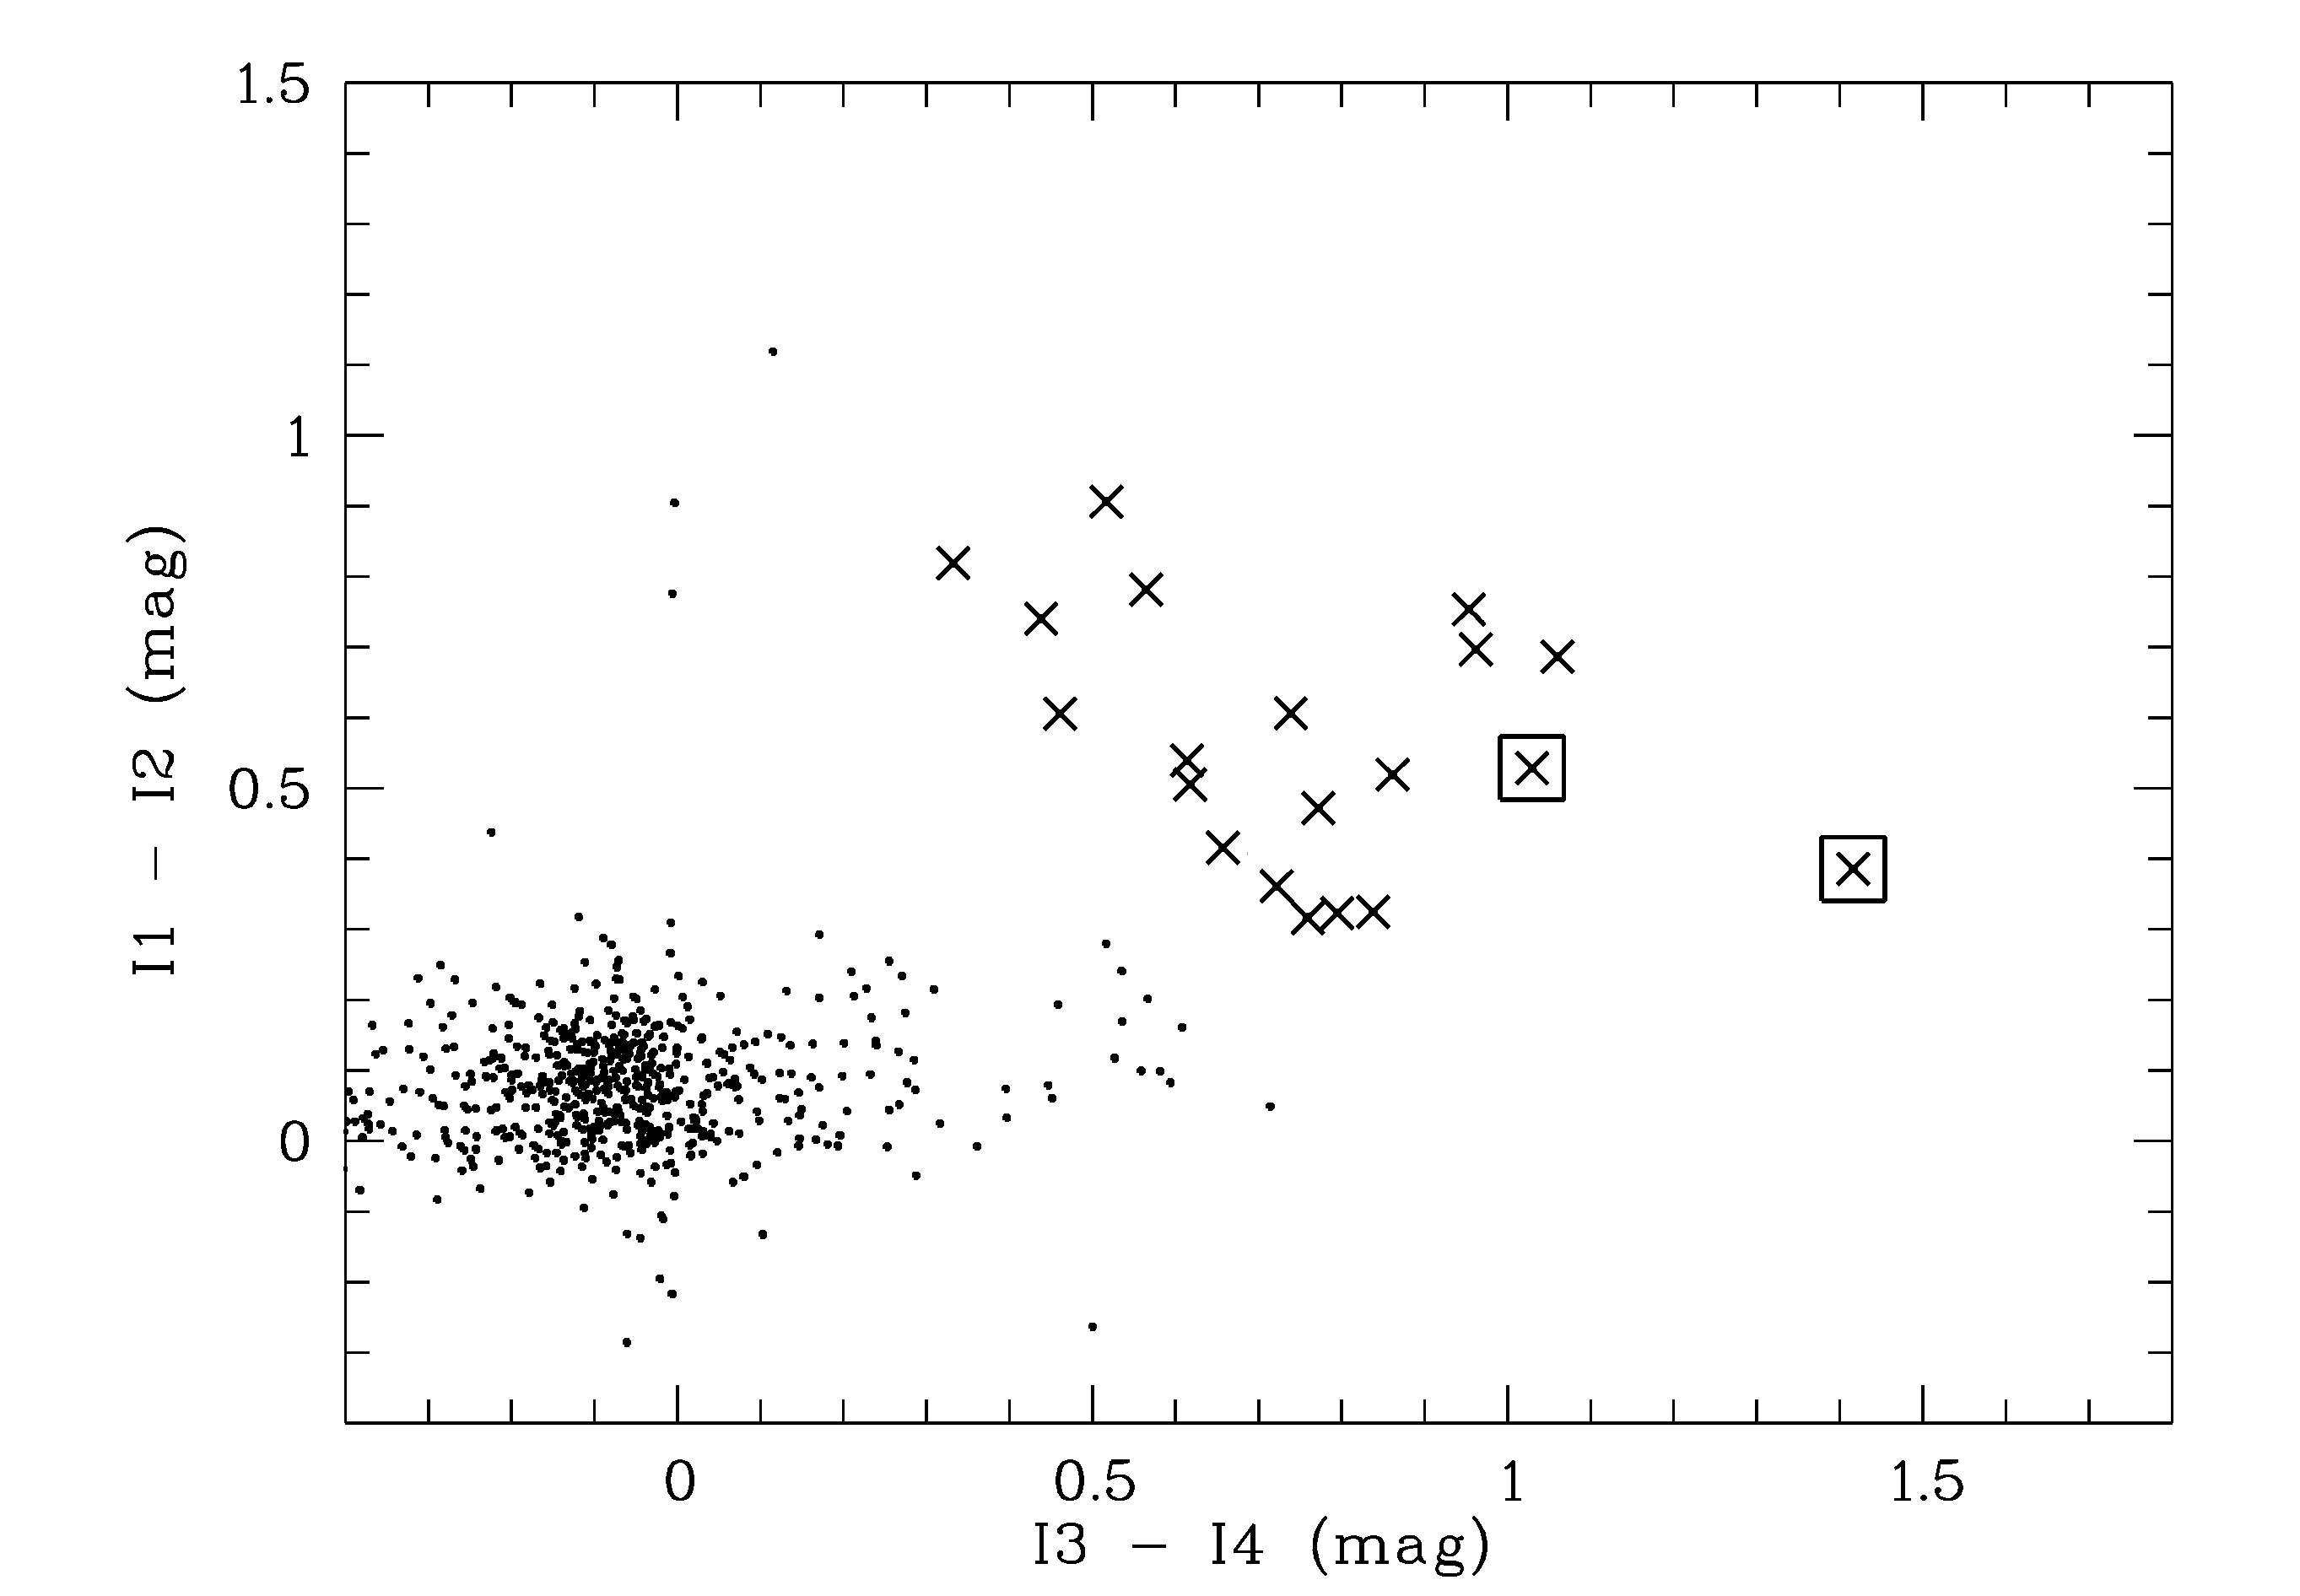
To select new candidate members in Cha-I, we make use of the standard IRAC color-color diagram, as shown in Figure 6. Plotted are the µm color vs. the color for all 643 objects with Spitzer counterpart. As shown extensively in the literature, this diagram serves as a robust diagnostic for the presence of circumstellar dust around a particular object (Allen et al., 2004; Hartmann et al., 2005). Objects with disks and/or envelopes show excess in the two IRAC colors. The overwhelming majority of our sources appears around the origin of the plot, which precludes the presence of a disk. A small group of 20 objects has significant excess in both axes and is clearly distinct from the bulk of the datapoints (marked with crosses). 18 of them are known members according to the Luhman census. The remaining 2 are listed in Table 3, and marked with squares in Fig. 6. To our knowledge, these objects are new candidate members of Cha-I, although they both look slightly extended in the near-infrared images and could be galaxies. For a definite statement about the membership of the new candidates, spectroscopy is needed.
4. Discussion
4.1. Number of missing substellar objects
Based on our optical and surveys we can put limits on the number of very low mass sources that are missing in the current census of YSOs in Cha-I. In Figure 1 we show the spatial coverage of our survey (solid lines), the positions of the known members (black dots), including the known brown dwarfs (diamonds), the two candidates from Table 3 (squares), and the two new candidate members from spectroscopy (circles). Our fields cover 88 out of 227 known members (38%), from which 67 are recovered in our Iz catalog. 64 members are recovered in the catalog, including 21 with disks. Since the object density across Cha-I is highly variable, we consider it best to scale the numbers with the fraction of known objects covered by the survey, and not with the fraction of total area. The scaling factor for obtaining the number of potential new candidates in the regions not covered by our survey is then .
Cambrésy (1999) derived extinction map of the Chamaeleon-Musca region based on optical star counts. Here we define the extent of Cha-I as the region on the plane of the sky outlined by a circle of radius and centered at (, ), and within the contours of . Only of this area is at . Therefore, when deriving mass equivalent to certain brightness limit, we consider only extinctions below .
Let us consider the sources in the candidate selection box of the optical part of the survey in Figure 3, that are brighter than the limit for spectroscopy, found at . The upper limit placed at corresponds to masses of (), and the lower limit to (), in both cases for . The estimates are based on DUSTY00 and COND03 evolutionary models. From the 45 sources in the box, 15 are known members according to the Luhman census. We obtained spectra for 9 of the remaining 30 objects, and find 1 potential new M-type member, falling above the substellar temperature limit. From this we conclude that there are potentially 2 additional missing members in the range, in the surveyed part of the cluster. The total number of the missing VLM members with in Cha-I is thus (unsurveyed + surveyed parts of the cluster).
In our survey, we find zero new objects with disks brighter than mag, and 2 potential new members with disks fainter than mag. According to the COND03 and DUSTY00 models, the limit corresponds to (0.005-0.008) for , similar to the limit. These numbers have to be scaled with the disk fraction (%, according to Luhman et al. 2008) and the coverage. The total number of potentially missing very low mass members in Cha-I is for and for mag. This estimate relies on three assumptions:
a) The disk fraction does not change as a function of mass. In Cha-I, Luhman et al. (2008) find that the disk fraction is roughly constant at 50% from 0.01 to 0.3. This is not necessarily the case in other star forming regions, as shown, for example, by Lada et al. (2006) and Scholz et al. (2007). Below the deuterium-burning limits, the fraction of the disk-bearing objects is even more uncertain.
b) The spatial distribution does not change as a function of mass. It is conceivable that brown dwarfs are scattered towards the outskirts of Cha-I whereas the higher mass stars are more concentrated towards the cloud core. From the current census, however, there is no evidence for brown dwarfs being distributed different than stars (Luhman, 2007).
c) The Spitzer survey fully covers our area. In Figure 1 we overplot the area on the deep and shallow IRAC images with dashed and dash-dotted lines, respectively. Our fields 1 and 4 with the highest density of known members (55/88) are completely covered by the deep IRAC images. The shallow IRAC images cover about 5/8 of the remaining fields. However, in these regions the density of known members is significantly lower and they are offset from the two main cloud cores in Cha-I. Therefore we do not consider the missing coverage a serious limitation.
In summary, from both the optical and the survey we conclude that the current census of members in Cha-I is mostly complete down to for . Within these limits and barring a significant mass dependence in disk fraction or spatial distribution, the number of missing object is . There may still be a significant number of unidentified members below this threshold or at higher extinctions.
4.2. Ratio of stellar to substellar members
Based on the current census in Cha-I, we can estimate the ratio of low-mass stars () to substellar objects. As substellar objects, we assume all objects with K, i.e. of the spectral type M6 or later. There are 183 low-mass stars in the Luhman census. Here we do not include the two new low-mass-star candidates found in this work, since their membership yet has to be confirmed. The number of substellar objects in the current census is 40. 10 out of these 40 objects are of spectral type M9 or later (K). 1 Myr old objects at these low temperatures would have masses , according to the DUSTY00 and COND03 models. Ratio of low-mass-stars to BDs in Cha-I is therefore , in agreement with the 3.3–8.5 limits found in other star forming regions (Andersen et al. 2008; calculated for the mass range at and above ). This number represents the upper limit on the star-to-BD ratio, since we are probably still missing some objects.
The ratio between the number of PMOs to BDs is currently . This number, however, is subject to a large uncertainty, due to missing BDs and also a much larger number of missing PMOs. From our statistics, we can give a crude estimate of the number of missing PMOs in Cha-I. The BD/PMO limit at corresponds to for . For the objects with in the selection box in Figure 3, and following the same reasoning as in Section 4.1, we estimate that the number of missing objects is . This means that the total number of missing BDs is . All remaining missing objects should be PMOs. Down to () this gives 4–7 PMOs. From our survey in Section 4.1 we estimated the number of missing objects below this limit to be . In total, this estimate gives 4–13 missing PMOs in Cha-I. The PMO-to-BD ratio in Cha-I then lies in the range between and while the ratio of PMOs to the total cluster population becomes . We note that the ratios derived here should be taken with caution because they are subject to large uncertainties due to scaling from small numbers.
We can compare the derived numbers with those found in other star forming regions. In Ori, Caballero et al. (2007) find the lower limit for the PMO versus BD ratio of . In the ONC, Lucas et al. (2006) estimate the fraction of PMOs in the total cluster population to be in range (1–14). Highly variable extinction and age uncertainty make an unbiased census in the ONC difficult. While these numbers are in line with our Cha-I estimates, significantly different behavior is observed in NGC 1333. Scholz et al. (2009) report an overabundance of BDs relative to low-mass stars (ratio of ), and a deficit of PMOs. They find no PMOs in NGC 1333, although clearly being able to do so, as judged from the completeness limit of the survey. While the reason for this observed difference is not obviouos, it might indicate that the environment may leave an imprint on the shape of the IMF at the lowest masses. The major contributions to the uncertainties in the PMO/BD ratio are introduced by the completeness limits (most of the surveys are incomplete in the PMO regime), and the mass estimates that are based on the models, together with the age and distance uncertainties. High and variable extinction that is typical for most star forming regions additionally complicates this situation, as color-magnitude criteria used for candidate selection may also include more massive members at higher extinctions. Here we must stress the importance of obtaining follow-up spectroscopy of the photometrically-selected candidates, because only the spectra can give us the information about the youth (and thus membership) and temperature of the observed objects.
As pointed out by Luhman (2007), and also apparent from Figure 1, the spatial distribution of brown dwarfs does not significantly differ from the distribution of stars in Cha-I. This indicates that the ejection from multiple systems cannot be the dominant process of brown dwarf formation in this cluster. Any other statement concerning the relative importance of BD formation scenarios is not possible based only on ratios of BDs to stars or PMOs to BDs. To some extent, any of the proposed models can successfully reproduce the observed IMF. For example, in simulations of the turbulent cloud fragmentation by Padoan & Nordlund (2004), abundances of brown dwarfs in different star forming regions can be matched by an appropriate combination of cloud density, temperature and the Mach number of the turbulence. To constrain the relative contributions of different formation mechanisms to the observed substellar population in different star forming regions, we need secondary indicators that provide a more effective ways to distinguish between different scenarios (see e.g. Bonnell et al. 2007). These secondary indicators include spatial distribution of stars and BDs in star forming regions, possible kinematic differences between the two populations, and binary properties (frequency, separations, mass ratios) and how they depend on the primary mass (Ahmic et al., 2007; Lafrenière et al., 2008).
5. Summary and conclusions
This paper is the third in the series of papers presented in the framework of the SONYC project (short for Substellar Objects in Nearby Young Clusters). We have obtained deep optical and near-infrared observations of 4 fields in the Chamaeleon-I star forming region, using VIMOS at the ESO VLT and SOFI at the ESO NTT. Follow-up spectroscopy of the candidates selected from the photometry was obtained using VIMOS/VLT. In the following, we summarize the survey and its most important results.
-
1.
In our imaging survey, we reach completeness limits of 23.0 in , 18.3 in , and 16.7 in . This corresponds to mass limits of , for and the distance of 160 pc (based on DUSTY00 and COND03 models). This is more than 2 magnitudes deeper in all three bands than the completeness limits of the major part of the currently most extensive Cha-I survey presented in Luhman (2007). Only one field in Luhman (2007), covering (equivalent to a quarter of our coverage), did achieve photometric depths comparable to those presented here.
-
2.
The spatial coverage of our survey is 0.25 deg2. It includes 38% of the previously known members of Cha-I from the Luhman census.
-
3.
From the optical photometry, we select 142 objects with colors as expected for substellar members of the cluster. 45 of these objects are above the limit observed in our spectroscopic follow-up, and for 18 of these sources we have obtained optical spectra. We have also obtained spectra for 211 randomly selected objects outside the selection box, including several known members. We find two objects with spectra consistent with the spectral type M, but do not have enough information to clarify membership. None of the two new potential members is substellar, as the temperature estimate resulting from the spectral fitting are well above 3000 K.
-
4.
Our JK photometric survey combined with the Spitzer data yields 2 new candidate members. The membership for these objects has to yet be confirmed by spectroscopy.
-
5.
Based on the results of our survey, while scaling for the coverage and disk fraction, we estimate that the number of the missing low-mass members down to and in Cha-I is , i.e. of the total number of members according to the current census. We might, however, still miss objects with lower masses, and objects at higher extinctions.
References
- Ahmic et al. (2007) Ahmic, M., Jayawardhana, R., Brandeker, A., Scholz, A., van Kerkwijk, M. H., Delgado-Donate, E., & Froebrich, D. 2007, ApJ, 671, 2074
- Allard et al. (2001) Allard, F., Hauschildt, P. H., Alexander, D. R., Tamanai, A., & Schweitzer, A. 2001, ApJ, 556, 357
- Allen et al. (2004) Allen, L. E., Calvet, N., D’Alessio, P., Merin, B., Hartmann, L., Megeath, S. T., Gutermuth, R. A., Muzerolle, J., Pipher, J. L., Myers, P. C., & Fazio, G. G. 2004, ApJS, 154, 363
- Andersen et al. (2008) Andersen, M., Meyer, M. R., Greissl, J., & Aversa, A. 2008, ApJ, 683, L183
- Baraffe et al. (2003) Baraffe, I., Chabrier, G., Barman, T. S., Allard, F., & Hauschildt, P. H. 2003, A&A, 402, 701
- Bate (2009) Bate, M. R. 2009, MNRAS, 392, 590
- Bertin & Arnouts (1996) Bertin, E. & Arnouts, S. 1996, A&AS, 117, 393
- Bonnell et al. (2007) Bonnell, I. A., Larson, R. B., & Zinnecker, H. 2007, Protostars and Planets V, 149
- Caballero et al. (2007) Caballero, J. A., Béjar, V. J. S., Rebolo, R., Eislöffel, J., Zapatero Osorio, M. R., Mundt, R., Barrado Y Navascués, D., Bihain, G., Bailer-Jones, C. A. L., Forveille, T., & Martín, E. L. 2007, A&A, 470, 903
- Cambrésy (1999) Cambrésy, L. 1999, A&A, 345, 965
- Cardelli et al. (1989) Cardelli, J. A., Clayton, G. C., & Mathis, J. S. 1989, ApJ, 345, 245
- Carpenter (2001) Carpenter, J. M. 2001, AJ, 121, 2851
- Chabrier et al. (2000) Chabrier, G., Baraffe, I., Allard, F., & Hauschildt, P. 2000, ApJ, 542, 464
- Comerón et al. (2004) Comerón, F., Reipurth, B., Henry, A., & Fernández, M. 2004, A&A, 417, 583
- Comerón et al. (1999) Comerón, F., Rieke, G. H., & Neuhäuser, R. 1999, A&A, 343, 477
- Devillard (1997) Devillard, N. 1997, The Messenger, 87, 19
- Geers et al. (2010) Geers, V. C., Scholz, A., Jayawardhana, R., Lee, E., Lafréniere, D., & Tamura, M. 2010, submitted to ApJ
- Haisch et al. (2010) Haisch, K. E., Barsony, M., & Tinney, C. 2010, ApJ, 719, L90
- Hartmann et al. (2005) Hartmann, L., Megeath, S. T., Allen, L., Luhman, K., Calvet, N., D’Alessio, P., Franco-Hernandez, R., & Fazio, G. 2005, ApJ, 629, 881
- Kirkpatrick et al. (1991) Kirkpatrick, J. D., Henry, T. J., & McCarthy, Jr., D. W. 1991, ApJS, 77, 417
- Kirkpatrick et al. (1995) Kirkpatrick, J. D., Henry, T. J., & Simons, D. A. 1995, AJ, 109, 797
- Lada et al. (2006) Lada, C. J., Muench, A. A., Luhman, K. L., Allen, L., Hartmann, L., Megeath, T., Myers, P., Fazio, G., Wood, K., Muzerolle, J., Rieke, G., Siegler, N., & Young, E. 2006, AJ, 131, 1574
- Lafrenière et al. (2008) Lafrenière, D., Jayawardhana, R., Brandeker, A., Ahmic, M., & van Kerkwijk, M. H. 2008, ApJ, 683, 844
- López Martí et al. (2004) López Martí, B., Eislöffel, J., Scholz, A., & Mundt, R. 2004, A&A, 416, 555
- Lucas et al. (2005) Lucas, P. W., Roche, P. F., & Tamura, M. 2005, MNRAS, 361, 211
- Lucas et al. (2006) Lucas, P. W., Weights, D. J., Roche, P. F., & Riddick, F. C. 2006, MNRAS, 373, L60
- Luhman (2007) Luhman, K. L. 2007, ApJS, 173, 104
- Luhman et al. (2008) Luhman, K. L., Allen, L. E., Allen, P. R., Gutermuth, R. A., Hartmann, L., Mamajek, E. E., Megeath, S. T., Myers, P. C., & Fazio, G. G. 2008, ApJ, 675, 1375
- Luhman & Muench (2008) Luhman, K. L. & Muench, A. A. 2008, ApJ, 684, 654
- Luhman et al. (2004) Luhman, K. L., Peterson, D. E., & Megeath, S. T. 2004, ApJ, 617, 565
- Luhman et al. (2006) Luhman, K. L., Wilson, J. C., Brandner, W., Skrutskie, M. F., Nelson, M. J., Smith, J. D., Peterson, D. E., Cushing, M. C., & Young, E. 2006, ApJ, 649, 894
- Neuhäuser & Comerón (1999) Neuhäuser, R. & Comerón, F. 1999, A&A, 350, 612
- Oasa et al. (1999) Oasa, Y., Tamura, M., & Sugitani, K. 1999, ApJ, 526, 336
- Padoan & Nordlund (2004) Padoan, P. & Nordlund, Å. 2004, ApJ, 617, 559
- Payne & Lodato (2007) Payne, M. J. & Lodato, G. 2007, MNRAS, 381, 1597
- Reid et al. (1995) Reid, I. N., Hawley, S. L., & Gizis, J. E. 1995, AJ, 110, 1838
- Scholz & Eislöffel (2004) Scholz, A. & Eislöffel, J. 2004, A&A, 419, 249
- Scholz & Eislöffel (2005) —. 2005, A&A, 429, 1007
- Scholz et al. (2009) Scholz, A., Geers, V., Jayawardhana, R., Fissel, L., Lee, E., Lafreniere, D., & Tamura, M. 2009, ApJ, 702, 805
- Scholz et al. (2007) Scholz, A., Jayawardhana, R., Wood, K., Meeus, G., Stelzer, B., Walker, C., & O’Sullivan, M. 2007, ApJ, 660, 1517
- Stamatellos & Whitworth (2009) Stamatellos, D. & Whitworth, A. P. 2009, MNRAS, 392, 413
- Whitworth & Goodwin (2005) Whitworth, A. P. & Goodwin, S. P. 2005, Astronomische Nachrichten, 326, 899
- Zapatero Osorio et al. (2000) Zapatero Osorio, M. R., Béjar, V. J. S., Martín, E. L., Rebolo, R., Barrado y Navascués, D., Bailer-Jones, C. A. L., & Mundt, R. 2000, Science, 290, 103