Measurements of thermodynamic and transport properties of EuC2:
a low-temperature analogue of EuO
Abstract
EuC2 is a ferromagnet with a Curie-temperature of K. It is semiconducting with the particularity that the resistivity drops by about 5 orders of magnitude on cooling through , which is therefore called a metal-insulator transition. In this paper we study the magnetization, specific heat, thermal expansion, and the resistivity around this ferromagnetic transition on high-quality EuC2 samples. At we observe well defined anomalies in the specific heat and thermal expansion data. The magnetic contributions of and can satisfactorily be described within a mean-field theory, taking into account the magnetization data. In zero magnetic field the magnetic contributions of the specific heat and thermal expansion fulfill a Grüneisen-scaling, which is not preserved in finite fields. From an estimation of the pressure dependence of via Ehrenfest’s relation, we expect a considerable increase of under applied pressure due to a strong spin-lattice coupling. Furthermore the influence of weak off stoichiometries in EuC2±δ was studied. It is found that strongly affects the resistivity, but hardly changes the transition temperature. In all these aspects, the behavior of EuC2 strongly resembles that of EuO.
pacs:
75.47.Gk, 71.30.+h, 65.40.-bI Introduction
Metal dicarbides are composed of a metal ion () and an acetylide ion (C). Depending on the metal their physical properties may vary over a wide range and thus these systems are investigated since several decades. The electronic and magnetic properties depend on the valence of the metal ion and these compounds can be insulators, metals or superconductors gulden97 . Within a simple model which fits for alkaline-earth as well as rare-earth dicarbides long92a ; long92b , trivalent or quadrivalent metals form metallic dicarbides, while divalent metals form insulating compounds. Of particular interest are therefore metals which can realize both, the divalent as well as the trivalent state as, e.g., Eu and Yb. Experimental studies of these systems are however rare, what is most probably related to the fact that both EuC2 as well as YbC2 very rapidly decompose in air. Since 1964 several publications have reported the synthesis of EuC2, but still there is a disagreement if it crystallizes in a tetragonal gebelt64 ; sakai82 or a monoclinic faircloth68 ; wandner10 structure at room temperature and below. The tetragonal modification of EuC2 and its solid solutions with La and Gd have been investigated in Ref. sakai82, and it was found that at least some of the results are not consistent with the simple model mentioned above. For example, the magnetization data of EuC2 reveal a ferromagnetic transition at K with a saturation moment of . This suggests that Europium is in the divalent state and one would expect an insulating behavior, which could, however, not be confirmed by the corresponding measurements of the electrical resistivity. In a more recent work wandner10 , the ferromagnetic order with a somewhat smaller K has been confirmed, but the measured electrical resistivity shows an activated characteristics within the paramagnetic phase and varies over several orders of magnitude when the sample is heated from to room temperature, whereas, according to Ref. sakai82, , is almost temperature independent in that temperature range. Despite these very different temperature dependences of , both works agree at least qualitatively in the observation of a strong suppression of in the ferromagnetic ordered phase. The data of EuC2 presented in Ref. wandner10, strongly resemble those of the highly investigated EuO, which may be viewed as one of the most suitable model systems for future spintronics devices.
In this report, we present a detailed study of the thermodynamic properties specific heat, magnetization, and linear thermal expansion as well as electrical resistivity measurements of various EuC2 samples, which are prepared under slightly varying conditions. The analysis of the thermodynamic properties reveals that the magnetic ordering transition can be consistently described by assuming localized Eu2+ moments with spin that are coupled ferromagnetically. In particular, these data do not yield any indication that the magnetic ordering transition is related with a sizable change of the average valence state of the Eu ions. For the electrical transport behavior, we typically find a semiconducting behavior in the paramagnetic phase and a decrease of in the ferromagnetically ordered phase. The curves measured on different samples, however, vary with respect to the absolute value and/or the activation energy. This sample dependence is very pronounced when the preparation conditions are changed, but – to a less extent – is also present for samples which are prepared under the nominally same conditions.
II Experimental
In order to synthesize EuC2, a total amount of about 2 g of Eu and graphite powders were mixed in the molar ratio of in a ball mill placed inside an Argon-filled glove box. The small surplus of graphite was used to inhibit the formation of EuO and to account for graphite losses due to a reaction with the container wall. The mixed graphite and Eu powder was transferred into a purified Ta ampoule, which was sealed in He atmosphere (800 mbar). Then the sealed ampoule was heated in argon atmosphere to 1400∘C with a heating rate of 400∘C/h, kept there for 24 hours, and then cooled to room temperature with 100∘C/h. It is also possible to decrease the reaction temperature to 1200∘C without changing the physical properties of the synthesized samples. In this latter case the sealed Ta ampoule was placed inside a quartz ampoule, which was sealed in vacuum and the quartz ampoule was heated in air. The resulting EuC2 powder is black and no impurity phases were detectable by x-ray powder diffraction (Huber G670, Mo radiation). In addition, we prepared samples with different Eu:C ratios of in order to get off-stoichiometric samples. Below we will discuss samples prepared with , , and , which are labeled as EuC2, EuC2-δ and EuC2+δ. For the measurements the powder sample obtained by the procedure described above was pressed by 2000 kg to a pellet (diameter 5 mm) and sintered inside a Ta ampoule at 500∘C for 96 h (heating rate: 100∘C/h; cooling rate: 20∘C/h). After sintering the quality of the sample was again checked by x-ray powder diffraction. From the polycrystalline pellets we have sanded pieces to a rectangular shape of typical dimensions of about mm3. As already mentioned EuC2 very rapidly decomposes when it is in contact with air. Thus, all sample handling was carried out in a glove box with inert atmosphere (Ar, 99.999%). This box has been adapted to incorporate various sample rods with measuring cells for the specific heat, the thermal expansion and the electrical resistivity. After the sample was mounted to the respective platform in argon atmosphere, the surrounding tube was evacuated and, for the actual measurements, was put into a 4He bath cryostat equipped with a 14 T magnet. For the measurements at low temperatures (0.3–50 K) we used a 3He evaporator system (Heliox-VL, Oxford Instr.) with home-built devices for heat-capacity and thermal-expansion measurements. The heat-capacity device uses the adiabatic heat-pulse method. The thermal-expansion device is a dilatometer which works with a variable plate capacitor controlled by the sample length. The resistivity has been measured in the temperature range from 5 to 300 K in a home-built setup that provides a temperature-variable sample platform in vacuum. We used a standard 4-probe technique with current and voltage contacts made by a 2-component silver epoxy. The magnetization has been studied in a physical property measurement system (PPMS, Quantum Design) using a vibrating sample magnetometer in the temperature range from 2 to 300 K in magnetic fields up to 14 T. To keep the sample in an Ar atmosphere during the magnetization measurements it was sealed in a quartz capillary (Suprasil) inside the glove box.
III Results and discussion
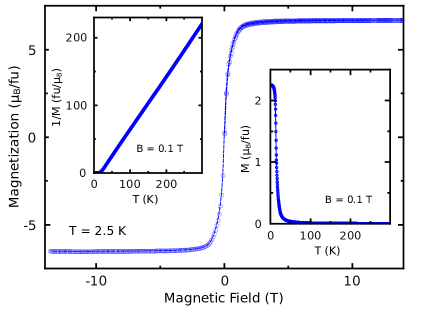
Fig. 1 displays magnetization data of EuC2, which has been measured over a wide range of temperature in an external magnetic field of T and at 2.5 K in the field range of T. As illustrated in the left inset of Fig. 1, the data are well described by the Curie-Weiss law from 300 K down to about 20 K. Around K, strongly increases and approaches an almost constant value with further decreasing temperature. The Curie-Weiss fit yields K, i.e. a ferromagnetic exchange coupling, and an effective magnetic moment fu. The magnetization curve at 2.5 K has the typical characteristics of a soft ferromagnet with a very small hysteresis and a saturation moment of fu. Both, and , agree within about 4 % to the values expected for Eu2+-ion with ( and ). An important observation is that the studied sample does not show any indications of magnetic impurities. In particular, we can exclude a partial oxidation of the sample, because this would result in a contamination with EuO, which would easily be detected in the measurement because it undergoes a ferromagnetic transition at 69 K.
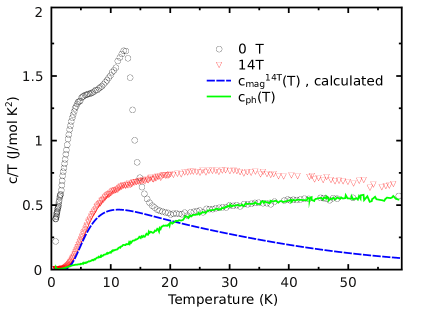
Fig. 2 displays the specific heat measurements in zero field and 14 T. The zero-field data show a pronounced anomaly at K, which can be attributed to the ferromagnetic ordering transition and around 4 K a broad maximum is seen in that resembles a Schottky anomaly. Both features are drastically broadened in the 14 T curve as it is expected for a ferromagnet in a large magnetic field. For a quantitative analysis one has to separate the phononic and magnetic contributions to the total specific heat, . Because we are interested in we need an estimate of that covers the entire temperature range up to 60 K. For this estimate we calculate the magnon contribution for our largest magnetic field of within a mean-field approximation and subtract it from the experimental data. As the phonon contribution can be expected to be independent on the magnetic field, this difference represents for all applied fields. The calculated is shown by the dashed line in Fig. 2 and the solid line displays the obtained , which coincides with the measured zero-field data above K. This appears reasonable, because the zero-field is expected to rapidly fall off above . In principle, one could estimate by subtracting a zero-field calculation of from the respective measured data. The mean-field approximation neglects, however, the fluctuations around and the gapless spinwave excitations at low temperatures, which strongly influence the temperature dependence of in zero field. Thus, we performed the mean-field calculation for a magnetic field of 14 T, which is large enough to strongly broaden the transition and to induce a sizable gap in the excitation spectrum.
Within a mean-field approximation the internal energy per mol formula units of a Heisenberg ferromagnet can be expressed by rodriguez05 :
| (1) |
Here, and denote Avogadro’s constant and Boltzmann’s constant, respectively, is the spin number, the Bohr magneton, the zero-field transition temperature, and the saturation magnetization. Thus, the only parameter to be calculated is the temperature and magnetic-field dependent magnetization . As described in standard textbooks blundell , follows from an implicit equation that can be solved numerically. From equation (1) the magnetic contribution to the molar heat capacity is calculated via
| (2) |
and the magnetic entropy is obtained via integration . The result can be used as a consistency check of the calculation, because J/mol K has to be reached for all magnetic fields when the integration is done to large enough temperatures. The experimental magnetic entropy change of EuC2 is obtained by the integration . For the zero-field data, this integration yields J/mol K, which is very close to the expected value of an system.
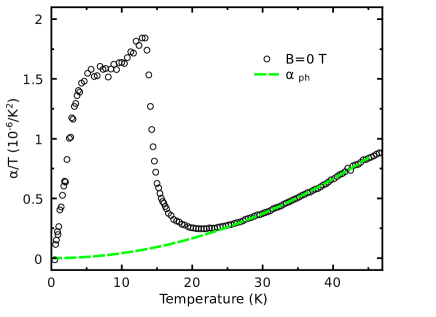
Fig. 3 displays the zero-field linear thermal expansion of EuC2 in the representation versus . Obviously, the shape of this curve with a pronounced anomaly at K and a maximum around 4 K very strongly resembles the data shown in Fig. 2. For the further analysis we again assume the superposition of phononic and magnetic contributions and estimate by a quadratic fit of the zero-field data in the temperature range above 25 K (dashed line in Fig. 3). An approximate proportionality between thermal expansion and specific heat is often observed in solids and is related to the Grüneisen scaling, which can be straightforwardly derived from Maxwell’s relations for systems that are determined by a single energy scale zhu03 ; lorenz07 . The Heisenberg ferromagnet with nearest neighbor exchange is such a system and it has been shown explicitly mattis63 ; callen65 ; argyle67 that the magnetic contributions of the specific heat and thermal expansion are expected to scale with each other with a proportionality constant that is determined by the pressure (or volume) dependence of . Thus, the magnetic contribution of the thermal expansion coefficient can be expressed as
| (3) |
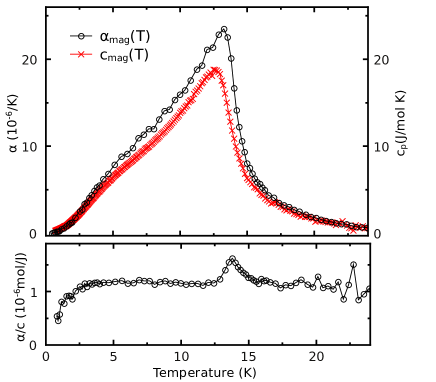
The additional factor of 3 in the denominator takes into account that is the linear thermal expansion, which in case of a polycrystal is 1/3 of the volume expansion. Fig. 4 compares the zero-field data of and , which are obtained by subtracting and from the respective measurements. In the lower panel of this figure we show the ratio , which is practically constant in the temperature range from about 2 to 22 K. The peak in the close vicinity of Tc may partly arise from small differences in the temperature calibrations of the different experimental setups for the thermal expansion and the specific heat measurements. An additional source for this deviation are differences in the critical behavior of and .
The measurements of thermal expansion and specific heat also allow to derive the initial slope of the at ambient pressure. In case of a second-order phase transition this pressure dependence is given by the Ehrenfest relation
| (4) |
where and denote the mean-field jumps of and , respectively. Because there are no sharp jumps in and , one could approximate the experimentally obtained anomalies by jumps using, e.g., area-conserving constructions or it is possible to obtain a measure of from a scaling of the anomalies of and in the vicinity of . This second possibility expresses a reformulation of Eq. (4) in the form of Eq. (3), where is exchanged by . Within mean-field theory and are proportional to each other and therefore meaning that Eqs. (4) and (3) are equivalent. Although this strict equality will not be valid in reality due to the presence of fluctuations, one may expect an approximate equality of Eqs. (4) and (3). As shown in the lower panel of fig. 4 the ratio mol/J over most of the temperature range and increases to mol/J around . Thus, using cm3 we estimate the hydrostatic pressure dependences
| (5) |
corresponding to an initial slope K/GPa. Thus, we conclude that external pressure should cause a strong increase of the ferromagnetic transition temperature of EuC2 arising from a strong spin lattice coupling.
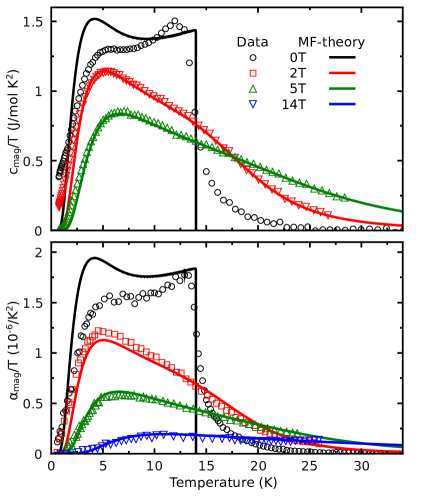
In the upper panel of Fig. 5 the experimental magnetic contribution of the specific heat measured for different magnetic fields is compared to the respective calculated via Eq. (2). As already mentioned the mean-field calculation only yields a poor description of the zero-field data, because it neither reproduces the spin-wave contribution in the low-temperature region nor the behavior around . The experimental data obtained in 2 and 5 T are, however, rather well described, in particular in the high-temperature range. There are still deviations at low temperatures, but with increasing field these deviations decrease. Note that the data for 14 T is not shown here, because this measurement was used to estimate the phonon contribution .
The lower panel of Fig. 5 displays the magnetic contribution of the thermal expansion for different magnetic fields, which behaves very similar as . For a ferromagnet with pressure dependent exchange interaction, mean-field theory predicts an anomalous length change , which is proportional to the squared magnetization callen65 ; chikazumi . Thus, for the magnetic thermal expansion is expected and, in order to emphasize the close analogy between and , we express the magnetic thermal expansion as
| (6) |
This expression is identical to the first term of Eq. (2) multiplied by a constant factor , which is determined by the scaling behavior of the zero-field data shown in Fig. 4, i.e. mol/J. Thus, all parameters of Eq. (6) are fixed and calculated for different fields is shown by the solid lines in Fig. 5. Again, there are strong deviations concerning the zero-field data, whereas the agreement is satisfactory already for a field of 2 T and is getting better with further increasing field. It is interesting to note that according to the mean-field equations (2) and (6) the scaling of the zero-field and is no longer valid in finite magnetic fields. This mean-field result is confirmed by the experimental data, despite the fact that the mean-field calculations do not reproduce the respective zero-field data: Fig. 4 confirms the scaling of the experimental zero-field data of and and in Fig. 5 it is seen that this scaling changes in a finite magnetic field, because the flattening of the zero-field anomaly is more pronounced for than for .
From the thermodynamic data presented above we find that the magnetization as well as the magnetic contributions of the specific heat and the thermal expansion are satisfactorily described within a mean-field theory assuming Eu2+ ions with localized moments coupled via a pressure-dependent exchange coupling . In particular, these data do not show any indications for field- or temperature-induced changes of the Eu valence, in agreement with the results of Ref. wandner10, . Mößbauer measurements done in this previous work detected a small, but temperature-independent fraction of about of Eu3+. The % reduction of the measured and compared to the expected values for an system could also be explained by such an amount of Eu3+, because Eu3+ only has a weak paramagnetic van Vleck susceptibility. It is, however, unclear whether such an Eu3+ content is an intrinsic property of EuC2, since it might also arise from a sample-dependent off stoichiometry and/or a weak oxygen contamination. The influence of weak off stoichiometries is also subject of intense studies in the closely related EuO, see e.g. Ref. steeneken02, , and it is found that the electrical resistivity can be drastically changed by weak variations of the Eu:O ratio. If EuC2 is considered as a purely ionic compound composed of Eu2+ and C ions, a semiconducting behavior would be expected over the entire temperature. This simple ionic picture is, however, contradicted by the measured resistivity showing an insulator-to-metal transition that coincides with the ferromagnetic ordering in zero-field wandner10 . Moreover, EuC2 shows a giant magneto resistance effect in finite magnetic fields with resistivity changes of several orders of magnitude around . Thus, EuC2 behaves very similar to EuO.
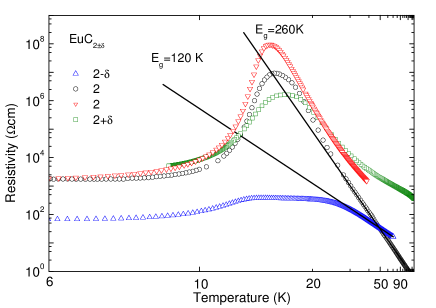
In order to get more insight about the influence of stoichiometry, the synthesis of EuC2±δ samples has been performed. Fig. 6 compares the resistivity of two nominally stoichiometric EuC2 samples and two off-stoichiometric samples that are expected to be either Eu- or C2-deficient, i.e. nominally electron- or hole-doped. The qualitative behavior for all samples is rather similar. Upon decreasing the temperature down to , the resistivity continuously increases, then strongly decreases below and finally becomes practically temperature-independent below about 7 K. Based on the opposite temperature dependences above and below , one may discuss this as an insulator-to-metal transition, but in view of the rather large absolute values of below , it is also appropriate to consider an insulator-to-insulator transition. Concerning the maxima, the nominally stoichiometric samples reach cm. The maximum for the nominally Eu-deficient sample is still larger than cm, while in the C2-deficient sample a broadened plateau is observed with cm in the temperature range from about 12 to 20 K. Moreover, the low-temperature resistivity of EuC2-δ is about one order of magnitude lower than of the other samples. In the temperature range above K, the resistivity of all samples decreases more or less linearly in the Arrhenius plot, i.e., there is an activated behavior with a temperature-independent activation energy . It is remarkable that both off-stoichiometric samples have a similar K in the paramagnetic phase, whereas the stoichiometric samples have a significantly larger activation energy K. This suggests that variations in the stoichiometry induce donator or acceptor levels in the bandgap, which may strongly influence the resistivity behavior, but the influence on the ferromagnetic ordering temperature is comparatively weak. At the present stage of sample preparation and characterization it is not possible to give a precise determination of the real composition of the studied sample, which would be necessary to estimate the charge-carrier content. This together with the fact that no single-crystalline samples are available, prevents a deeper analysis of the complex resistivity behavior of the different samples shown in Fig. 6. In many aspects the data of EuC2±δ resemble the early investigations of the Eu chalcogenides EuS and EuO shapira72 ; shapira73a ; oliver72 ; mauger80 . There, it was also observed that, depending on the exact preparation process and/or subsequent tempering procedures, the resistivity may vary over several orders of magnitude, in particular in the temperature range of the ferromagnetic ordering temperature. This has been attributed to the influence of donator and/or acceptor levels, that are controlled by the exact stoichiometry. The occurrence of an insulator-to-metal transition at the ferromagnetic ordering of EuO is explained by an exchange splitting of the conduction band into spin-up and spin-down bands, which is large enough to drop one of these bands below the donator levels steeneken02 . This means, however, that a finite amount of donator levels is required in order to make the ferromagnetic state conducting. Because our data of EuC2 in most aspects strongly resemble the corresponding data of EuO, we conclude that EuC2 represents a low-temperature analogue of EuO.
IV Summary
We have investigated the magnetization, specific heat, thermal expansion, and resistivity of high-quality EuC2 samples. The temperature and field dependence of the magnetization fit the magnetic moment expected for Eu2+ ions with . The specific heat and the thermal expansion show well-defined anomalies at the magnetic phase transition and the magnetic contributions of and could be extracted for further analyses. Using Ehrenfest’s relation to determine the pressure dependence of the Curie-temperature, an initial slope of K/GPa is found. The zero-field data of yield a magnetic entropy J/mol K, which is close to the expected value of an system. The ratio is practically constant in the temperature from about 2 to 22 K meaning that the respective zero-field data obey a magnetic Grüneisen scaling. This Grüneisen scaling is, however, not preserved in finite magnetic fields. Comparing the experimentally obtained magnetic contributions and to the respective results calculated within a mean-field model for an system, we find that the experimental data for larger magnetic fields are well reproduced by the mean-field model, whereas the calculations for zero-field only yield a poor description of the experimental data. Nevertheless, the mean-field model correctly predicts that the zero-field Grüneisen scaling is no longer valid in finite fields. The influence of weak off stoichiometries was studied by comparing the resistivity measurements of nominally stoichiometric EuC2 and off-stoichiometric samples, which are expected to be either Eu or C2 deficient. The variations in the stoichiometry most probably induce donator or acceptor levels in the bandgap, which strongly affects the resistivity behavior, whereas the influence on is comparatively weak. In all these aspects the resistivity data strongly resemble the early investigations of the Eu chalcogenide EuO.
Acknowledgements.
This work was supported by the Deutsche Forschungsgemeinschaft through Schwerpunktprogramm 1166 and Sonderforschungsbereich 608.References
- (1) Th. Gulden, R. W. Henn, O. Jepsen, R. K. Kremer, W. Schnelle, A. Simon, and C. Felser. Phys. Rev. B 56, 9021 (1997).
- (2) J.R. Long, R. Hoffmann, and H.-J. Meyer. Inorg. Chem. 31, 1734 (1992).
- (3) J. R. Long, J.-Y. Halet, J.-Y. Saillard, R. Hoffmann, and H. J. Meyer. New J. Chem. 16, 839 (1992).
- (4) R. E. Gebelt and H. A. Eick. Inorg. Chem. 3, 335 (1964).
- (5) T. Sakai, G. Adachi, T. Yoshida, S. Ueno, and J. Shiokawa. Bull. Chem. Soc. Jpn. 55, 699 (1982).
- (6) R.L. Faircloth, R.H. Flowers, and F.C.W. Pummery. J. Inorg. Nucl. Chem 30, 499 (1968).
- (7) D. Wandner, P. Link, O. Heyer, J. Mydosh, M.A. Ahmida, M.M. Abd-Elmeguid, M. Speldrich, H. Lueken, and U. Ruschewitz. Inorg. Chem. 49, 312 (2010).
- (8) J. Fernandez Rodriguez and J.A. Blanco. Phys. Scr. 71, 19 (2005).
- (9) S. Blundell. Magnetism in Condened Matter. Oxford Master Series. Oxford University Press Inc. 2001.
- (10) Lijun Zhu, Markus Garst, Achim Rosch, and Qimiao Si. Phys. Rev. Lett. 91(6), 066404 (2003).
- (11) T. Lorenz, S. Stark, O. Heyer, N. Hollmann, A. Vasiliev, A. Oosawa, and H. Tanaka. J. Magn. Magn. Mater. 316, 291 (2007).
- (12) D.C. Mattis and T.D. Schultz. Phys. Rev. 129, 175 (1963).
- (13) E. Callen and H.B. Callen. Phys. Rev. 139, A455 (1965).
- (14) B. E. Argyle, N. Miyata, and T. D. Schultz. Phys. Rev. 160, 413 (1967).
- (15) S. Chikazumi. Physics of Ferromagnetism. International Series of Monographs on Physics. Oxford University Press Inc. 1997.
- (16) P. G. Steeneken, L. H. Tjeng, I. Elfimov, G. A. Sawatzky, G. Ghiringhelli, N. B. Brookes, and D.-J. Huang. Phys. Rev. Lett. 88, 047201 (2002).
- (17) Y. Shapira and T.B. Reed. Phys. Rev. B 5, 4877 (1972).
- (18) Y. Shapira, S. Foner, and T. B. Reed. Phys. Rev. B 8, 2299 (1973).
- (19) M. R. Oliver, J. O. Dimmock, A. L. McWhorter, and T. B. Reed. Phys. Rev. B 5, 1078 (1972).
- (20) A. Mauger and C. Godart. Solid State Commun. 35, 785 (1980).