A search for optical bursts from RRAT J18191458: II. Simultaneous ULTRACAM–Lovell Telescope observations
Abstract
The Rotating RAdio Transient (RRAT) J18191458 exhibits ms bursts in the radio every min, implying that it is visible for only s per day. Assuming that the optical light behaves in a similar manner, long exposures of the field would be relatively insensitive due to the accumulation of sky photons. A much better way of detecting optical emission from J18191458 would then be to observe with a high-speed optical camera simultaneously with radio observations, and co-add only those optical frames coincident with the dispersion-corrected radio bursts. We present the results of such a search, using simultaneous ULTRACAM and Lovell Telescope observations. We find no evidence for optical bursts in J18191458 at magnitudes brighter than (5 limit). This is nearly 3 magnitudes fainter than the previous burst limit, which had no simultaneous radio observations.
keywords:
stars: neutron – pulsars: individual: J18191458.1 Introduction
The RRATs are a group of isolated Galactic neutron stars discovered in an archival search of the Parkes Multi-beam Pulsar Survey (PMPS; McLaughlin et al. 2006). They are characterised by millisecond radio bursts with flux densities at GHz of Jy. The bursts are infrequent, with intervals of as long as a few hours to as short as a few minutes (Keane et al., 2010). The rotation periods, inferred by dividing the burst intervals by the largest common denominator, lie in the s range. Of the 22 RRAT sources in the PMPS with known periods, 11 have periods greater than 4 s, compared to just of radio pulsars (Keane, 2010). These long periods are reminiscent of the (X-ray dim) isolated neutron stars and the magnetars (see Haberl 2007 and Mereghetti 2008). Using their dispersion measure, the RRATs are found to lie approximately 1–7 kpc distant in the Galactic plane (Keane, 2010).
The nature of RRATs is still an open question. A simple estimate of their Galactic population suggests that they may be more abundant than the radio pulsars. In fact, if we consider RRATs and the other known classes of neutron stars as distinct populations, a birthrate problem arises, i.e. neutron stars appear to be formed faster than the observed supernova rate. This problem may be resolved, however, if the various neutron star types are instead regarded as different evolutionary phases (Keane & Kramer, 2008). Two main models have been proposed for the intermittent pulses exhibited by RRATs, with some researchers assigning the phenomenon to detection issues and others favouring intrinsically transient emission. Weltevrede et al. (2006) suggest that RRATs are distant analogues of PSR B0656+14, i.e. pulsars with regular emission that is below our detection limit but which show large amplitude pulses drawn from an extended pulse-energy distribution. Alternatively, Cordes & Shannon (2008) suggest that the bursts in RRATs are powered by the episodic injection of material from a circumpolar asteroid belt, formed from supernova fallback material, that temporarily reactivates a quiescent region of the magnetosphere. Similarly, Luo & Melrose (2007) propose that RRATs may be surrounded by planetary-like radiation belts, and the trapped plasma in this belt is episodically disrupted (e.g. by starquakes or stellar oscillations) causing particle precipitation towards the star and hence bursts. Besides external triggers, it has also been suggested (Zhang et al., 2007) that RRATs are old pulsars approaching the ‘death valley’ (Chen & Ruderman, 1993), where pulsar emission is thought to switch off.
Of the 56 known RRATs (Keane, 2010), J18191458 is the most prolific, brightest and thus best-studied source. J18191458 has a rotation period of s and shows ms pulses every min, amounting to s of radio emission per day. From its measured period derivative, J18191458 has an inferred magnetic field strength of G, just below that of the magnetars, providing another link between these two classes of neutron stars. As well as in the radio (e.g. Lyne et al. 2009), J18191458 has been observed in X-rays on several occasions (Reynolds et al. 2006, McLaughlin et al. 2007, Rea et al. 2009). The X-ray observations show a thermal spectrum consistent with what is expected from a cooling neutron star, and the X-ray flux exhibits the same rotation period as derived from radio observations. Observations of J18191458 at wavelengths other than radio and X-ray are also highly desirable in order to measure the spectral energy distribution and help constrain the pulsar emission mechanism. Deep infrared observations have revealed very tentative evidence for a counterpart at magnitude (Rea et al., 2010). There is no evidence of an optical counterpart, but this could be due to the rather modest magnitude limit of (Reynolds et al., 2006).
Taking longer exposures to go deeper, however, is not necessarily the best solution, as the RRATs may have very faint persistent optical/IR emission and only emit strongly at these wavelengths during bursts111The main optical pulse of the Crab pulsar, for example, is magnitudes brighter than its persistent light level.. In this case, the best strategy would be to reduce the contribution of the sky and take a continuous sequence of extremely short exposures on a large-aperture telescope covering a number of burst cycles in order to catch a burst in one or two of the frames. In paper I (Dhillon et al., 2006), we tried such an approach using the high-speed CCD camera ULTRACAM (Dhillon et al., 2007) on the 4.2-m William Herschel Telescope (WHT). We found no evidence for bursts brighter than . This limit may not appear to be particularly deep, but it must be remembered that it refers to the burst magnitude, not the persistent magnitude. In fact, there is only one way in which it is possible to significantly improve upon the ULTRACAM+WHT burst limit: observing in the optical simultaneously with the radio, which would allow just those optical frames coincident with the dispersion-corrected radio bursts to be searched for optical bursts. In this paper we report on such observations, obtained with ULTRACAM on the WHT and the 3.5-m New Technology Telescope (NTT), simultaneously with the 76-m Lovell Telescope at Jodrell Bank Observatory (JBO).
2 Observations
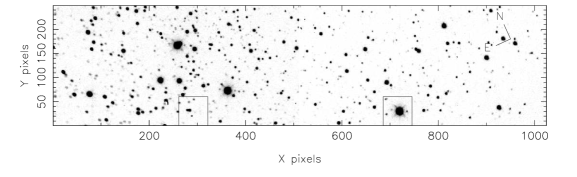
The observations of J18191458 were obtained on the nights of 2008 August 6 (WHT+ULTRACAM and JBO) and 2010 June 14 (NTT+ULTRACAM and JBO). In addition to shot noise from any object flux, every ULTRACAM data frame has noise contributions from the sky and CCD readout noise. The sky noise can be reduced by reducing the exposure time, but the readout noise cannot. Hence it makes sense to expose each data frame for as long as the readout noise is the dominant noise source, thereby maximising the chances of observing a burst in a single frame without significantly degrading the signal-to-noise ratio of the data. ULTRACAM was hence used in drift mode, which gives the highest frame rate (see Dhillon et al. 2007), with one window centred on the X-ray position of the RRAT (Rea et al., 2009) and the other on a nearby comparison star, as shown in the top panel of Fig. 1. An SDSS filter and the slow readout speed were used in the red arm of ULTRACAM on both nights, and the focal-plane mask was used to prevent light from bright stars and the sky from contaminating the windows (see Dhillon et al. 2007). On 2008 August 6, the CCD windows were unbinned and of size pixels, where each pixel on the WHT is 0.3”. A total of 112 588 frames were obtained between 21:11–22:49 UTC on this night, each of 51.1 ms exposure time and 1.4 ms dead time. The data were obtained in photometric conditions, with no Moon and seeing of 0.9”. On 2010 June 14, the CCD windows were binned and of size pixels, where each unbinned pixel on the NTT is 0.35”. A total of 68 274 frames were obtained between 01:32–02:14 UTC and 02:45–03:46 UTC; the gap in the middle of the run was due to a GRB override observation (Dhillon et al., 2010). Each frame had an exposure time of 86.5 ms and a dead time of 3.5 ms. Conditions on this night were not as good as in 2008, with seeing of 1.9” at the start of the run, dropping to 1.2” at the end. The night was photometric and there was no Moon.
Simultaneous radio observations at JBO were made at an observing frequency of GHz using a dual-channel cryogenic receiver sensitive to left- and right-handed circular polarisation. In 2008 an analogue filterbank (AFB) backend was used with an observing bandwidth consisting of MHz channels and a time sampling of s. Since 2009, pulsar observations at JBO have upgraded to using a digital filterbank (DFB) backend. Thus the 2010 observations used the DFB with a bandwidth of MHz channels, half of which ( MHz) were usable, and a time sampling of ms. In both cases, the polarisations were summed to give total intensity (Stokes I) and the output was either 1-bit digitised (in 2008) or 2-bit digitised (in 2010). In both radio datasets the zero dispersion-measure subtraction algorithm (Eatough et al., 2009) was used in an attempt to remove sources of broadband radio frequency interference, as described by Keane et al. (2010). The 2008 dataset suffers less from radio frequency interference than the 2010 observations due to the narrower bandwidth of the former. The pulse times of arrival at JBO were then obtained by cross-correlating the single-pulse profiles with a smooth single-component template. In addition to the light travel time from the source to the Earth, radio signals traversing the interstellar medium suffer an extra frequency-dependent delay of the form: , where is the observing frequency in MHz, and is the dispersion measure (the integrated electron density along the line of sight to the source measured by convention in units of ). At GHz, this delay is ms for J18191458 () with respect to a signal at infinite frequency, and differs by ms ( ms) between the top and bottom of our band for the 2008 (2010) observation. The optical signal is not subject to such a delay. Thus the radio signal is de-dispersed to infinite frequency (i.e. this delay is removed according to the known dispersion measure of the source) before comparison is made with the optical times.
3 Data reduction
The ULTRACAM frames were first debiased and then flat-fielded using images of the twilight sky. The list of JBO pulse arrival times on each night were corrected for dispersion, converted to Barycentric Dynamical Time (TDB) at the solar system barycentre, and then compared with the barycentred ULTRACAM times. Note that each ULTRACAM frame is time-stamped to a relative (i.e. frame-to-frame) accuracy of 50 s and an absolute accuracy of 1 ms using a dedicated GPS system (see Dhillon et al. 2007). It was found that 24 and 25 dispersion-corrected radio bursts had corresponding optical frames on 2008 August 6 and 2010 June 14, respectively, and these ULTRACAM images were then shifted to correct for telescope guiding errors and co-added (see Section 4).
Aperture photometry at the X-ray position of J18191458 (Rea et al., 2009) was performed using the ULTRACAM pipeline data reduction system. To do this, we had to determine the pixel position of J18191458 on the ULTRACAM CCD. This was achieved by transforming the pixel coordinates to equatorial coordinates using the known positions of bright stars in the field. We estimate that the uncertainty in the resulting pixel position of J18191458 is 0.5”. We extracted a light curve for both the comparison star and the position of the RRAT using variable-sized apertures with diameters set to 3 times the seeing, as measured from the FWHM of the comparison star, which is times larger than the error in the RRAT position on the ULTRACAM frames. The sky level was determined from an annulus surrounding each aperture and subtracted from the object counts.


4 Results
Radio observations
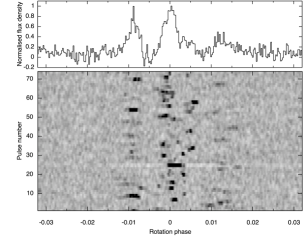
The radio pulses detected from J18191458 are known to arrive preferentially at three distinct rotation phases (Lyne et al., 2009). The left-hand panel of Fig. 2 shows a grey-scale intensity plot of the individual pulses detected during the 2010 June 14 observation with the Lovell Telescope, as well as the combined profile from adding these pulses together. The three ‘sub-pulses’ are clearly visible. The right-hand panel of Fig. 2 shows a histogram of pulse arrival times in rotation phase with respect to the long-term radio-derived ephemeris at JBO (Lyne et al., 2009). This is essentially a probability distribution in rotation phase for the radio pulses. The unshaded histogram denotes all pulses detected, as part of our regular timing observations (Lyne et al., 2009), in the time interval between the optical observations in 2008 and in 2010. The shaded histogram shows the corresponding distribution for the pulses detecting during the optical observations. The two histograms are similar, implying that the pulses detected during the simultaneous observations were typical and J18191458 seems to have been no more nor less ‘active’ in the radio than at other times.
Optical observations
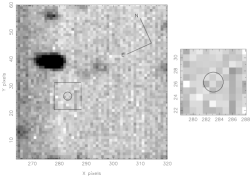
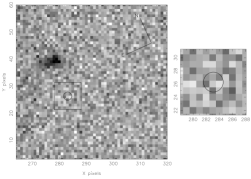
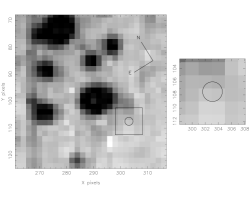
The sum of the 24 and 25 ULTRACAM -band frames containing radio bursts on 2008 August 6 and 2010 June 14 are shown in the right-hand central and lower panels of Fig. 1. For comparison, the sum of all the ULTRACAM frames obtained on each night are shown in the corresponding left-hand panels.
The circles plotted in Fig. 1 indicate the expected position of J18191458, with the radius equal to the error in this position on our ULTRACAM frames. Inspecting the zoomed-in boxes to the right of each panel reveals no visual evidence for the RRAT in either burst (right) or persistent (left) light. Note the significantly worse quality of the NTT data (bottom panels in Fig. 1) compared to the WHT data (central panels) due to the poorer seeing, which forced us to on-chip bin these data by a factor of 2.
So far, we have implicitly assumed that the optical and radio bursts are coincident, and that the radio bursts are equal or shorter in duration than the putative optical bursts. This is a reasonable assumption given, for example, the behaviour of the Crab pulsar, which shows that the optical pulse is approximately 5 times wider than the radio pulse and leads the radio pulse by only s (Shearer et al., 2003; Słowikowska et al., 2009). Since we know precisely when the radio bursts occured, it is a simple matter to search for optical bursts lagging/leading the radio bursts and/or of different widths to the radio bursts by combining the appropriate optical frames. Hence, as well as summing the ULTRACAM frames coincident with the radio bursts, , we also co-added the frames , and . None of the resulting images show any evidence of the RRAT.
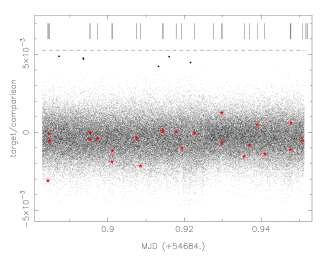
The searches described so far have relied on the ability of the eye to identify a star in a summed image. A different approach is to inspect the light curve obtained by extracting the counts in an aperture centred on the position of the RRAT. Fig. 3 shows the light curves obtained on each night. The signature of an optical counterpart to the radio bursts would be a series of deviant points lying approximately 5 or greater from the mean222We have chosen 5 as we have data points and only one point in would be expected to be greater than 5 from the mean in a Gaussian distribution. and aligned temporally with the radio bursts (indicated by the vertical tick marks near the top of Fig. 3). Given that the exposure time is significantly longer than the radio burst duration, one would expect only one, or at most two, points per burst.
The dashed line in Fig. 3 shows the +5 deviation level. It can be seen that there are no points lying above this line. Moreover, the optical points coincident with the radio bursts, marked by the stars in Fig. 3, appear to be randomly scattered about the mean level of zero. Fig. 3 also shows the points lying 4 above the mean: none of these are coincident with the radio bursts, none of the images show any obvious sign of a star, and the intervals between the 4 points are not related to the rotation period. The implication of the preceding results is that we have not detected any evidence for optical counterparts to the radio bursts from J18191458. We also searched for periodicities in the light curves using a Lomb-Scargle periodogram (Press & Rybicki, 1989). No evidence for a significant peak around the 4.263 s rotation period, or any other period, was found. As stated in Section 2, the dead-time of ULTRACAM during our J18191458 observations was always an insignificant fraction of the exposure time and approximately the same duration as the radio bursts shown in Fig. 2. This makes it unlikely we missed a single optical burst whilst ULTRACAM was reading out, let alone the expected 24–25 bursts.
It is useful to place a magnitude limit on the optical bursts from J18191458 in order to constrain the spectral energy distribution. From the summed images of the burst frames, we find that the RRAT shows no evidence for optical bursts brighter than at the 5 level in the deeper WHT observations. As expected, the simultaneous optical-radio observations have enabled us to impose a significantly deeper limit than the optical-only observations of paper I, when we derived . The corresponding flux density limit is Jy, where the flux has been calculated using equation 2 of Fukugita et al. (1996) and the effective wavelength of the observation is 7610Å (see Dhillon et al. 2006). We can now compare this to the burst radio flux density of 3600 mJy at 1.4 GHz measured by McLaughlin et al. (2006) to deduce that the spectral slope must be steeper than approximately . Note that the X-ray emission of J18191458, which exhibits pulsations rather than bursts, is 10 nJy at 0.3-5 keV (Rea et al., 2009), and also lies very close to the line . For comparison, the radio-to-optical slope of the pulsed radiation from the Crab has a much shallower slope of (measured from Fig. 9.3 of Lyne & Graham-Smith 2005).
For completeness, we have also calculated the magnitude limit of J18191458 from the sum of all of the WHT observations. We derive a magnitude limit of at 5 confidence, significantly deeper than the limit on the persistent light of derived by Reynolds et al. (2006). Of course, our limit could have been substantially deeper had we decided not to look for bursts and instead taken just a few long exposures.
5 Discussion
In paper I, we used aperture photometry centred on the X-ray position of J18191458 to search for the RRAT. With no way of knowing in which frames the bursts occurred, this search strategy was relatively insensitive, as we were relying on detecting individual optical bursts above the noise. In this paper, we present a far more sensitive technique: simultaneous radio observations of the RRAT bursts to tag the corresponding optical frames. These tagged frames were then co-added to produce a summed ‘burst’ frame. Unfortunately, even though the resulting summed frame allowed us to probe nearly 3 magnitudes deeper than before, we find no evidence for the RRAT to a 5 limit of . This limit allows us to say that the slope of the pulsed radio-optical spectrum must be steeper than and that extrapolating this slope correctly predicts the X-ray flux. A more detailed comparison with RRAT emission models is unjustified without unambiguously determined fluxes in the optical and infrared.
In comparison to our other detections of pulsars with ULTRACAM, e.g. for AXP 1E 1048.1–5937 (Dhillon et al., 2009), our limit on J18191458 does not appear to be particularly deep. To place it in some context, therefore, it should be noted that if we had taken a single 1 hour exposure of the field with the WHT under identical conditions, and assuming the object emitted 24 bursts, each of and 51.1 ms duration, we would have have obtained a signal-to-noise ratio of only . Using the high-speed photometry technique described in this paper, on the other hand, we would have detected the source at 5. The difference in sensitivity between the two techniques is due to the fact that the long exposure would be sky limited, whereas the data presented in this paper are readout-noise limited, and the former noise source is over twenty times larger than the latter. The only way we can now significantly improve upon our magnitude limit with ULTRACAM is to observe simultaneously for a longer period of time (in order to detect and co-add more bursts) and/or use larger optical and radio telescopes (in order to increase the number of counts detected from each burst in the optical and to detect more bursts in the radio). The discussion above assumes, of course, that the optical and radio light behave in a similar manner. If, however, the optical light has only a low (or no) pulsed fraction, then deep, long-exposure imaging might prove fruitful, as might deeper searches for pulsed light on the proposed rotation period of the neutron star, e.g. Dhillon et al. (2009).
Acknowledgements
ULTRACAM, VSD, TRM, CMC, SPL and PK are supported by the STFC. SPL also acknowledges the support of an RCUK Fellowship. EFK acknowledges the support of a Marie-Curie EST Fellowship with the FP6 Network “ESTRELA” under contract number MEST-CT-2005-19669. Based on observations collected at ESO, Chile (Programme 085.D-0429) and the ING, La Palma.
References
- Chen & Ruderman (1993) Chen K., Ruderman M., 1993, ApJ, 402, 264
- Cordes & Shannon (2008) Cordes J. M., Shannon R. M., 2008, ApJ, 682, 1152
- Dhillon et al. (2010) Dhillon V., Mignani R., Schulze S., Levan A. J., Tanvir N. R., de Cia A., 2010, GCN Circular, 10842
- Dhillon et al. (2006) Dhillon V. S., Marsh T. R., Littlefair S. P., 2006, MNRAS, 372, 209
- Dhillon et al. (2009) Dhillon V. S., Marsh T. R., Littlefair S. P., Copperwheat C. M., Kerry P., Dib R., Durant M., Kaspi V. M., Mignani R. P., Shearer A., 2009, MNRAS, 394, L112
- Dhillon et al. (2007) Dhillon V. S., Marsh T. R., Stevenson M. J., Atkinson D. C., Kerry P., Peacocke P. T., Vick A. J. A., Beard S. M., Ives D. J., Lunney D. W., McLay S. A., Tierney C. J., Kelly J., Littlefair S. P., Nicholson R., Pashley R., Harlaftis E. T., O’Brien K., 2007, MNRAS, 378, 825
- Eatough et al. (2009) Eatough R. P., Keane E. F., Lyne A. G., 2009, MNRAS, 395, 410
- Fukugita et al. (1996) Fukugita M., Ichikawa T., Gunn J. E., Doi M., Shimasaku K., Schneider D. P., 1996, AJ, 111, 1748
- Haberl (2007) Haberl F., 2007, Ap&SS, 308, 181
- Keane (2010) Keane E. F., 2010, PhD thesis, University of Manchester
- Keane & Kramer (2008) Keane E. F., Kramer M., 2008, MNRAS, 391, 2009
- Keane et al. (2010) Keane E. F., Ludovici D. A., Eatough R. P., Kramer M., Lyne A. G., McLaughlin M. A., Stappers B. W., 2010, MNRAS, 401, 1057
- Luo & Melrose (2007) Luo Q., Melrose D., 2007, MNRAS, 378, 1481
- Lyne & Graham-Smith (2005) Lyne A. G., Graham-Smith F., 2005, Pulsar Astronomy. Cambridge University Press, Cambridge
- Lyne et al. (2009) Lyne A. G., McLaughlin M. A., Keane E. F., Kramer M., Espinoza C. M., Stappers B. W., Palliyaguru N. T., Miller J., 2009, MNRAS, 400, 1439
- McLaughlin et al. (2006) McLaughlin M. A., Lyne A. G., Lorimer D. R., Kramer M., Faulkner A. J., Manchester R. N., Cordes J. M., Camilo F., Possenti A., Stairs I. H., Hobbs G., D’Amico N., Burgay M., O’Brien J. T., 2006, Nat, 439, 817
- McLaughlin et al. (2007) McLaughlin M. A., Rea N., Gaensler B. M., Chatterjee S., Camilo F., Kramer M., Lorimer D. R., Lyne A. G., Israel G. L., Possenti A., 2007, ApJ, 670, 1307
- Mereghetti (2008) Mereghetti S., 2008, A&AR, 15, 225
- Press & Rybicki (1989) Press W. H., Rybicki G. B., 1989, ApJ, 338, 277
- Rea et al. (2010) Rea N., Curto G. L., Testa V., Israel G. L., Possenti A., McLaughlin M., Camilo F., Gaensler B. M., Burgay M., 2010, MNRAS, 407, 1887
- Rea et al. (2009) Rea N., McLaughlin M. A., Gaensler B. M., Slane P. O., Stella L., Reynolds S. P., Burgay M., Israel G. L., Possenti A., Chatterjee S., 2009, ApJ, 703, L41
- Reynolds et al. (2006) Reynolds S. P., Borkowski K. J., Gaensler B. M., Rea N., McLaughlin M., Possenti A., Israel G., Burgay M., Camilo F., Chatterjee S., Kramer M., Lyne A., Stairs I., 2006, ApJ, 639, L71
- Shearer et al. (2003) Shearer A., Stappers B., O’Connor P., Golden A., Strom R., Redfern M., Ryan O., 2003, Sci, 301, 493
- Słowikowska et al. (2009) Słowikowska A., Kanbach G., Kramer M., Stefanescu A., 2009, MNRAS, 397, 103
- Weltevrede et al. (2006) Weltevrede P., Stappers B. W., Rankin J. M., Wright G. A. E., 2006, ApJ, 645, L149
- Zhang et al. (2007) Zhang B., Gil J., Dyks J., 2007, MNRAS, 374, 1103