Low-energy dipole excitations in neon isotopes and isotones within the quasiparticle random phase approximation and the Gogny force
Abstract
Low-energy dipole excitations in neon isotopes and isotones are calculated with a fully consistent axially-symmetric-deformed quasiparticle random phase approximation (QRPA) approach based on Hartree-Fock-Bogolyubov (HFB) states. The same Gogny D1S effective force has been used both in HFB and QRPA calculations. The microscopical structure of these low-lying resonances, as well as the behavior of proton and neutron transition densities, are investigated in order to determine the isoscalar or isovector nature of the excitations. It is found that the isotones 24O, 26Ne, 28Mg, and 30Si are characterized by a similar behavior. The occupation of the 2s1/2 neutron orbit turns out to be crucial, leading to nontrivial transition densities and to small but finite collectivity. Some low-lying dipole excitations of 28Ne and 30Ne, characterized by transitions involving the 1d3/2 state, present a more collective behavior and isoscalar transition densities. A collective proton low-lying excitation is identified in the 18Ne nucleus.
pacs:
21.60.Jz, 21.10.Gv, 27.30.+tI Introduction
Since the beginning of the nuclear physics, dipole excitations of nuclei represented one of the most important ways to investigate nuclear structure. This is due to the fact that they can be induced by radiation. The first evidence of isovector giant dipole resonance (IVGDR) was obtained in the 1937 BOT37 . Extensive experimental and theoretical studies started about ten years later and provided simple expressions that systematically reproduce the excitation energy and the strength of the IVGDR in the whole nuclear chart ww . We are currently living in a sort of Renaissance era for this dipole mode since it plays a crucial role in the study of skin and halo structures in nuclei with large proton-neutron asymmetry, which can be obtained with radioactive nuclear beams. There is in fact experimental evidence that in nuclei with neutron excess, in addition to the well-known giant dipole resonance, an accumulation of strength appears at low energies Leistenschneider:2001zz ; Ryezayeva:2002zz ; Hartmann:2004zz ; Adrich:2005zz ; Schwengner:2008rk ; Savran:2008zz ; Gibelin:2008zz ; Wieland:2009zz ; Tonchev:2010zz . The nature of this dipole resonance is an open problem. In light nuclei, several theoretical calculations seem to relate it to nonresonant independent single-particle excitations of loosely bound neutrons Paar:2007bk , but there are some experimental results, for example for the 26Ne Gibelin:2008zz , which disagree with this picture. In medium and heavy nuclei this excitation seems to be collective, according to several theoretical calculations Paar:2007bk , and it has been interpreted as a resonant oscillation of the neutron skin against the remaining isospin saturated neutron-proton core. It has been called pygmy dipole resonance (PDR). This denomination is often used to indicate this new collective mode, which in general exhausts a small fraction of the energy-weighted sum rule (EWSR). Sometimes, on the other hand, it is used in literature to generically indicate low-lying dipole excitations. The degree of collectivity and its evolution with the mass number is one of the most important open questions, but, as recently explained Paar:2010ww , several other open problems remain in connection with this low-energy dipole excitation. One of them is the isoscalar or isovector nature. Theoretically, it can be investigated by calculating the neutron and proton transition densities; experimentally, it can be investigated by inducing the same excitation through different processes including electromagnetic processes, such as (), () or Coulomb excitation, on one hand, and strong processes, such as () or ions collision, on the other hand. Another important problem is the energy location of this excitation with respect to the neutron threshold, in connection with the question of whether some part of the PDR low-energy tail might be missing. The evolution of the PDR with neutron-proton asymmetry as well as the existence of a connection between the PDR in stable and exotic nuclei are also of great interest.
Here, we investigate these problems by focusing on neon isotopes and isotones through a fully consistent axially-symmetric-deformed quasiparticle random phase approximation (QRPA) calculation based on Hartree-Fock-Bogolyubov (HFB) states. The same Gogny D1S effective force gog1 has been used both in HFB and QRPA, which ensures the consistency of the calculations. This approach is essential in open-shell nuclei, where pairing correlations play an important role. It also allows the treatment of other isotopic and isotonic chains far from the closed major shells of stable nuclei. It has already been employed to study giant resonances of silicon and magnesium isotopes Peru:2008gd and very recently the heavy deformed 238U u8 . Exotic spherical 78Ni, 100Sn, 132Sn, and 208Pb were previously studied in the corresponding spherical HF+RPA calculation Peru:2005di .
Some stellar phenomena, such as -process nucleosynthesis, are particularly sensitive to the low-energy tails of dipole responses Goriely:1998 . Theoretical microscopic studies of photoabsorption and radiative neutral capture cross sections Goriely:2002cx are essential in the regions of the nuclear chart where data are absent. All the models which pretend to be used in the whole nuclear chart without changing any parameters must be tested against the available experimental data. Also for this reason, after the calculations of Peru:2005di ; Peru:2008gd ; u8 we focus here on neon isotopes and isotones since experimental data on 26Ne are available Gibelin:2008zz and those on 24O will appear soon o24 . Work on 68Ni is also in progress due to the experimental interest in the nature of the PDR Matea in this nucleus Wieland:2009zz . In connection to this, an interesting article Carbone:2010az relating the PDR to the nuclear symmetry energy Klimkiewicz:2007zz and to the isospin-dependent components of effective nuclear interactions recently appeared.
Our paper is organized as follows: We present our model in Sec. II and our results in Sec. III. Our work is summarized in Sec. IV.
II Model
In this section, we briefly sketch our approach based on the QRPA on top of HFB calculations. Details of the formalism, as well as of 22-28Mg and 26-30Si dipole responses can be found in Peru:2008gd . The HFB equations are solved in a finite harmonic oscillator (HO) basis. As a consequence, the positive energy continuum is discretized. We have checked the stability of the single-particle levels with the number of major HO shells. Finally, according to Peru:2008gd , we considered a model space including 9 HO major shells. This is a large enough space for the neon isotopes and isotones considered here. To check it, we performed the calculation in a larger HO basis for 26Ne. For 10 and 11 major shells, we obtain the same results as for 9 major shells both for spurious and low-lying states. All HFB quasiparticle states are used to generate the 2-quasiparticle (2-qp) excitations. This means that no cut in energy or in occupation probabilities is introduced. As already emphasized, we use the same nucleon-nucleon effective force, the Gogny D1S gog1 , both for HFB and QRPA calculations in all particle-hole (ph), particle-particle (pp), and hole-hole (hh) channels. This is very important in order to avoid very dangerous inconsistencies. For this reason, since the Coulomb exchange field is not taken into account in HFB, the corresponding QRPA terms have been set to zero.
According to the symmetries imposed in the present axially-symmetric-deformed HFB calculations in even-even nuclei, the projection of the angular momentum on the symmetry axis and the parity are good quantum numbers. Consequently, QRPA calculations can be performed separately in each block. In an axially-symmetric-deformed nuclear system, the response function of a given contains different components. In spherical nuclei, all these components are degenerated in energy, and then the response functions associated to any multi-polarity can be obtained from results only. To solve the well-known (Q)RPA matrix equation
| (1) |
where are the energies of the QRPA excited states, we use the same numerical procedure recently applied to study the giant resonances of the heavy deformed 238U u8 . It is based on a massive parallel master-slave algorithm. For a single solution of Eq. (1) the QRPA provides the set of amplitudes and describing the wave function of the excited state in terms of the two quasiparticle excitations. Let us define as the number of all the possible 2-qp excitations for a given block. The well-known normalization of the QRPA amplitude can then be written as
| (2) |
From this equation, it is easy to isolate the relative neutron and proton contributions by summing separately over the two species. In the following, we indicate the corresponding percentage contribution with the notation and . In order to measure the degree of collectivity of a specific excited state, we consider, inspired by Co':2009gi , another index, called , which represents the number of states with . Also in this case we separate neutron () and proton () contributions. Note that in Ref. Co':2009gi RPA, instead of QRPA, calculations are performed. In this case, is replaced by , which represents the number of possible particle-hole excitations. The value in the RPA case (called here ) represents the number of states with . In this case, when the excitation is produced by a single particle-hole state while in an ideal collective case all the particle-hole excitations contribute with the same statistical weight so that . In the QRPA, the situation is a little different because 2-qp excitations imply the inclusion of hole-hole and particle-particle transitions. Anyway, as the values become greater, the response becomes more collective. Obviously, the quantity , as well as , is related to the size of the configuration space, which depends on the number of major oscillator shells one decides to consider and overall on the symmetry scheme (spherical, axially-symmetric-deformed,…) of the calculation. For this reason, a direct comparison of our results with the ones of Ref. Co':2009gi is not possible. In Sec. III.1, we perform a comparison between this kind of analysis in RPA and QRPA schemes. Note that even if for spherical nuclei the results obtained for are strictly equivalent to the ones obtained for , we choose to perform the analysis in the block. In this way, the number of the possible 2-qp configurations for all the nuclei we consider is always the same, precisely =4832 (half obviously being neutron-neutron 2-qp excitations and half proton-proton 2-qp excitations). Because we always consider the same number of possible 2-qp excitations, it is not necessary to introduce other indexes, such as the ratio .
III Results
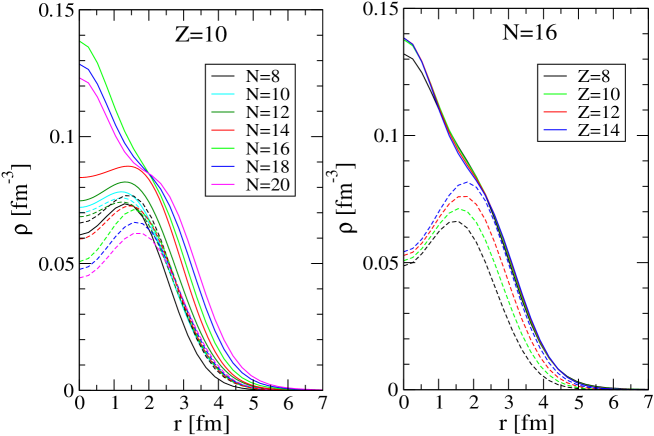
The ground-state properties of the considered nuclei are obtained by solving HFB equations. Axially symmetric HFB+D1S results for the whole nuclear chart can be found in Stephane . For deformation parameters, neutrons and protons root-mean-square radii, pairing and Fermi energies we refer the reader to this web site. In Fig. 1, we just plot the ground-state density profiles for the neon isotopes and isotones evaluated in this approach with 9 HO major shells. In the case of deformed nuclei, the drawn density is the spherical projected one, expressed as a function of the spherical coordinate. For spherical nuclei the spherical radius coincides with the radial distance () from the symmetry axis when the longitudinal position is or, equivalently, when . We observe in Fig. 1 the formation and increase of a neutron skin on the nuclear surface when the neutron-proton ratio increases. For 18Ne a proton skin appears.
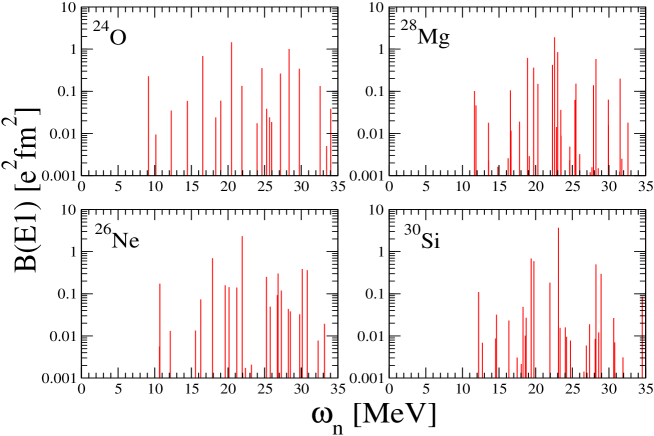
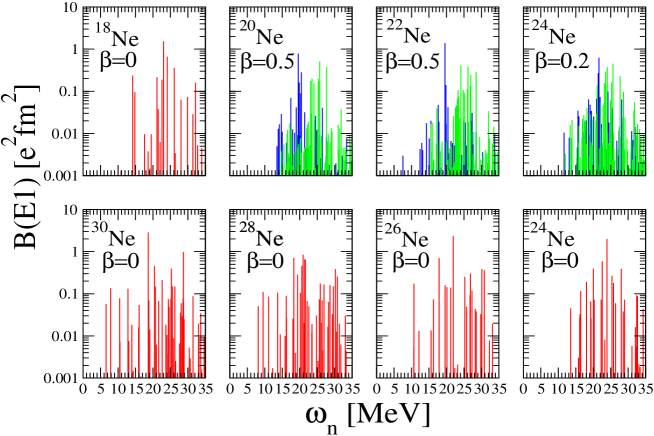
Figures 2 and 3 show the B(E1) distributions for isotones and neon isotopes respectively. All the isotones we consider are spherical, according also to prediction of subshell closure from stability to the neutron drip line Obertelli:2004qg . Also, the analyzed neon isotopes, except 20Ne (), 22Ne () and 24Ne (), turn out to be spherical. We write in each panel of Fig. 3 the axial deformation parameter corresponding to the minimum of HFB potential energy. For 24Ne the two minima at and are quasidegenerated and the spherical () configuration is just 100 keV less bound than the prolate one. For this reason, for 24Ne both the responses ( and ) are given in Fig. 3. In the spherical symmetry case, the =0- and =1- states are degenerate. In deformed 20Ne, 22Ne, and 24Ne nuclei the strength splits up into two components corresponding to two different angular momentum projections . As expected, since these nuclei are prolate, the GDR peak at low energy ( MeV) corresponds to the =0 components. The =1 GDR strength is concentrated around 25 MeV. For 20Ne and 22Ne nuclei, the MeV excitations are negligible. In all the other cases one or some peaks appear in this low-energy region. The giant resonance is located around 20-25 MeV.
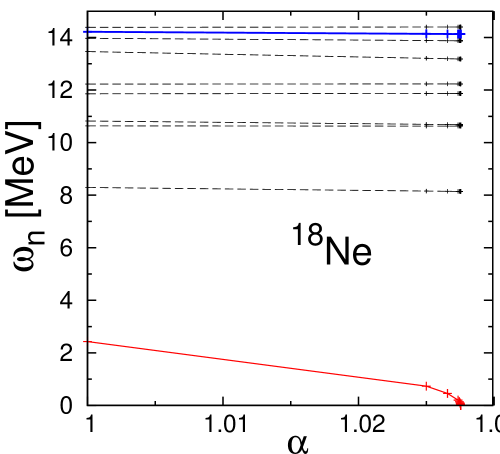
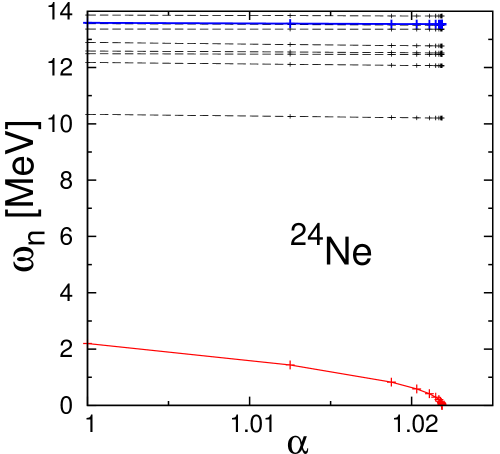
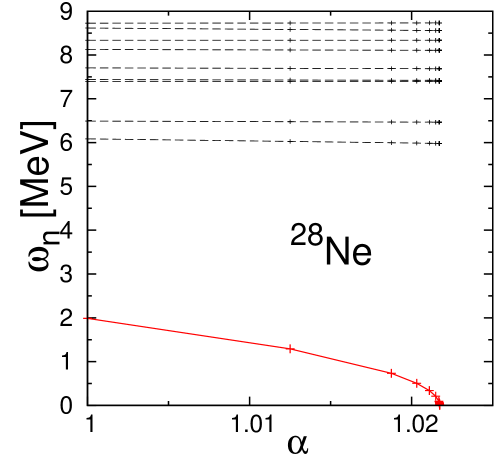
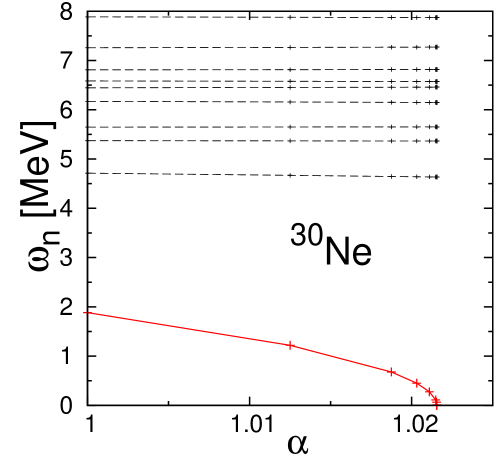
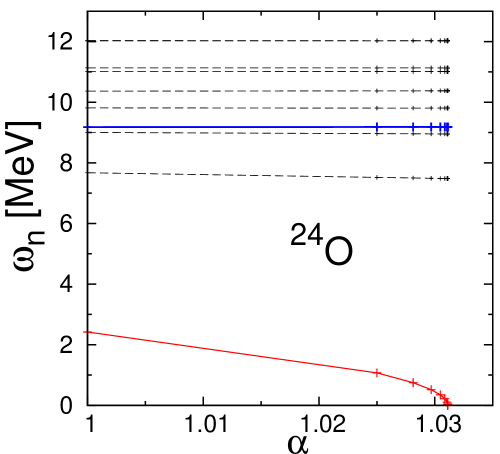
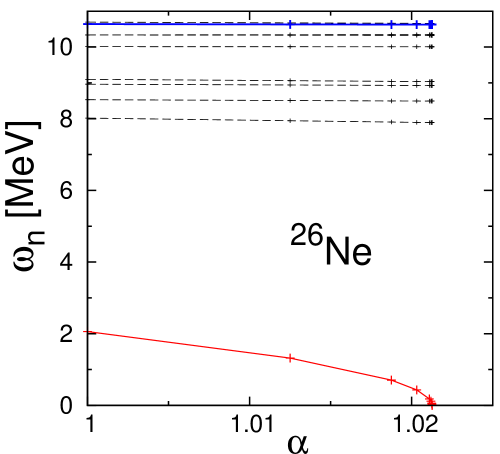
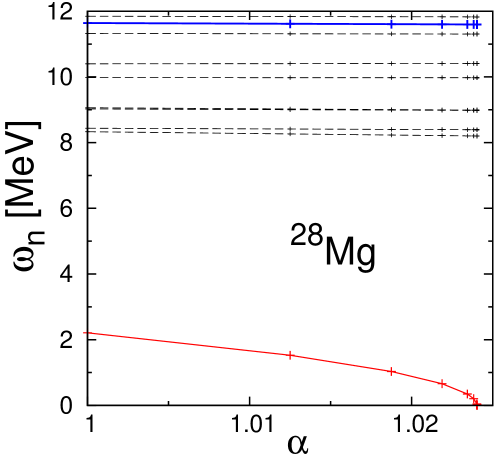
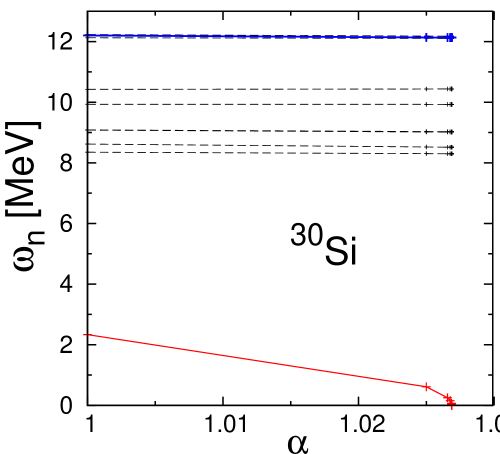
Each spectrum has been cleaned by removing the corresponding translation spurious state. In order to identify it, a small renormalization factor of the residual interaction has been introduced. Figure 4 shows the evolution of the first ten eigenvalues as a function of this parameter. As clearly shown, only the spurious state is affected by this factor while all the other states, including the ones corresponding to the low-energy peaks, stay quite constant. We checked also the stability of the B(E1) values with in the case of 26Ne, and the strengths of all states but the spurious one remain always the same. The spurious state, which turns out to be easily identifiable, is thus decoupled from the physical spectrum.
III.1 26Ne and isotones
We start our analysis from 26Ne, which belongs both to and chains. The low-energy dipole excitations of this nucleus have been experimentally studied Gibelin:2008zz . Several theoretical calculations on this nucleus have been already done Cao:2005bt ; Pena:2007 ; Peru:2007 ; Yoshida:2008rw ; Ebata:2010qr . In Table 1 we present a detailed analysis of the microscopic structure of the low-lying dipole modes in 26Ne (and in isotones) considering the first low-energy state. Instead to show the contribution of the main two quasiparticle excitations, we prefer to give the results in terms of the corresponding particle-hole (and particle-particle) transitions identified by the usual spectroscopic notation. The energies corresponding to each single-particle transition for each nucleus are the values given between parentheses in Table 1. Focusing at first on 26Ne, it appears that the state at MeV is dominated by the two quasiparticle excitations corresponding to the 2s1/22p3/2 transition. In terms of percentages this contribution turns out to be of 67.6 %, a value very close to the one of Yoshida:2008rw . According to Cao:2005bt , the second contribution (9.5 %) arises from the 2s1/22p1/2 excitation. Two-quasiparticle proton excitations are 8.1 %. An important feature of our results is an appreciable contribution (8.7 %) of the 1d5/21f7/2 configuration. The experimental results of Gibelin:2008zz seem to suggest that the low-lying dipole excitations around 6-10 MeV involve more transitions with respect to those only characterized by 2s states. As stressed in Gibelin:2008zz theoretical private calculations in the approach of Pena:2007 predict a nearly equal weight of 2s1/22p1/2 and 1d5/21f7/2 transitions in the low lying , which turns out to be dominant in this model. In connection with the experimental results of Gibelin:2008zz , also the structure of the second main peak, at MeV is interesting. It is mainly generated by the 1p1/21d3/2 (49.3 %), 1d5/21f7/2 (24.4 %) and 1d5/22p3/2 (14.42 MeV) (13.1 %) transitions.
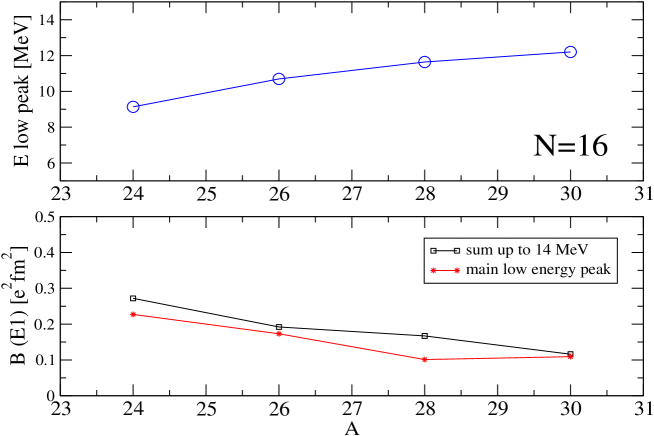
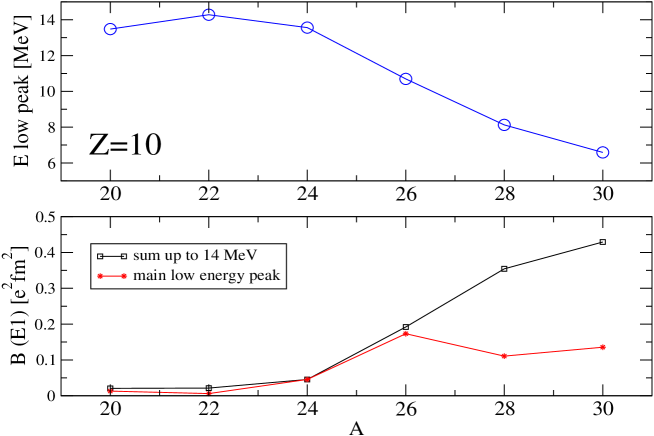
Concerning the isotones, the other nuclei we consider here are 24O, 28Mg, and 30Si. While the low-energy peak is expected in 24O, one can observe in Fig. 2 that an equivalent structure appears at MeV also for 28Mg and 30Si in spite of their small neutron-proton asymmetry. As expected and as shown in Fig. 5 the centroid energy of the low-lying E1 states increases with the decrease of neutron excess and the B(E1) value of the first peak is suppressed. On the other hand, the total strength up to 14 MeV decreases very slowly from 26Ne to 30Si.
Turning to the microscopic analysis of Table 1, one can observe that the structure of the first peak in 24O is quite similar to the one of 26Ne except for the absence in 24O of the 1d3/22p3/2 contribution, as expected for a particle-particle configuration in a closed-shell nucleus. This particle-particle transition turns out to be very important in 28Mg, being of the same order of magnitude as the main particle-hole transition 2s1/22p3/2. Finally, in 30Si the contribution of proton excitations becomes appreciable, being of the order of 30%. In the three other cases, the neutron contribution to the low energy peak is more than 90%. Even if a detailed study of the GDR region is beyond the aim of this paper we consider here and in the following the behavior of the main GDR peak in order to compare it with the one of low-lying states. For this reason in Table 1 the total proton and neutron contributions to the main GDR peak are reported. The difference with respect to the corresponding first peak clearly appears. It is interesting to observe that even in the GDR peak the neutron contribution is larger than the expected value in the cases of 24O and 28Mg nuclei. Note always from Table 1 that if instead of treating only the main GDR peak we consider the total proton and neutron contribution arising from all the states with 15 MeV 30 MeV and B(E1) 0.5 e2 fm2, the result is quite similar.
Further remarks about the collective behavior of the analyzed dipole excitations in these isotones arise from the calculation of the , and indexes defined in Sec. II and reported in Table 2 together with the isospin percent contributions and . Because we start the analysis from 24O, some comments are needed. The little values of numbers (even in the GDR case) with respect to must not be surprising. This apparent disproportion is related to the huge number , which is due to the choice of performing calculation in QRPA, including in this way not only the particle-hole transitions but also the particle-particle and the hole-hole ones without any cut in excitation energy. It is important to observe that in the corresponding spherical RPA calculation (which for 24O is strictly equivalent to the QRPA one) the number of possible particle-hole excitation is largely reduced (), increasing the relative importance of indexes, which in this case become =3 and =2 at =9.1 MeV and =7 and =3 at =20.5 MeV.
Coming back to the analysis of the QRPA results shown in Table 2, one can observe that the number of state which contribute with a weight greater than , as defined in Sec. II, lightly increases from 24O to 30Si both for low-energy mode and for the GDR. The index generally decreases with while increases. The number of configurations which contribute to the low energy mode is about the 60% of the configurations involved in the GDR. This value reduces to about 40% just in the 28Mg case. This apparently less collective behavior of the 11.6 MeV peak is compensated by the appearance of another quite close peak at 11.8 MeV, which is dominated by the 1d3/22p3/2 (62%) and the 2s1/22p3/2 (24%) transitions.
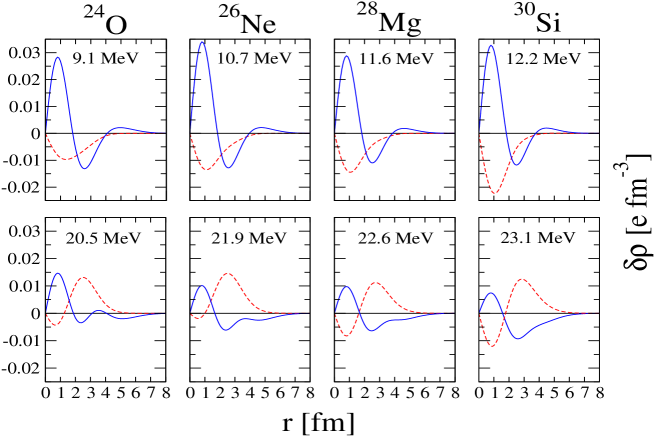
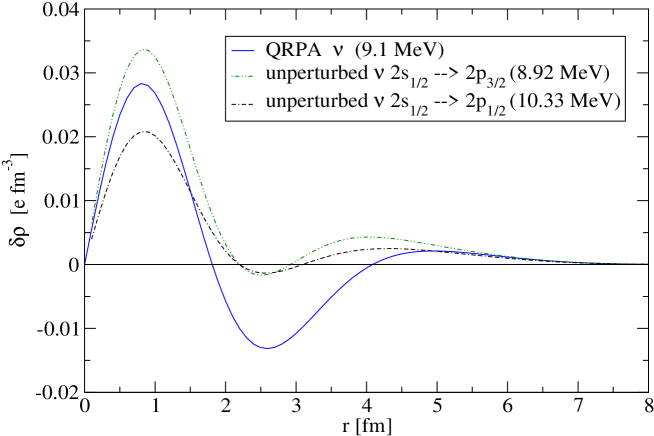
In Fig. 6 we display the neutron and proton transition densities for 26Ne and for the other isotones for the low-energy and the main GDR peaks. Note that since the nuclei we considered turn out to be spherical, even if we performed our calculation in cylindrical coordinates, we can and prefer to present the transition densities as a function of instead that as a function of and . The lower panels of Fig.6 refer to the main GDR peak. They display for all the isotones a radial dependence that is characteristic for the isovector GDR: The proton and neutron densities oscillate with opposite phases. The low-energy case, shown in the upper panel, is more complex but is quite similar in all the isotones. It presents an isovector character in the center of the nucleus (for fm) and an isoscalar one in the surface region ( 3 fm). For fm one can observe an oscillating finite contribution of the neutrons and a negligible one of the protons. The spatially extended structure of the 2s1/2 state is responsible for the shape of the neutron transition density. In order to illustrate this point we show in Fig. 7 the 24O neutron transition density for the state at 9.1 MeV, as already plotted in the first panel of Fig. 6, and the unperturbed transition densities for 2s1/22p3/2 (8.92 MeV) and 2s1/22p1/2 (10.33 MeV) excitations. It clearly appears that the behavior at the center of the nucleus is quite similar, reflecting the crucial role of the 2s1/2 state, while in the surface region the two unperturbed transition densities differ from the one obtained in QRPA, reflecting the important role of correlations in this region. For fm, the three transition densities turn to be similar.
The result obtained for the transition densities of the low-energy excitations of isotones does not coincide with the usual isoscalar representation of the PDR obtained in many theoretical calculations but for heavier nuclei Paar:2007bk . Transition densities of the low-lying dipole states in 26Ne can be found in Yoshida:2008rw and in Pena:2007 , while results for 24O are presented in Matsuo:2004pr and Co':2009gi where a phenomenological RPA is used. In Matsuo:2004pr , the isoscalar character of the excitation inside the nucleus clearly appears while the isovector behavior of the analyzed low energy excitation (however not the lowest one) in Co':2009gi is interpreted as the tail part of the GDR. At the moment, the results obtained for the transition densities of the low-lying dipole state in these nuclei seem to be model dependent, and the problem remains open.
To summarize, the low-lying dipole state of isotones possesses a small but finite collective nature. While the strength of this state increases with the neutron-to-proton ratio, the degree of collectivity stays quite constant. These considerations, as well as the study of the transition densities, suggest that some interesting low-energy properties can be experimentally obtained also from the less exotic 28Mg and 30Si nuclei.
III.2 Neon isotopes
The analysis of neon isotopes proceeds along the same lines. Figure 8 is the equivalent of Fig. 5 but for the instead of chain. Also in this case, the energy of the low-lying peak decreases with the isospin asymmetry and the B(E1) strength increases. As shown in the lower panel of Fig.8 by comparing the B(E1) value of the low-energy peak with the value obtained summing the B(E1) up to 14 MeV the fragmentation increases with the number of neutrons. It merges also from Fig. 3.
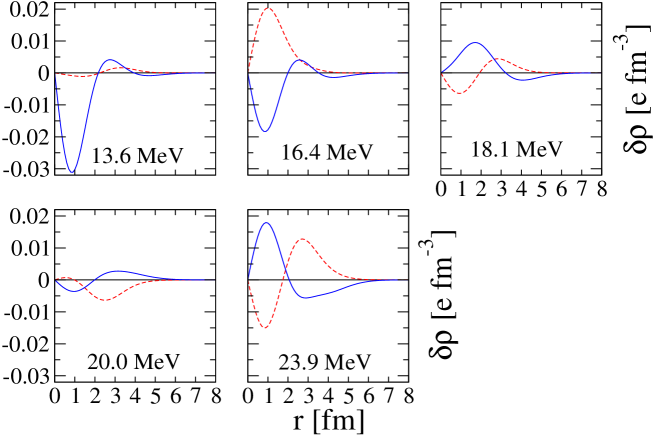
The lower mass isotope, which presents a non-negligible strength, is 24Ne, as recently found also in Ebata:2010qr . According to the HFB ground-state calculation Stephane , this nucleus turns out to be lightly deformed. Nevertheless, owing to the soft deformation with prolate () and oblate () configurations mostly degenerate, we prefer to consider 24Ne as spherical in our microscopic analysis. The comparison with other neon isotopes becomes in this way more easy and more consistent. Anyway, in Fig. 3 we reported the B(E1) results for 24Ne both in and cases. The deformed response is obviously more fragmented with the splitting of and components but the correspondences of low-energy and GDR excitations in and cases are evident. For example, focusing on the little low-energy excitation, one can observe that the single peak at =13.6 MeV with B(E1)=4.5 10-2 e2 fm2 in the spherical case is split, in the prolate case, in one peak for the component at =13.1 MeV with B(E1)=0.8 10-2 e2 fm2 and in three peaks at =13.4 MeV, =13.8 MeV and =13.9 MeV with B(E1)=1.6 10-2 e2 fm2, B(E1)=0.7 10-2 e2 fm2 and B(E1)=2.1 10-2 e2 fm2, respectively. Turning to the microscopic analysis in the spherical case, the peak at 13.6 MeV is mostly due (65.4%), as in 26Ne, to 2s1/22p3/2 (15.03 MeV) transition. In this case, the 2s1/22p1/2 (15.93 MeV) transition turns out to be more relevant (25.7%) with respect to 26Ne. Two other transitions, 1d3/22p1/2 (19.78 MeV) and 1p1/22s1/2 (16.14 MeV), are of the order of 2%. Each of the remaining ones contributes individually less than 1%. The transition densities of this state, shown in Fig. 9, are quite interesting revealing a neutron fluctuation larger than the proton one. The very small proton fluctuation is anyway in phase with the neutron one, reflecting the isoscalar nature of this resonance. In contrast, the transition densities corresponding to all the other remarkable peaks shown an evident isovector behavior typical of the GDR. Furthermore, as deduced from and indexes reported in Table 3, the excitation at 13.6 MeV involves principally neutron configurations and is little more collective than the successive one at 16.4 MeV.
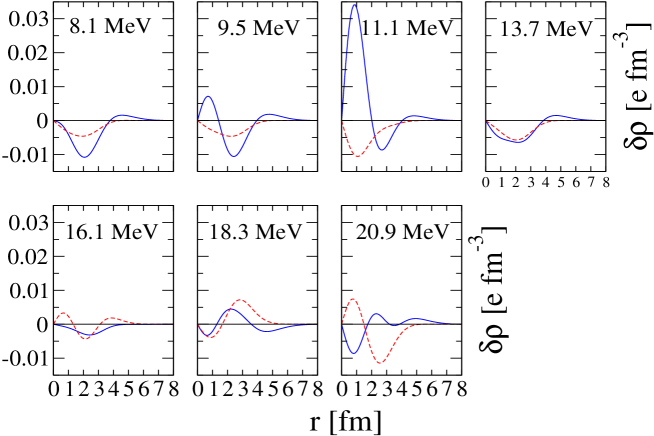
Since we have already discussed in the previous subsection 26Ne, we turn now to 28Ne. In this case, the dipole strength distribution is more fragmented. The first two peaks are essentially of single-particle nature. They are related to the transitions from the less bounded 1d3/2 neutron state: 1d3/22p3/2 (8.26 MeV) (90.4%) for the 8.1 MeV peak and 1d3/22p1/2 (10.00 MeV) (83.1%) for the second one at 9.5 MeV. The corresponding and indexes shown in Table 3 are lower with respect to the ones related to higher energy excitations. The state at 11.1 MeV corresponds to the low energy peak of 26Ne. The dominant component is the same, that is, 2s1/22p3/2 (10.82 MeV) (67.2%). The degree of collectivity is very similar, according to Table 3, as well as the neutron and proton transition densities illustrated in Fig. 10. The successive peak at 13.7 MeV is really interesting. As reported in Table 3, the number of 2-qp neutron excitations related to this state is appreciably greater than the one of the lower states and even of the successive high-energy state. In this 13.7 MeV peak, the transition from 1d3/2 neutron state turns to play a major role: 68.8 % from 1d3/21f5/2 (14.09 MeV). The prominent role of transitions from the weakly bound 1d3/2 neutron state is reflected in neutron densities, no more peaked at the interior of the nucleus as for the transitions involving the 2s1/2 state. The isoscalar behavior of the state dominated by these 1d3/2 transitions is also evident.
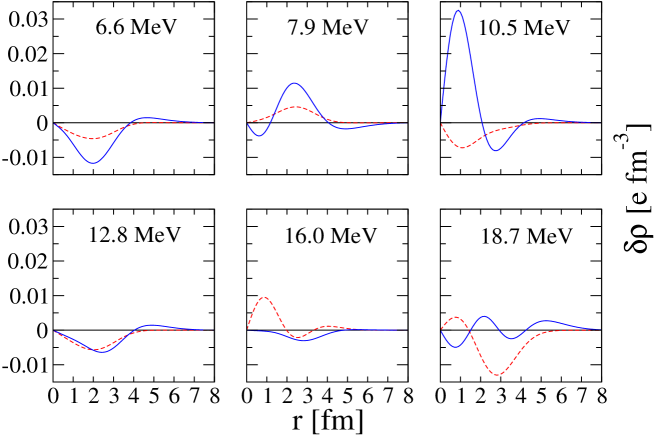
Results obtained for 30Ne are very similar to those for 28Ne concerning both the microscopical analysis and the transition densities shown in Fig. 11. The first two peaks are still less collective: 93.5% from 1d3/22p3/2 (6.57 MeV) in the first peak at 6.6 MeV and 89.9% from 1d3/22p1/2 (8.09 MeV) in the second one at 7.9 MeV. The respective and indexes are lower than the corresponding ones in 28Ne. The third peak at 10.5 MeV corresponds again to the low-energy peak of 26Ne with again a similar microscopical structure: it is dominated (67.4%) by the 2s1/22p3/2 (10.20 MeV) transition. This peak is characterized by the same 2-qp configurations and the same transition densities as the isotones and the neon isotopes 26Ne and 28Ne. According to the value of it seems to be little more collective with respect to the corresponding excitation in the other nuclei. In the fourth peak at 12.8 MeV the main transition 1d3/21f5/2 (12.08 MeV) (54.3 %) is more mixed to the 1d5/21f7/2 (12.87 MeV) (18.6 %) one. As in 28Ne, this fourth peak is again the more collective state with the typical isoscalar behavior of the transition densities. The features of this fourth peak of 28Ne and 30Ne are more in touch with the standard representation of the PDR.
III.3 Proton electric dipole resonance in 18Ne
As can be observed in Fig. 1, the 18Ne exhibits a proton skin in spite of the presence of the Coulomb barrier. It is interesting to investigate if in this case a low-energy proton electric dipole resonance appears, paying attention to its degree of collectivity. Until now, only a few studies of dipole excitations in proton-rich nuclei have been done. In a work based on relativistic QRPA on isotopes and isotones Paar:2005fb , it has been shown that proton pygmy dipole resonances may appear when approaching the proton drip line. Here we focus on the 18Ne case. In this nucleus the proton Fermi level is 1d5/2. In the conditions of our HFB ground-state calculations (9 HO major shells, absence of Coulomb exchange field) the occupation probability of this level is =0.32 while the corresponding single particle energy is 2.14 MeV. The root-mean-square radius calculated for this orbital is = 3.40 fm, to be compared to the total proton root-mean-square radius = 2.84 fm.
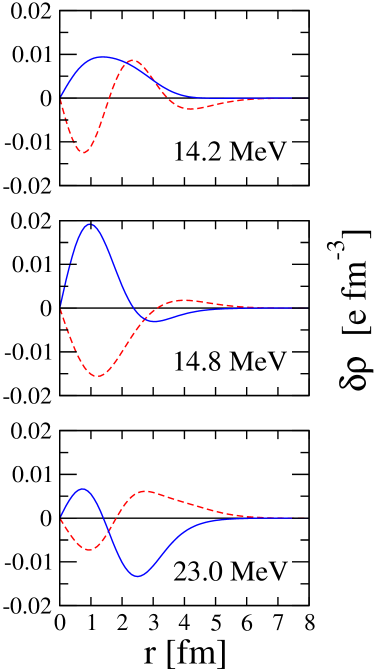
Turning to the excited states, the first panel of Fig. 3 shows the 18Ne B(E1) distribution which is dominated by the GDR around 23 MeV. On the other hand, two distinct peaks appear below 15 MeV. Their microscopical structures are given in Table 4. The first peak at 14.2 MeV is essentially due to proton excitations. The dominant configurations correspond to transitions from the weakly bound proton state 1d5/2. Contributions of 10% order of magnitude arise from transitions from 1p1/2, 2s1/2 and 1p3/2 proton states. The total neutron contribution is less than 8%. The situation is different for the second low-energy peak, located at 14.8 MeV, which is mainly due to neutron and proton 1p1/2 2s1/2 transitions. The behavior of the first peak, characterized by a superposition of many 2-qp proton configurations, is specular with respect to one of the other neon isotopes and isotones: Only the roles of neutron and proton are obviously inverted. This clearly appears also by looking at the transition densities of Fig. 12: In this case, the proton and neutron are in opposite phase in the nuclear interior and in phase in the surface region, where the proton contribution is larger than the neutron one. On the other hand, the 14.8 MeV excited state already displays a pronounced isovector behavior as the GDR here appearing around 23 MeV. It is also very important to observe that the degree of collectivity of the first low energy state is the same as the one of the GDR since the values (shown in Table 3) are the same. The value is greater for the first low-energy peak revealing once again the dominant role of protons in this state. The correspondence between the results obtained for the low-lying excitation of this proton-rich nucleus and the neutron-rich nuclei here analyzed suggests that systematic studies of proton-rich nuclei in this mass region should be performed.
IV Summary and conclusions
We have studied the dipole excitations of neon isotopes and isotones focusing in particular on the low-excitation-energy region. We performed a fully consistent axially-symmetric-deformed HFB+QRPA calculation using the D1S Gogny nucleon-nucleon effective force. For the isotones we considered, we obtained excitation modes between 9 and 12 MeV. All these modes presented a small but finite collective behavior: also other transitions with respect to the dominant 2s1/22p3/2 contribute to generate the low-lying resonance. On the other hand, the spatial structure of the less-bound neutron state, that is, the 2s1/2, is the main responsible of the neutron transition density and this is reflected in the nontrivial macroscopic isoscalar or isovector behavior of the low energy resonance. It holds also for the neon isotopes where the behavior of the transition densities is essentially due to spatial structure of the main hole state contributing to the particle-hole transitions. Furthermore, also for the neon isotopes, we found that the strength of the low-energy state increases with the neutron-to-proton ratio. By increasing the number of neutrons the dipole strength distribution becomes more fragmented. In 28Ne and 30Ne the occupation of the 1d3/2 shell leads to the appearance of another state just above the one corresponding to the excitation belonging to all the nuclei analyzed. This state is more collective and it is characterized by an isoscalar behavior of the transition densities, revealing features that are more in touch with the standard representation of the PDR characterizing heavier nuclei.
Finally, for the proton-rich 18Ne, we obtained a low-energy resonance at 14.2 MeV whose transition density behavior is quite similar to the one of the low-lying excitation of isotones once the role of neutrons and protons is inverted. The degree of collectivity of this state is the same as the one of the main GDR peak of this nucleus.
References
- (1) W. Bothe, and W. Gentner, Z. Phys. 71, 236 (1937).
- (2) M.N. Harakeh, A. van der Woude, Giant Resonances: Fundamental High-Frequency Modes of Nuclear Excitation (Oxford University Press, Oxford, 2001).
- (3) A. Leistenschneider et al., Phys. Rev. Lett. 86, 5442 (2001).
- (4) N. Ryezayeva et al., Phys. Rev. Lett. 89, 272502 (2002).
- (5) T. Hartmann, M. Babilon, S. Kamerdzhiev, E. Litvinova, D. Savran, S. Volz and A. Zilges, Phys. Rev. Lett. 93, 192501 (2004).
- (6) P. Adrich et al., Phys. Rev. Lett. 95, 132501 (2005).
- (7) R. Schwengner et al., Phys. Rev. C 78, 064314 (2008).
- (8) D. Savran et al., Phys. Rev. Lett. 100, 232501 (2008).
- (9) J. Gibelin et al., Phys. Rev. Lett. 101, 212503 (2008).
- (10) O. Wieland et al., Phys. Rev. Lett. 102, 092502 (2009).
- (11) A. P. Tonchev et al., Phys. Rev. Lett. 104, 072501 (2010).
- (12) N. Paar, D. Vretenar, E. Khan and G. Colo, Rept. Prog. Phys. 70, 691 (2007).
- (13) N. Paar, J. Phys. G 37, 064014 (2010).
- (14) J. Dechargé and D. Gogny, Phys. Rev. C 21, 1568 (1980). J.F. Berger, M. Girod, and D. Gogny, Comp. Phys. Comm. 63, 365 (1991).
- (15) S. Péru and H. Goutte, Phys. Rev. C 77, 044313 (2008).
- (16) S. Péru, G. Gosselin, M. Martini, M. Dupuis, S. Hilaire and J.-C. Devaux, Phys. Rev. C 83, 014314 (2011).
- (17) S. Péru, J. F. Berger and P. F. Bortignon, Eur. Phys. J. A 26, 25 (2005).
- (18) S. Goriely, Phys. Lett. B 436, 10 (1998).
- (19) S. Goriely and E. Khan, Nucl. Phys. A 706, 217 (2002).
- (20) V. Lapoux and H. Otsu, RIKEN NP0802-RIBF 57; H. Baba, RIKEN NP0802-RIBF 56.
- (21) I. Matea, E611 - GANIL-PAC, March 2010, accepted proposal.
- (22) A. Carbone, G. Colo, A. Bracco, L. G. Cao, P. F. Bortignon, F. Camera and O. Wieland, Phys. Rev. C 81, 041301 (2010).
- (23) A. Klimkiewicz et al., Phys. Rev. C 76, 051603 (2007).
- (24) G. Co’, V. De Donno, C. Maieron, M. Anguiano and A. M. Lallena, Phys. Rev. C 80, 014308 (2009).
- (25) http://www-phynu.cea.fr/HFB-Gogny_eng.htm
- (26) A. Obertelli, S. Peru, J. P. Delaroche, A. Gillibert, M. Girod and H. Goutte, Phys. Rev. C 71, 024304 (2005).
- (27) L. G. Cao and Z. Y. Ma, Phys. Rev. C 71, 034305 (2005).
- (28) D. Pena Arteaga, P. Ring, Prog. Part. Nucl. Phys. 59, 314 (2007).
- (29) S. Péru, H. Goutte, J. F. Berger Nucl. Phys. A 788, 44c (2007).
- (30) K. Yoshida and N. Van Giai, Phys. Rev. C 78, 014305 (2008).
- (31) S. Ebata, T. Nakatsukasa, T. Inakura, K. Yoshida, Y. Hashimoto and K. Yabana, Phys. Rev. C 82, 034306 (2010).
- (32) M. Matsuo, K. Mizuyama and Y. Serizawa, Phys. Rev. C 71, 064326 (2005).
- (33) N. Paar, D. Vretenar and P. Ring, Phys. Rev. Lett. 94, 182501 (2005).
| 24O | 26Ne | 28Mg | 30Si | |
| First peak | =9.1 MeV | =10.7 MeV | =11.6 MeV | =12.2 MeV |
| 2s1/22p3/2 | 73.5 % (8.92 MeV) | 67.6 % (10.52 MeV) | 39.7 % (11.68 MeV) | 43.8 % (12.61 MeV) |
| 1d3/22p3/2 | 0.0 % (9.26 MeV) | 2.8 % (10.82 MeV) | 32.7 % (11.93 MeV) | 7.0 % (12.79 MeV) |
| 2s1/22p1/2 | 10.0 % (10.33 MeV) | 9.5 % (12.44 MeV) | 5.8 % (13.98 MeV) | 6.6 % (15.23 MeV) |
| 1d5/21f7/2 | 8.7 % (12.87 MeV) | 8.7 % (13.68 MeV) | 8.2 % (14.18 MeV) | 11.1 % (14.55 MeV) |
| 1d3/22p1/2 | 0.0 % (10.67 MeV) | 0.1 % (12.74 MeV) | 2.7 % (14.22 MeV) | 1.1 % (15.41 MeV) |
| 1p1/21d3/2 | 1.2 % (17.70 MeV) | 1.1 % (18.50 MeV) | 0.5 % (19.10 MeV) | 0.3 % (19.60 MeV) |
| total contribution | 94.6 % | 91.9 % | 90.6 % | 70.9 % |
| 1p1/22s1/2 | 2.0 % (15.19 MeV) | 4.1 % (15.97 MeV) | 5.6 % (16.22 MeV) | 18.5 % (15.92 MeV) |
| p3/2 1d5/2 | 2.7 % (15.89 MeV) | 2.0 % (17.60 MeV) | 0.8 % (18.97 MeV) | 0.9 % (17.15 MeV) |
| (1p3/2 1d5/2) | (1p3/2 1d5/2) | (1p3/2 1d5/2) | (1d5/22p3/2) | |
| 1d5/21f7/2 | 0.0 % (24.80 MeV) | 0.9 % (17.48 MeV) | 1.9 % (16.02 MeV) | 7.7 % (14.33 MeV) |
| total contribution | 5.4 % | 8.1 % | 9.4 % | 29.1 % |
| Main peak (GDR) | =20.5 MeV | =21.9 MeV | =22.6 MeV | =23.1 MeV |
| total contribution | 80.5 % | 64.5 % | 78.5 % | 54.4 % |
| total contribution | 19.5 % | 35.5 % | 21.5 % | 45.6 % |
| Peaks with | B(E1) 0.5 e2 fm2 | and 15 MeV | 30 MeV | |
| total contribution | 81.6 % | 78.0 % | 82.9 % | 52.7 % |
| total contribution | 18.4 % | 22.0 % | 17.1 % | 47.3 % |
| 66.7 % | 61.5 % | 57.1 % | 53.3 % |
| (MeV) | %() | % () | |||
|---|---|---|---|---|---|
| 24O | |||||
| 9.1 | 44 | 34 | 10 | 94.6 % | 5.4 % |
| 20.5 | 74 | 62 | 12 | 80.5 % | 19.5 % |
| 26Ne | |||||
| 10.7 | 48 | 30 | 18 | 91.9 % | 8.1 % |
| 21.9 | 82 | 56 | 26 | 64.5 % | 35.5 % |
| 28Mg | |||||
| 11.6 | 46 | 24 | 22 | 90.6 % | 9.4 % |
| 22.6 | 114 | 82 | 32 | 78.5 % | 21.5 % |
| 30Si | |||||
| 12.2 | 54 | 32 | 22 | 70.9 % | 29.1 % |
| 23.1 | 88 | 54 | 34 | 54.4 % | 45.6 % |
| (MeV) | %() | %() | |||
|---|---|---|---|---|---|
| 18Ne | |||||
| 14.2 | 72 | 12 | 60 | 7.8 % | 92.2 % |
| 14.8 | 46 | 10 | 36 | 44.3 % | 55.7 % |
| 23.0 | 72 | 16 | 56 | 21.9 % | 78.1 % |
| 24Ne | |||||
| 13.6 | 52 | 44 | 8 | 97.7 % | 2.3 % |
| 16.4 | 48 | 32 | 16 | 55.1 % | 44.9 % |
| 23.9 | 84 | 60 | 24 | 65.0 % | 35.0 % |
| 26Ne | |||||
| 10.7 | 48 | 30 | 18 | 91.9 % | 8.1 % |
| 21.9 | 82 | 56 | 26 | 65.5 % | 35.5 % |
| 28Ne | |||||
| 8.1 | 36 | 24 | 12 | 98.7 % | 1.3 % |
| 9.5 | 40 | 26 | 14 | 98.4 % | 1.6 % |
| 11.1 | 46 | 30 | 16 | 95.2 % | 4.8 % |
| 13.7 | 86 | 72 | 14 | 97.1 % | 2.9 % |
| 16.1 | 78 | 32 | 46 | 5.0 % | 95.0 % |
| 18.3 | 102 | 76 | 26 | 91.5 % | 8.5 % |
| 20.9 | 124 | 92 | 32 | 70.2 % | 29.8 % |
| 30Ne | |||||
| 6.6 | 28 | 18 | 10 | 98.9 % | 1.1 % |
| 7.9 | 34 | 20 | 14 | 98.9 % | 1.1 % |
| 10.5 | 56 | 40 | 16 | 96.9 % | 3.1 % |
| 12.8 | 80 | 64 | 16 | 97.0 % | 3.0 % |
| 16.0 | 68 | 26 | 42 | 3.2 % | 96.8 % |
| 18.7 | 142 | 98 | 44 | 68.3 % | 31.7 % |
| First low-energy peak | Second low-energy peak | Main peak (GDR) | |
| =14.2 MeV | =14.8 MeV | =23.0 MeV | |
| 1d5/21f7/2 (15.99 MeV) | 29.1 % | 1.6 % | |
| 1d5/22p3/2 (15.98 MeV) | 23.2 % | 6.3 % | |
| 1p1/22s1/2 (13.75 MeV) | 11.7 % | 35.2 % | |
| 2s1/22p3/2 (18.19 MeV) | 9.3 % | 1.2% | |
| 1p3/21d5/2 (16.95 MeV) | 8.5 % | 9.3 % | |
| 2s1/22p3/2 (19.14 MeV) | 2.7 % | 0.5% | |
| total contribution | 92.2 % | 55.7 % | 78.1 % |
| 1p3/21d3/2 (15.78 MeV) | 3.8 % | 2.7 % | |
| 1p1/2 2s1/2 (14.18 MeV) | 3.6 % | 41.0 % | |
| total contribution | 7.8 % | 44.3 % | 21.9 % |