The properties of the T8.5p dwarf Ross 458C
Abstract
We present near-infrared photometry and spectroscopy, and warm-Spitzer IRAC photometry of the young very cool T dwarf Ross 458C, which we have typed as T8.5p. By applying the fiducial age constraints (Gyr) imposed by the properties of the active M dwarf Ross 458A, we have used these data to determine that Ross 458C has K, and an inferred mass of 5–20 MJup. We have compared fits of the near-infrared spectrum and IRAC photometry to the BT Settl and Saumon & Marley model grids, and have found that both sets provide best fits that are consistent with our derived properties, whilst the former provide a marginally closer match to the data for all scenarios explored here. The main difference between the model grids arises in the 4.5 region, where the BT Settl models are able to better predict the flux through the IRAC filter, suggesting that non-equilibrium effects on the CO-CO2 ratio are important for shaping the mid-infrared spectra of very cool T dwarfs. We have also revisited the issue of dust opacity in the spectra of Ross 458C that was raised by Burgasser et al (2010). We have found that the BT Settl models which also incorporate a condensate cloud model, provide a better match to the near-infrared spectrum of this target than the Saumon & Marley model with , and we briefly discuss the influence of condensate clouds on T dwarf spectra.
keywords:
surveys - stars: low-mass, brown dwarfs1 Introduction
Precise determination of the fundamental properties (i.e. mass, age, metallicity and effective temperature, ) of isolated field brown dwarfs poses some serious challenges. These principally arise because (a) brown dwarfs cool over time, and (b) ages are one of the most difficult parameters to measure for field stars and brown dwarfs. Together this makes breaking the degeneracies between age, mass, luminosity and effective temperature for isolated brown dwarfs extremely difficult. An object with K, for example, might be relatively young and low-mass ( e.g. 500 Myr and 20MJup), or it could equally be older and higher-mass (e.g. 10 Gyr and 60MJup). Furthermore, determination of for such objects is itself problematic due to the fact that the radii of brown dwarfs must be estimated using evolutionary models (e.g. Baraffe et al. 2003; Saumon & Marley 2008) which to date have yet to be constrained by direct measurement of field brown dwarf radii111Although radii for a handful of brown dwarfs in cataclysmic variable (e.g. Littlefair et al. 2007) and young eclipsing systems (e.g. Stassun et al. 2006) have been measured these objects are not representative of the field population. . The lack of age constraints for isolated brown dwarfs makes such estimates particularly uncertain. The influence of metallicity on the emergent spectra from brown dwarfs further complicates matters, and so the calibration of model spectra using systems with well understood age and metallicity constraints is key to improving our understanding of sub-stellar atmospheres. For these reasons, much effort has been expended identifying and characterising systems for which dynamical masses may be measured (e.g. Scholz et al. 2003; Dupuy et al. 2009; King et al. 2010, and references therein) or age and metallicity fiducially constrained (e.g. Pinfield et al. 2006; Burningham et al. 2009; Day-Jones et al. 2008, 2010; Zhang et al. 2010).
Goldman et al. (2010) report the discovery of one such age and metallicity benchmark system, a candidate T8+ dwarf identified in the UKIRT Infrared Deep Sky Survey (UKIDSS; Lawrence et al. 2007) that has been shown to be a common proper motion companion to the M0.5+M7 binary system Ross 458AB. Using gyrochronology arguments and the age-activity relations of West et al. (2008), Goldman et al. (2010) constrain the age of Ross 458AB to less than 1Gyr. They also highlight its possible membership of the Hyades moving group, although conflicting radial velocity measurements by Hawley et al. (1997) and Nidever et al. (2002) leave this in doubt. However, given the spread in age and metallicity seen for members of the Hyades moving group, it is not immediately clear that such membership would permit any tighter constraints to be placed on the properties of the Ross 458 system than are possible otherwise. Burgasser et al. (2010) used the /metallicity and /metallicity relations of Johnson & Apps (2009) and Schlaufman & Laughlin (2010) to estimate metallicities of [M/H] and for the Ross 458 system. The young ( 1 Gyr) age of the system, though, means that it is not immediately clear that such relations can be applied with confidence. We return to this point at the end of Section 3.2.
The first estimate of Ross 458C’s spectral type was made through deep methane imaging by Goldman et al. (2010). It was subsequently and independently identified as part of an ongoing large program to identify the coolest T dwarfs in the UKIDSS Large Area Survey (LAS) (e.g. Lodieu et al. 2007; Pinfield et al. 2008; Burningham et al. 2008, 2009, 2010a). As part of that program we have obtained near-infrared spectroscopy, as well as additional near-infrared and warm-Spitzer photometry which we use here to estimate the properties for this object.
Recently, Burgasser et al. (2010) has presented spectroscopy of Ross 458C deriving a spectral type of T8. They also compared their spectroscopy to a number of Saumon et al. (2006, 2007) model spectra to derive properties. They found that model spectra with significant condensate opacity provided a better match to their data than cloudless models. In Section 3.2 we compare our data to models from the Saumon & Marley grid, and also to the latest BT Settl model grid, which also includes a condensate cloud model (Allard et al. 2010).
2 New observations of Ross 458C
2.1 Near-infrared photometry
Near-infrared follow-up photometry was obtained using the Wide Field CAMera (WFCAM; Casali et al. 2007) on UKIRT on the night of 17th June 2009, and the data were processed using the WFCAM science pipeline by the Cambridge Astronomical Surveys Unit (CASU) (Irwin et al. 2004), and archived at the WFCAM Science Archive (WSA; Hambly et al. 2008). Observations consisted of a three point jitter pattern in the and bands, and five point jitter patterns in the and bands repeated twice. All data were acquired with 2x2 microstepping and individual exposures of 10 seconds resulting in total integration times of 120 seconds in and and 400 seconds in and . The WFCAM filters are on the Mauna Kea Observatories (MKO) photometric system (Tokunaga et al. 2002).
The resulting photometry is given in Table 1. It should be noted that the follow-up WFCAM data are generally in good agreement with the survey data, with the exception of the band, for which there is a 9 disagreement. The origin of this discrepancy is not clear.
2.2 Warm-Spitzer photometry
Data were obtained for Ross 458C on 13th March 2010, via the Cycle 6 GO program 60093. Individual frame times were 30 seconds repeated three times, with a 16-position spiral dither pattern, for a total integration time of 24 minutes in each of the [3.6] and [4.5] bands. The post-basic-calibrated-data (pbcd) mosaics generated by version 18.14.0 of the Spitzer pipeline were used to to obtain aperture photometry. The photometry was derived using a 7 aperture, and the aperture correction was taken from the IRAC handbook222http://ssc.spitzer.caltech.edu/irac/dh/. The error is estimated by the larger of either the variation with sky aperture, or the error implied by the uncertainty images. This error is small (Table 1) and is dominated by the 3% error that should be added in quadrature to the quoted random errors to account for systematic effects due to calibration uncertainties and pipeline dependencies.
| [3.5] | [4.5] |
|---|---|
| - | [3.5]–[4.5] | ||||
|---|---|---|---|---|---|
2.3 Near-infrared spectroscopy
We used and grisms in the InfraRed Camera and Spectrograph (IRCS; Kobayashi et al. 2000) on the Subaru telescope on Mauna Kea to obtain a R and spectra for Ross 458C on 7th May 2009 and 31st December 2009 respectively. The observations were made up of a set of four 300s sub-exposures for the spectrum and six 240s sub-exposures (obtained in an ABBA jitter pattern to facilitate background subtraction), with a slit width of 0.6 arcsec delivering a resolution of R100. In addition we obtained a deep band spectrum using the Near InfraRed Imager and Spectrometer (NIRI; Hodapp et al. 2003) on the Gemini North Telescope333under program GN-2009B-Q-62. The NIRI observations were made up of twelve 300s sub-exposures observed in an ABBA jitter, with a 1 arcsecond slit delivering a resolution of R500.
The spectra were extracted using standard IRAF packages. The AB pairs were subtracted using generic IRAF tools, and median stacked. In the case of IRCS, the data were found to be sufficiently uniform in the spatial axis for flat-fielding to be neglected. We used a comparison argon arc frame to obtain the dispersion solution, which was then applied to the pixel coordinates in the dispersion direction on the images. The resulting wavelength-calibrated subtracted pairs had a low-level of residual sky emission removed by fitting and subtracting this emission with a set of polynomial functions fit to each pixel row perpendicular to the dispersion direction, and considering pixel data on either side of the target spectrum only. The spectra were then extracted using a linear aperture, and cosmic rays and bad pixels removed using a sigma-clipping algorithm.
Telluric correction was achieved by dividing each extracted target spectrum by that of an F5 star, observed just before or after the target and at a similar airmass. Prior to division, hydrogen lines were removed from the standard star spectrum by interpolating the stellar continuum. Relative flux calibration was then achieved by multiplying through by a blackbody spectrum of the appropriate .
The IRCS and spectra were joined by scaling them to match at the band peak (at 1.58). The higher signal-to-noise NIRI band spectrum was then used to replace the band region of the IRCS spectra, again by scaling it to match the IRCS spectrum at 1.58. We note here that the NIRI spectrum closely traced the shape of the noisier IRCS spectra in this region.
2.4 Spectral type
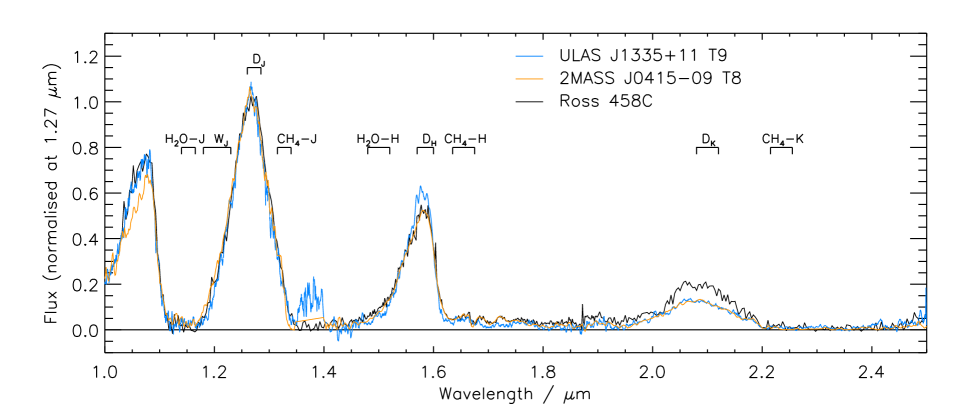
We have assigned a spectral type for Ross 458C following the scheme laid out by Burgasser et al. (2006) and extended by Burningham et al. (2008). Figure 1 shows our combined IRCS+NIRI spectrum for Ross 458C along with spectra for the T8 and T9 templates 2MASS J04151954–093506.6 and ULAS J133553.45+113005.2. Whilst the spectrum of Ross 458C lies roughly between the T8 and T9 spectra in the band, it appears to be earlier in type in the H2O– region, and there is considerable excess flux in the band.
The spectral flux ratios for Ross 458C are given in Table 2. Their values reflect the qualitative comparison with the spectral templates described above. The mismatch in inferred spectral type between the three indices that are not degenerate (, H2O–, CH4–) makes assigning a spectral type for this object problematic. The remaining index values are all consistent with a type later than T7, in disagreement with the H2O– and CH4– indices but in agreement with the index. We thus allow the index to dominate the classification, and assign a type of T8.5p (), reflecting the close agreement between the T8 and T9 spectra in the band, and highlighting the peculiarity of the spectrum elsewhere.
This spectral type is consistent with that estimated for Ross 458C from methane imaging (T8.9, Goldman et al. 2010), and also that found by Burgasser et al. (2010). However, it disagrees with the type of T7 found by Scholz (2010) using a combination of colour-colour plots and absolute magnitude arguments. This is driven by the weight Scholz (2010) places on the estimates from / colour-colour plots, which suggest an early type of T4.0–T6.5. Since the colours of Ross 458C are fairly typical of other T8+ dwarfs discovered to date, it would appear that such plots have little utility in spectral typing the latest type T dwarfs.
The disagreement between the index and the H2O– index that is seen in Ross 458C is broadly consistent with the unusual spectral morphology referred to as “H2O–-early” peculiarity by Burningham et al. (2010b). In addition to Ross 458C, two other T7 dwarfs have been identified that display this peculiarity: the T8p dwarf ULAS J101721.40+011817.9 (Burningham et al. 2008) and the T7p dwarf Gl 229B (Nakajima et al. 1995; Burgasser et al. 2006). Several earlier type T dwarfs have also been identified with this peculiarity and are described in Burningham et al. (2010b).
It is interesting to note that both Gl 229B and ULAS J1017+0118 have inferred ages similar to that for Ross 458C, the former implied by the activity of its M0.5 primary star (e.g. West et al. 2008) and the latter by comparison of near- and mid-infrared photometry to model predictions (Leggett et al. 2010). However, interpretation of the H2O– early peculiarity as being directly connected to the relative youth of these systems is probably premature, particularly in light of the recent observation that amongst the ealier-type objects that display this morphology described in Burningham et al. (2010b), one has emerged to exhibit halo kinematics (Murray et al. in prep).
| Index | Ratio | Value | Type |
|---|---|---|---|
| H2O-J | T8 | ||
| CH4-J | T8 | ||
| T8/9 | |||
| H2O- | T7 | ||
| CH4- | T8 | ||
| NH3- | … | ||
| CH4-K | T5 |
3 The properties of Ross 458C
3.1 Luminosity and effective temperature
We estimate the bolometric flux () of Ross 458C following the method outlined in Burningham et al. (2009), by combining our spectra (flux calibrated by our WFCAM follow-up photometry) with model spectra (to allow us to estimate the flux contributions from regions outside our near-infrared spectral coverage). We have scaled the region of the models to match the flux level in our spectrum, whilst we have used the warm-Spitzer channel 1 and 2 photometry to scale the 2.5–4.0 and regions respectively. To provide some indication of the systematic effects of our choice of atmospheric models we have estimated the bolometric flux using both BT Settl models (Allard et al. 2008) and those of Saumon et al. (2006, 2007).
We initially selected BT Settl model spectra covering the K range, and [M/H] and +0.3. This range of parameters was selected to ensure that we include all likely possibilities for such a young and late-type T dwarf, and allowing for the potentially high metallicity suggested by Burgasser et al. (2010). We then took the median as our value for , and the scatter in values as an estimate of the systematic uncertainty associated with our use of theoretical extensions scaled to photometry, amounting to approximately 11%. The uncertainties in the photometry used to scale the model spectra contribute approximately 4% to the flux error budget. We thus estimate for Ross 458C that Wm-2, of which approximately 60% is emitted longward of 2.4. Using the well determined distance to the primary star, and incorporating the uncertainty therein, we estimate the total luminosity of Ross 458C to be .
We used the Saumon et al. (2006, 2007) models to fill in the missing spectral regions in an identical manner to that described above for the BT Settle model grid. We selected cloudless models across the same temperature, gravity and metallicity range as used for the BT Settl bolometric correction, and for simplicity at this stage we have considered only a single eddy diffusion coefficient (which parameterises non-equilibrium effects due to turbulent mixing - see below) of . This value has been selected as simply a typical one for late T dwarfs, and does represent a firm estimate for the value of this parameter for Ross 458C, and selecting a different value does not affect our flux estimate, since we scale our model spectra by the observed photometry. In Section 3.2 we find the best fitting value of .
We find that this choice of models for our bolometric correction suggests a value of Wm-2, with a 7% contribution to the uncertainty arising from the scatter in the model extensions. We find that essentially the same contribution to the correction arises from the region longward of 2.4. Our estimate for the total luminosity of Ross 458C using the Saumon & Marley model set is thus , which is consistent with the estimate derived using the BT Settl model grid. Both estimates for are substantially brighter than has been found for the similarly typed late-T dwarf Wolf 940B (Burningham et al. 2009; Leggett et al. 2010) for which has been estimated (Leggett et al. 2010).
To determine for Ross 458C we have used the constraints placed on its age by Goldman et al. (2010) to estimate a likely range of radii. As with the bolometric correction, we have used two sets of evolutionary models to provide some indication of the systematic effects involved in this process. Using predictions from the COND (Baraffe et al. 2003) evolutionary models, for the Gyr range, we find that our derived luminosity estimates are consistent with a radius in the 0.101–0.120 R☉ interval (and and 4.0 respectively). This results in an inferred range of K to K for our BT Settl based bolometric correction, and a range of to for our Saumon & Marley corrected luminosity.
Using the evolutionary tracks of Saumon & Marley (2008) suggests a slightly larger radius than the COND models, with a radius in the range 0.103–0.124 R☉ (and and 4.0 respectively), resulting in lower inferred values for , with ranges of K to K and K to K for our BT Settl and Saumon & Marley corrected luminosities respectively.
Although the BT Settl bolometric correction suggests a marginally higher range, the two estimates are consistent and we adopt K as our final estimate, with . For our age constraint of 0.1–1Gyr this corresponds to a mass range of roughly 5–20 MJ according to both sets of evolutionary models.
3.2 Model comparison
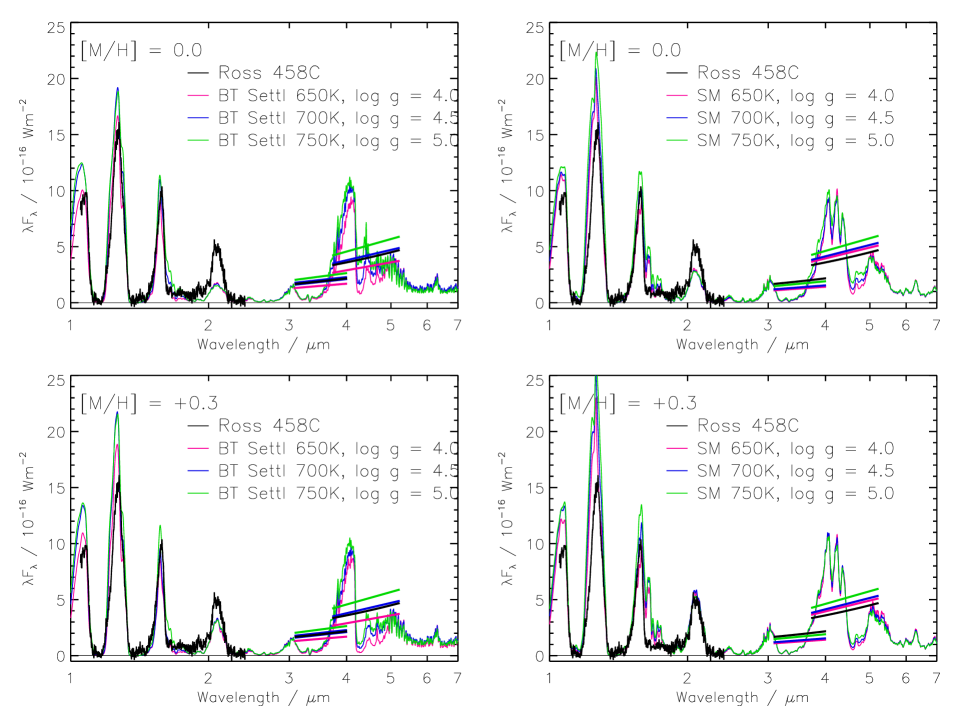
In Figure 2, we have compared model spectra for a range of parameters that straddle our and gravity estimates for Ross 458C with the observed spectrum and the mean fluxes inferred for the warm-Spitzer channel 1 and 2 photometry. On the whole the BT Settl models appear to provide the best fits in the near-infrared although, as has been seen before (Burningham et al. 2009), their band flux is substantially underestimated. Of note also is the difference between the two model sets in the 1.57-1.60 region, where missing methane opacities are thought to be a significant factor in the generally poor fit of model spectra to data in this region. Both model sets base their methane opacities on the same incomplete line lists, however the BT Settl model grid use a statistical estimate of the contributions from hot vibrational bands in the and bands, based on the results of Borysow et al. (2003), and this may account for the differences seen in the band absorption features.
The most notable differences between the two model sets, however, lie in the 3.5–5 region, where the BT Settl models are able to match both the [3.5] and [4.5] fluxes well. The Saumon & Marley models, on the other hand, tend to somewhat underestimate the flux in the former and overestimate the flux in the latter. Both model sets predict similar absorption strengths for the CO fundamental band at 4.55, but a significant difference in the integrated [4.5] fluxes arises from a much stronger CO2 band centered at 4.3 in the BT Settl models than is seen in the Saumon & Marley models. Both sets of models use similar CO2 opacities and the same CNO abundances, but the BT Settl consider chemical non-equilibrium effects on the CO2 to CO mixing ratio and thus could be expected have higher carbon dioxide abundances in the upper atmosphere.
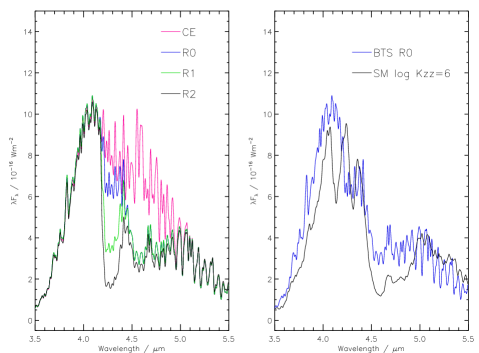
To examine this possibility in more detail we have recalculated the BT Settl model spectrum for the K, , Solar metallicity case under several different assumptions about CO and CO2 chemistry. The left side of Figure 3 compares the 3.5–5.5 region for the BT Settl models under the following cases: CE - carbon species in full chemical equilibrium; R0 - equal reduction rate for CO2 and CO; R1 - includes the reaction of CO with OH for the conversion between CO and CO2, as used by Visscher et al. (2010) for the Jovian atmosphere; R2 - this is the standard BT Settl treatment and is as for R1 but also includes the reaction of CO with H2O. The R0 case is roughly equivalent to the treatment in the Saumon & Marley models, and the right side of Figure 3 shows that this case compares much more closely than the two CO2 non-equilibrium cases. This supports the assertion that the principal cause of the difference between the two model groups in this region is the non-equilibrium treatment for CO2 chemistry used by the BT Settl models.
We note that the default BT Settl (R2) case produces a between five and six times higher CO2 abundance than with the single reaction for converting CO to CO2, and 30–40 times higher CO2 abundance than in the case where both CO and CO2 are quenched at the same level (as in the Saumon & Marley models). The increased abundance of CO2 does not impact the CO-CH4 chemistry significantly since CO remains over 20 times more abundant than CO2 even in the default BT Settl (R2) model, and CH4 number density is similarly unaffected by any of the chemistry models since it always remains two orders of magnitude more abundant than CO.
It is clear then that it is appropriate to attribute the difference between the models in the 4.3 region to the non-equilibrium treatment of CO2 in the BT Settl models, and that the strength of the CO2 absorption is also strongly dependent on which reaction paths are considered. The better fit of the BT Settl models to the observed warm-Spitzer photometry suggests that such effects are important for determining the emergent spectra of very cool T dwarfs. The non-equilibrium treatment for CO2 chemistry is further supported by the recent identification of strong 4.3 CO2 absorption in AKARI / IRC spectroscopy of the T8 dwarf 2MASS J04151954-0935066 (Yamamura et al. 2010), although it is not yet established if both reaction pathways considered in the BT Settl models are at work in such environments.
To quantitatively assess the best fitting model we have employed the goodness-of-fit statistic, , of Cushing et al. (2008) which is defined for a given model, k as
| (1) |
where is the weight to be assigned to wavelength interval, , is the observed flux with uncertainty , is the model flux and is a scaling factor equal to for a source of radius at distance . We take the value of the weight as the width in wavelength space of each point on the spectrum. In all cases we convolved the model spectra with the instrumental profile of the observed spectrum of Ross 458C such that the resolutions are equivalent. In applying this statistic we have treated the total flux captured through each warm-Spitzer filter as a single point, weighted by the width of the filter. Uncertainties in the value of have been calculated by performing 10000 Monte Carlo simulations for each case, randomly offsetting the target spectrum according to the measured uncertainties.
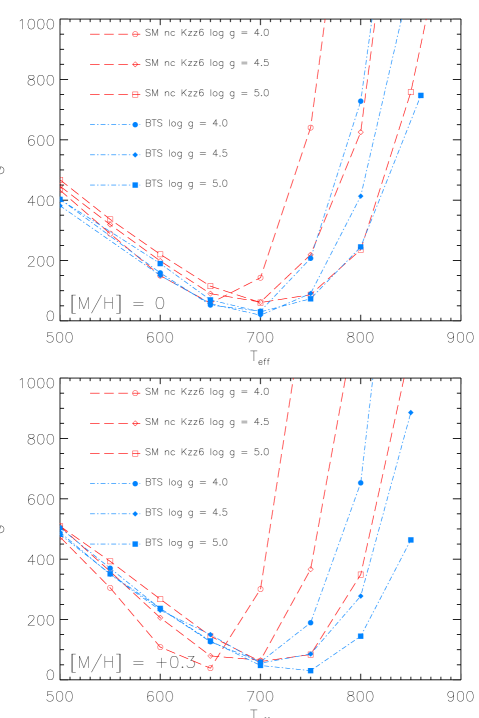
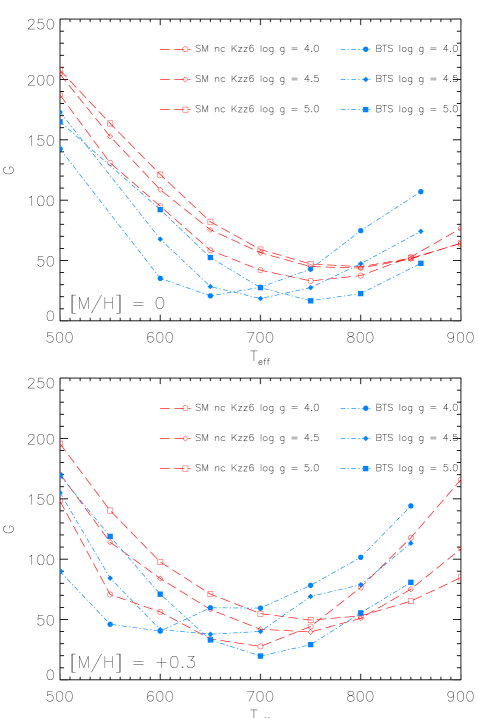
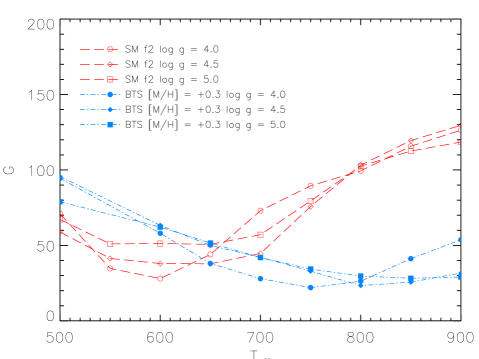
In Figure 4 we have plotted the values for for various and for both sets of models. We have computed using the known parallax of Ross 458AB and radii consistent with the values of as implied by both sets of evolutionary models. We have also calculated for the case where the scaling factor is unconstrained by parallax and evolutionary arguments to determine the estimate that would be found from pure spectral fitting in the case of the two sets of models, and the results are plotted in Figure 5. We have summarised the best fitting models for each case in Table 3.
| Case | BT Settl best fit | SM best fit | ||||
|---|---|---|---|---|---|---|
| , fixed | 700 K | 4.5 | 650 K | 4.0 | ||
| , fixed | 750 K | 5.0 | 650 K | 4.0 | ||
| , free | 750 K | 5.0 | 750 K | 4.0 | ||
| , free | 700 K | 5.0 | 700 K | 4.0 | ||
The best fitting model spectra in both the free scaling fits and the constrained fits suggest properties that are consistent with those estimated from our empirically determined luminosity for Ross 458C. That the best fits are all provided by the Solar metallicity BT Settl models appears inconsistent with the [M/H] = +0.2–+0.3 estimates for the system from Burgasser et al. (2010). However, the /metallicity and /metallicity relations of Johnson & Apps (2009) and Schlaufman & Laughlin (2010) that were applied in that work are based on calibration from a relatively small number of M dwarfs, and Ross 458A lies at the early spectral type extreme of the sample. Additionally, the calibration samples are likely dominated by systems with ages typically larger than 3 Gyr. Such systems show little evolution in the plane with age, and thus any spread about the main sequence may be attributed to metallicity, however the same can not be said for dwarfs with the young age of Ross 458. Burgasser et al. (2010) also noted that the young age of Ross 458 may introduce a bias to higher metallicity, and Morales et al. (2008) found systematically higher values of [Fe/H] for active stars when using the Bonfils et al. (2005) relations.
3.3 Dust in the atmosphere of Ross 458C
In Figure 6 we have plotted the goodness-of-fit statistic, , minimised for the case of a free scale factor, , for Saumon & Marley models in which condensate clouds are present in the photosphere and for BT Settl models. The Saumon & Marley atmospheres use the Ackerman & Marley (2001) cloud model, which parameterises the efficiency of sedimentation of condensate particles through an efficiency factor . Larger values represent faster particle growth and larger mean grain sizes. Larger dust grains rain out of the atmosphere giving rise to optically thin clouds. Smaller values of thus correspond to thicker clouds.
Since no Saumon & Marley models with dust clouds are currently available for , we have only fitted the near infrared spectrum since a lower value of will result in a poor fit at longer wavelengths which would tend to dominate the statistic. We found that the best fit for the Saumon & Marley models was for a dust sedimentation efficiency parameter = 2, Solar metallicity, K and (). These properties are consistent with what was found by Burgasser et al. (2010), who found that Saumon & Marley models which included condensate opacity were able to provide a better fit to their near infrared spectra than those without, leading them to conclude that condensate clouds are an important opacity source in very cool young T dwarf atmospheres. Whilst most of the cloud lies beneath the photosphere in this model, upper layers of cloud contribute to the near-infrared opacity, with an optical depth of in the band peak, such that the cloud is thick enough to define the photosphere in this region.
We have found that the BT Settl model with [M/H] = +0.3, K and provides a significantly better fit () than the dusty Saumon & Marley models in the restricted near-infrared fits examined in this Section. In the BT Settl models the main part of the cloud deck also lies well below the photosphere, but the upper cloud layers appear to have a smaller impact than in the case of the Saumon & Marley models. This small amount of cloud opacity may account for the better match of the BT Settl models in the band peak compared to the cloud-free Saumon & Marley models (see Figure 2). We can thus conclude that whilst condensates contribute some near-infrared opacity at the low of cool T dwarfs, the use of models with clouds thinner in vertical extent than the case is preferred. However, it should be noted that the difference in the dust opacity between the two models appears to be relatively modest. Whilst corresponds to very dusty atmospheres at the of L dwarfs, it results in a roughly similar dust signature to the BT Settl models at K.
We note, also, that the best fitting BT Settl models are somewhat warmer than is found when the IRAC photometry is included in the fit. This is likely due to the increased importance of the band flux in the fit, which is consistently underestimated by the cool BT Settl models.
4 Comparison to the wider low-temperature sample
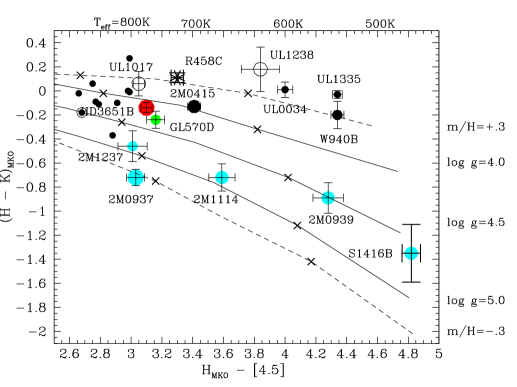
To place Ross 458C in context with the wider sample of very cool T dwarfs we have reproduced the / colour-colour plot of Leggett et al. (2010) in Figure 7. Although the behaviour of the colour is likely poorly understood (see Section 3.2) and the models are known to produce colours that are too blue, such a plot can still provide useful insights to the relative properties of the cool dwarf sample. The young age of Ross 458C and its location on this colour-colour plot would appear to support the assertion that the low-temperature T dwarfs identified in UKIDSS to date are dominated by young, low-mass objects (Leggett et al. 2010). This is interesting in the context of the dearth of late T dwarfs found in the Solar neighbourhood compared to what would be expected given the mass function seen in young cluster and associations (Burningham et al. 2010b), although it is not yet clear if this is due to some effect of the birthrate for brown dwarfs, an as yet unidentified selection effect or some problem with the evolutionary models.
5 Summary
We have presented near-infrared spectroscopy, photometry and warm-Spitzer IRAC photometry of the very cool brown dwarf Ross 458C. We assign it the spectral type T8.5p, where the ‘p’ indicates the peculiarity due to an enhanced band flux, presumably reflecting the low-gravity associated with such a young object. We have used both BT Settl and Saumon & Marley model grids to estimate the flux in regions not covered by our near-infrared spectrum and IRAC photometry, and by using age constraints placed on Ross 458AB by Goldman et al. (2010) we use the bolometric luminosity to estimate that K and .
We have also fitted various model spectra to the data and have found that the Solar metallicity BT Settl model grid provide the best match to the data for our derived parameter set, although both model sets provide similar estimates for and gravity when used to fit for the parameters. The fitted estimates are also consistent with our determination from the bolometric flux.
We note, however, that these similar parameter estimates are despite significant differences in the predicted spectrum in the 4–5 region due to differences in approach to CO–CO2 chemistry. The BT Settl spectra best reproduce the IRAC photometry, suggesting that chemical non-equilibrium effects are important in setting the CO-CO2 ratio, although spectroscopy would be required to confirm this assertion. The FLITECAM instrument (McLean et al. 2006) on board the Stratospheric Observatory for Infrared Astronomy (SOFIA; Becklin 2005) may provide the capability to distinguish the model sets for bright objects such as Ross 458C. For fainter objects, this spectral region will be restricted to photometric data until the launch of the James Webb Space Telescope.
We have also examined the suggestion by Burgasser et al. (2010) that condensate clouds are an important source of opacity in the emergent spectrum of Ross 458C. We find that the BT Settl models provide a better fit to the near infrared spectrum than the dusty models favoured by the Burgasser et al. (2010) fits. Although in both sets of models the main cloud deck lies well below the photosphere, in the Saumon & Marley models the upper layers still effectively define the photosphere in near infrared spectral regions such as the band peak, whilst in the BT Settl case their influence is much smaller. We thus conclude that condensate opacity does indeed appear to affect the near-infrared spectra of cool T dwarfs, although clouds with less vertical extent than is seen for the are preferred.
Acknowledgements
We thank our anonymous referee for comments that have greatly improved the quality of the manuscript. The authors wish to recognise and acknowledge the very significant cultural role and reverence that the summit of Mauna Kea has always had within the indigenous Hawaiian community. We are most fortunate to have the opportunity to conduct observations from this mountain. SKL is supported by the Gemini Observatory, which is operated by AURA, on behalf of the international Gemini partnership of Argentina, Australia, Brazil, Canada, Chile, the United Kingdom, and the United States of America. CGT is supported by ARC grant DP0774000. This research has made use of the SIMBAD database, operated at CDS, Strasbourg, France, and has benefited from the SpeX Prism Spectral Libraries, maintained by Adam Burgasser at http://www.browndwarfs.org/spexprism.
References
- Ackerman & Marley (2001) Ackerman A. S., Marley M. S., 2001, ApJ, 556, 872
- Allard et al. (2010) Allard F., Homeier D., Freytag B., 2010, ArXiv e-prints
- Allard et al. (2008) Allard F., Homeier D., Freytag B., Guillot T., Chabrier G., Ludwig H., Allard N., Ferguson J., Barman T., Hauschildt P., 2008, A&A, in prep.
- Baraffe et al. (2003) Baraffe I., Chabrier G., Barman T. S., Allard F., Hauschildt P. H., 2003, A&A, 402, 701
- Becklin (2005) Becklin E. E., 2005, Advances in Space Research, 36, 1087
- Bonfils et al. (2005) Bonfils X., Delfosse X., Udry S., Santos N. C., Forveille T., Ségransan D., 2005, A&A, 442, 635
- Borysow et al. (2003) Borysow A., Champion J. P., Jørgensen U. G., Wenger C., 2003, in ASP Conference Series, Vol. 288, Stellar Atmosphere Modeling, Hubeny I., Mihalas D., Werner K., eds., The Astronomical Society of the Pacific, San Francisco, pp. 352–356
- Burgasser et al. (2006) Burgasser A. J., Geballe T. R., Leggett S. K., Kirkpatrick J. D., Golimowski D. A., 2006, ApJ, 637, 1067
- Burgasser et al. (2010) Burgasser A. J., Simcoe R. A., Bochanski J. J., Saumon D., Mamajek E. E., Cushing M. C., Marley M. S., McMurtry C., Pipher J. L., Forrest W. J., 2010, ArXiv e-prints
- Burningham et al. (2010a) Burningham B., Leggett S. K., Lucas P. W., Pinfield D. J., Smart R. L., Day-Jones A. C., Jones H. R. A., Murray D., Nickson E., Tamura M., Zhang Z., Lodieu N., Tinney C. G., Osorio M. R. Z., 2010a, MNRAS, 404, 1952
- Burningham et al. (2008) Burningham B., Pinfield D. J., Leggett S. K., Tamura M., Lucas P. W., Homeier D., Day-Jones A., Jones H. R. A., Clarke J. R. A., Ishii M., Kuzuhara M., Lodieu N., Zapatero Osorio M. R., Venemans B. P., Mortlock D. J., Barrado Y Navascués D., Martin E. L., Magazzù A., 2008, MNRAS, 391, 320
- Burningham et al. (2009) Burningham B., Pinfield D. J., Leggett S. K., Tinney C. G., Liu M. C., Homeier D., West A. A., Day-Jones A., Huelamo N., Dupuy T. J., Zhang Z., Murray D. N., Lodieu N., Barrado Y Navascués D., Folkes S., Galvez-Ortiz M. C., Jones H. R. A., Lucas P. W., Calderon M. M., Tamura M., 2009, MNRAS, 395, 1237
- Burningham et al. (2010b) Burningham B., Pinfield D. J., Lucas P. W., Leggett S. K., Deacon N. R., Tamura M., Tinney C. G., Lodieu N., Zhang Z. H., Huelamo N., Jones H. R. A., Murray D. N., Mortlock D. J., Patel M., Navascues D. B. y., Zapatero Osorio M. R., Ishii M., Kuzuhara M., Smart R. L., 2010b, ArXiv e-prints
- Casali et al. (2007) Casali M., Adamson A., Alves de Oliveira C., Almaini O., Burch K., Chuter T., Elliot J., Folger M., Foucaud S., Hambly N., Hastie M., Henry D., Hirst P., Irwin M., Ives D., Lawrence A., Laidlaw K., Lee D., Lewis J., Lunney D., McLay S., Montgomery D., Pickup A., Read M., Rees N., Robson I., Sekiguchi K., Vick A., Warren S., Woodward B., 2007, A&A, 467, 777
- Cushing et al. (2008) Cushing M. C., Marley M. S., Saumon D., Kelly B. C., Vacca W. D., Rayner J. T., Freedman R. S., Lodders K., Roellig T. L., 2008, ApJ, 678, 1372
- Day-Jones et al. (2008) Day-Jones A. C., Pinfield D. J., Napiwotzki R., Burningham B., Jenkins J. S., Jones H. R. A., Folkes S. L., Weights D. J., Clarke J. R. A., 2008, MNRAS, 388, 838
- Day-Jones et al. (2010) Day-Jones A. C., Pinfield D. J., Ruiz M. T., Beaumont H., Burningham B., Gallardo J., Gianninas A., Bergeron P., Napiwotzki R., Jenkins J. S., Zhang Z. H., Murray D., Catalan S., Gomes J., 2010, ArXiv e-prints
- Dupuy et al. (2009) Dupuy T. J., Liu M. C., Ireland M. J., 2009, ApJ, 699, 168
- Goldman et al. (2010) Goldman B., Marsat S., Henning T., Clemens C., Greiner J., 2010, MNRAS, 405, 1140
- Hambly et al. (2008) Hambly N. C., Collins R. S., Cross N. J. G., Mann R. G., Read M. A., Sutorius E. T. W., Bond I., Bryant J., Emerson J. P., Lawrence A., Rimoldini L., Stewart J. M., Williams P. M., Adamson A., Hirst P., Dye S., Warren S. J., 2008, MNRAS, 384, 637
- Hawley et al. (1997) Hawley S. L., Gizis J. E., Reid N. I., 1997, AJ, 113, 1458
- Hodapp et al. (2003) Hodapp K. W., Jensen J. B., Irwin E. M., Yamada H., Chung R., Fletcher K., Robertson L., Hora J. L., Simons D. A., Mays W., Nolan R., Bec M., Merrill M., Fowler A. M., 2003, PASP, 115, 1388
- Irwin et al. (2004) Irwin M. J., Lewis J., Hodgkin S., Bunclark P., Evans D., McMahon R., Emerson J. P., Stewart M., Beard S., 2004, in Society of Photo-Optical Instrumentation Engineers (SPIE) Conference Series, Vol. 5493, Society of Photo-Optical Instrumentation Engineers (SPIE) Conference Series, P. J. Quinn & A. Bridger, ed., pp. 411–422
- Johnson & Apps (2009) Johnson J. A., Apps K., 2009, ApJ, 699, 933
- King et al. (2010) King R. R., McCaughrean M. J., Homeier D., Allard F., Scholz R., Lodieu N., 2010, A&A, 510, A99+
- Kobayashi et al. (2000) Kobayashi N., Tokunaga A. T., Terada H., Goto M., Weber M., Potter R., Onaka P. M., Ching G. K., Young T. T., Fletcher K., Neil D., Robertson L., Cook D., Imanishi M., Warren D. W., 2000, in Presented at the Society of Photo-Optical Instrumentation Engineers (SPIE) Conference, Vol. 4008, Proc. SPIE Vol. 4008, p. 1056-1066, Optical and IR Telescope Instrumentation and Detectors, Masanori Iye; Alan F. Moorwood; Eds., Iye M., Moorwood A. F., eds., pp. 1056–1066
- Lawrence et al. (2007) Lawrence A., Warren S. J., Almaini O., Edge A. C., Hambly N. C., Jameson R. F., Lucas P., Casali M., Adamson A., and thirteen co-authors, 2007, MNRAS, 379, 1599
- Leggett et al. (2010) Leggett S. K., Burningham B., Saumon D., Marley M. S., Warren S. J., Smart R. L., Jones H. R. A., Lucas P. W., Pinfield D. J., Tamura M., 2010, ApJ, 710, 1627
- Littlefair et al. (2007) Littlefair S. P., Dhillon V. S., Marsh T. R., Gänsicke B. T., Baraffe I., Watson C. A., 2007, MNRAS, 381, 827
- Lodieu et al. (2007) Lodieu N., Pinfield D. J., Leggett S. K., Jameson R. F., Mortlock D. J., Warren S. J., Burningham B., Lucas P. W., Chiu K., Liu M. C., Venemans B. P., McMahon R. G., Allard F., Baraffe I., Y Navascués D. B., Carraro G., Casewell S. L., Chabrier G., Chappelle R. J., Clarke F., Day-Jones A. C., Deacon N. R., Dobbie P. D., Folkes S. L., Hambly N. C., Hewett P. C., Hodgkin S. T., Jones H. R. A., Kendall T. R., Magazzù A., Martín E. L., McCaughrean M. J., Nakajima T., Pavlenko Y., Tamura M., Tinney C. G., Zapatero Osorio M. R., 2007, MNRAS, 379, 1423
- McLean et al. (2006) McLean I. S., Smith E. C., Aliado T., Brims G., Kress E., Magnone E., Milburn J., Oldag A., Silvers T., Skulason G., Becklin E. E., Shuping R. Y., 2006, in Society of Photo-Optical Instrumentation Engineers (SPIE) Conference Series, Vol. 6269, Society of Photo-Optical Instrumentation Engineers (SPIE) Conference Series
- Morales et al. (2008) Morales J. C., Ribas I., Jordi C., 2008, A&A, 478, 507
- Nakajima et al. (1995) Nakajima T., Oppenheimer B. R., Kulkarni S. R., Golimowski D. A., Matthews K., Durrance S. T., 1995, Nature, 378, 463
- Nidever et al. (2002) Nidever D. L., Marcy G. W., Butler R. P., Fischer D. A., Vogt S. S., 2002, ApJS, 141, 503
- Pinfield et al. (2008) Pinfield D. J., Burningham B., Tamura M., Leggett S. K., Lodieu N., Lucas P. W., Mortlock D. J., Warren S. J., Homeier D., Ishii M., Deacon N. R., McMahon R. G., Hewett P. C., Osori M. R. Z., Martin E. L., Jones H. R. A., Venemans B. P., Day-Jones A. C., Dobbie P. D., Folkes S. L., Dye S., Allard F., Baraffe I., Barrado Y Navascués D., Casewell S. L., Chiu K., Chabrier G., Clarke F., Hodgkin S. T., Magazzù A., McCaughrean M. J., Nakajima T., Pavlenko Y., Tinney C. G., 2008, MNRAS, 390, 304
- Pinfield et al. (2006) Pinfield D. J., Jones H. R. A., Lucas P. W., Kendall T. R., Folkes S. L., Day-Jones A. C., Chappelle R. J., Steele I. A., 2006, MNRAS, 368, 1281
- Saumon & Marley (2008) Saumon D., Marley M. S., 2008, ApJ, 689, 1327
- Saumon et al. (2006) Saumon D., Marley M. S., Cushing M. C., Leggett S. K., Roellig T. L., Lodders K., Freedman R. S., 2006, ApJ, 647, 552
- Saumon et al. (2007) Saumon D., Marley M. S., Leggett S. K., Geballe T. R., Stephens D., Golimowski D. A., Cushing M. C., Fan X., Rayner J. T., Lodders K., Freedman R. S., 2007, ApJ, 656, 1136
- Schlaufman & Laughlin (2010) Schlaufman K. C., Laughlin G., 2010, A&A, 519, A105+
- Scholz (2010) Scholz R., 2010, ArXiv e-prints
- Scholz et al. (2003) Scholz R.-D., McCaughrean M. J., Lodieu N., Kuhlbrodt B., 2003, A&A, 398, L29
- Stassun et al. (2006) Stassun K. G., Mathieu R. D., Valenti J. A., 2006, Nature, 440, 311
- Tokunaga et al. (2002) Tokunaga A. T., Simons D. A., Vacca W. D., 2002, PASP, 114, 180
- Visscher et al. (2010) Visscher C., Moses J. I., Saslow S. A., 2010, Icarus, 209, 602
- West et al. (2008) West A. A., Hawley S. L., Bochanski J. J., Covey K. R., Reid I. N., Dhital S., Hilton E. J., Masuda M., 2008, AJ, 135, 785
- Yamamura et al. (2010) Yamamura I., Tsuji T., Tanabé T., 2010, ApJ, 722, 682
- Zhang et al. (2010) Zhang Z. H., Pinfield D. J., Day-Jones A. C., Burningham B., Jones H. R. A., Yu S., Jenkins J. S., Han Z., Gálvez-Ortiz M. C., Gallardo J., García-Pérez A. E., Weights D., Tinney C. G., Pokorny R. S., 2010, MNRAS, 404, 1817