From proper motions to star cluster dynamics: measuring velocity dispersion in deconvolved distribution functions
Abstract
We investigate the effect that the usually large errors associated with ground-based proper motion (PM) components have on the determination of a star cluster’s velocity dispersion (). Rather than histograms, we work with PM distribution functions (PMDFs), taking the uncertainties formally into account. In this context, a cluster’s intrinsic PMDF is broadened by the error distribution function (eDF) that, given the average error amplitude, has a width usually comparable to the cluster PMDF. Thus, we apply a Richardson-Lucy (RL) deconvolution to the PMDFs of a set of relatively nearby and populous open clusters (OCs), using the eDFs as point spread functions (PSFs). The OCs are NGC 1039 (M 34), NGC 2477, NGC 2516, NGC 2682 (M 67), and NGC 7762. The deconvolved PMDFs are approximately Gaussian in shape, with dispersions lower than the observed ones by a factor of 4-10. NGC 1039 and NGC 2516, the nearest OCs of the sample, have deconvolved compatible with those of bound OCs of mass . NGC 2477 and NGC 2682 have deconvolved PMDFs with a secondary bump, shifted towards higher average velocities, which may be an artefact of the RL deconvolution when applied to asymmetric profiles. Alternatively, it may originate from cluster merger, large-scale mass segregation or, least probably, binaries.
keywords:
(Galaxy:) open clusters and associations: general1 Introduction
Star clusters continually undergo mass segregation and evaporation, tidal interactions with Galactic substructures, shocks with giant molecular clouds, as well as mass loss due to stellar evolution. By decreasing the total cluster mass - and the collective gravitational potential, these processes affect the internal dynamics and accelerate the cluster dynamical evolution. Thus, the escape velocity () and, to a lesser degree, the space velocity dispersion (), are expected to continually change with time. As a consequence, the majority of the open clusters (OCs) dissolve in the Galactic stellar field long before reaching an age of Gyr (e.g. Lamers et al. 2005; Goodwin & Bastian 2006). In this context, the dynamical evolution of a star cluster depends critically on the balance between and .
For a cluster that is approximately in virial equilibrium, the space velocity dispersion can be computed as (Spitzer 1987), where is the gravitational constant, is the dynamical mass (assumed to be stored only in single stars), is a constant, and is the effective, or projected half-light radius. As a scaling factor, bound clusters with and pc are expected to have . Since the majority of the Galactic OCs have masses lower than (e.g. Piskunov et al. 2007), velocity dispersions lower than, or of the order of should be a rule.
Obviously, the above expectation does not apply to clusters that are on their way to dissolution, either at the earliest evolutionary stages (less than a few yr) or much later, at the remnant phase (several yr, e.g. Pavani & Bica 2007). Such a super-virial state in very young clusters is related to the impulsive expulsion of the residual parental molecular cloud gas, driven primarily by the strong winds of massive stars and supernovae (Goodwin & Bastian 2006), thus leading to the high dissolution rate of young clusters (e.g. Lada & Lada 2003). Examples of dissolving young OCs with velocity dispersions that by far exceed the expected dynamical value (de Grijs et al. 2008) are NGC 2244, with an age of Myr and (Chen, de Grijs & Zhao 2004; Bonatto & Bica 2009b), Cr 197 and vdB 92, both with an age of Myr and (Bonatto & Bica 2010a)
A first-order estimate of a star cluster’s can be obtained by measuring the proper-motion (PM) distribution of the member stars. Having obtained the PM components in right ascension () and declination () of each member, the and dispersions can be estimated from the shape of the respective distributions. Alternatively, if the systemic PM components are known, one can compute directly the tangential or on-sky PM and dispersion . Then, assuming isotropy, we can take . At this point, it should be mentioned that, contrary to radial velocity measurements, proper motions are essentially unaffected by binarity (Kouwenhoven & de Grijs 2008). This occurs because radial velocities are instantaneous measurements, while proper motions involve a (usually large) timespan. In this sense, Kouwenhoven & de Grijs (2008) show that for clusters of mass , binaries produce an observed radial velocity dispersion several times higher than the dynamical one, thus leading to an artificially-overestimated cluster mass.
Comprehensive databases such as the Third U.S. Naval Observatory CCD Astrograph Catalog (UCAC3, Zacharias et al. 2010) and the The Naval Observatory Merged Astrometric Dataset (NOMAD, Zacharias et al. 2005) provide PM components for huge amounts of stars, either isolated or in clusters. However, a drawback of such all-sky, ground-based PM databases is the fact that the uncertainties in and are usually large. The effect that such errors have on the determination of , which usually involves building PM histograms with bin sizes smaller than the average errors, is a constantly neglected point. Instead of histograms, our approach in this paper is to work with PM distribution functions (PMDFs), in which the errors are formally taken into account.
This paper is organised as follows. In Sect. 2 we build PMDFs and compare them with the classical histograms. In Sect. 3 we select some relatively nearby and populous OCs as test cases. In Sect. 4 we discuss the deconvolution method that we apply on the PMDFs. In Sect. 5 we present the results obtained so far and discuss some observational limitations. Concluding remarks are given in Sect. 6.
2 Proper motion analysis: histograms or distribution functions?
When dealing with PMs, the first step is to isolate the (most probable) cluster members, subtract the systemic components of and from each star, and then compute the tangential or on-sky PM . The systemic components can be directly computed from the data or obtained in OC databases (e.g. WEBDA111www.univie.ac.at/webda or DAML02222Catalog of Optically Visible Open Clusters and Candidates www.astro.iag.usp.br/ wilton).
Usually, the next step involves building PM histograms with a given bin width to estimate the dispersion either of the components or the on-sky. However, except for a few particular cases with high-quality astrometry333For instance, the globular cluster NGC 6397 with Hubble Space Telescope WFPC2 data from 2 epochs (Richer et al. 2008)., ground-based PMs usually have significant errors, in general larger than the adopted histogram bins. Thus, by ignoring the error amplitude, histograms should be taken only as first-order representatives of a cluster’s intrinsic PM distribution. Wider bins would obviously minimise this effect, but would also degrade the PM resolution. The net result would be artificially high values of the dispersion. This is illustrated in Fig. 1 for the component of the OCs NGC 2682 and NGC 2477 (Sect. 3), where we show the classical histogram built with bins of size . Also shown are the average, minimum, and maximum values of the errors. Clearly, in both cases the average error corresponds to approximately the core ( bins) of the histogram. It should be noted as well the introduction of a sort of high-frequency noise, which originates from the Poisson fluctuation associated with the bin size.
Thus, instead of histograms, the correct way of dealing with the above issue is by explicitly incorporating the PM component errors in PMDFs, which are defined as the fractional number of stars per interval of PM, , where is any component among , , and . The errors are incorporated in the PMDFs by assuming that they are normally (i.e. Gaussian) distributed. Accordingly, if measurements of a given parameter are normally distributed around the average with a standard deviation , the probability of finding it at a specific value is given by .
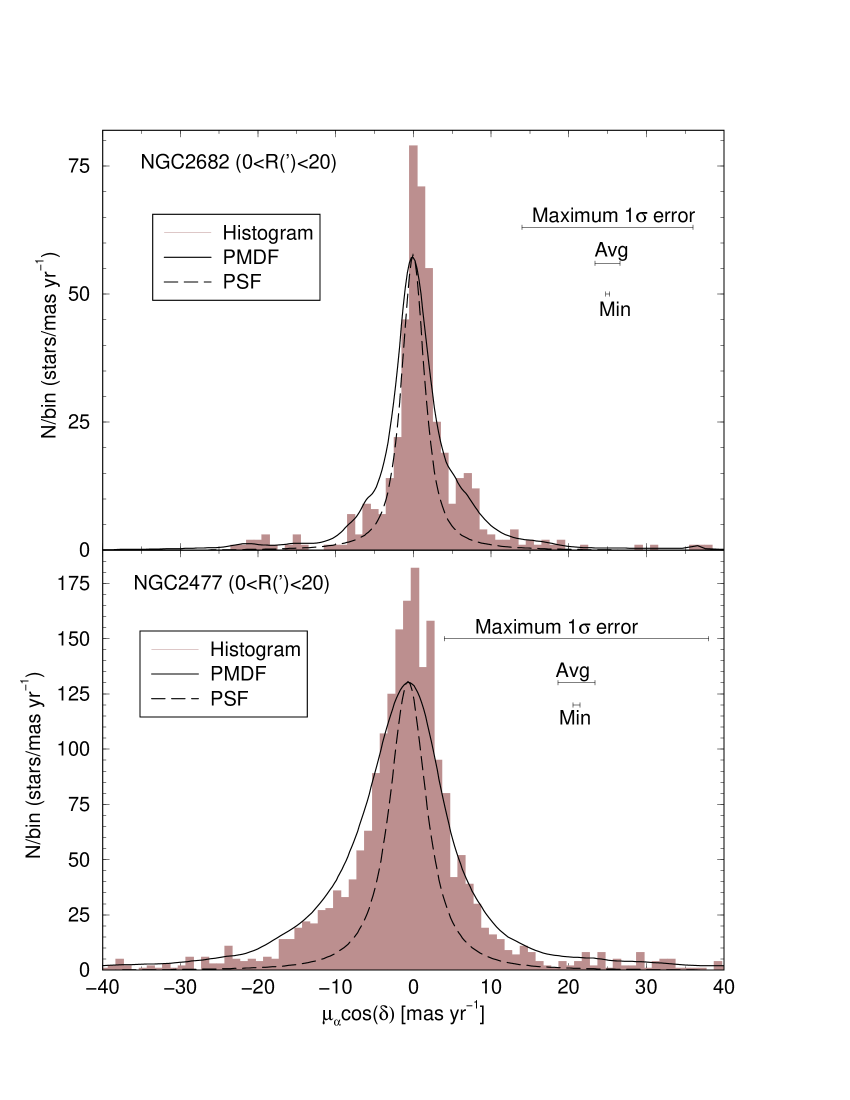
We start by defining a set of PM bins spanning the whole range of values observed in , , and . The bins have smaller widths around the PMDF peak than for higher or lower velocities (for preserving profile resolution - App. A). Then, for a star with PM components and uncertainties , , , we compute the probability of the PM of that star to be in a given bin, which is simply the difference of the error functions computed at the bin borders. By doing this for all stars, we end up with the number-density of stars in each PM bin, the integral of which over the whole range of PM values is simply the number of stars. The PMDFs of NGC 2682 and NGC 2477 are shown in Fig. 1. By construction, the PMDFs are much smoother than the histograms (the high-frequency noise has been naturally removed) and, because of the broadening effect due to the error spreading procedure, they are also somewhat wider and have a lower amplitude. Both the histograms and PMDFs are definitely non-Gaussian, especially because of the broad wings.
Now, the same procedure is applied to the uncertainties, thus resulting in the intrinsic error distribution function (eDF). As anticipated by the amplitude of the average error, the eDF has a width comparable to that of the PMDF for both NGC 2682 and NGC 2477. In this context, the eDF plays a rôle of a PM point-spread function (PSF), which tends to broaden the intrinsic cluster PMDF on a degree that depends essentially on the PMDF and eDF widths. Thus, our approach here is to deconvolve the observed PMDF of selected OCs (Sect. 3) using the intrinsic eDF as PSF (Sect. 4).
3 Test cases
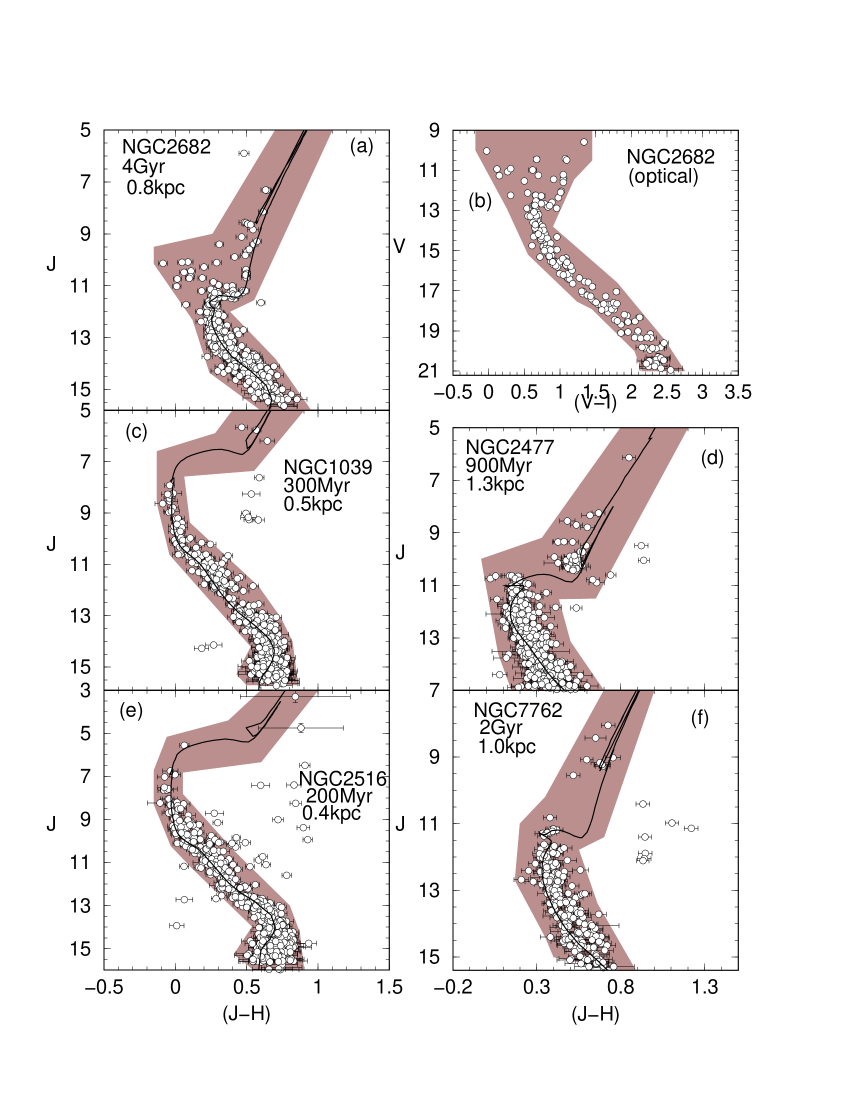
As test cases we searched for OCs that are located relatively nearby (for allowing detection of low-PM components - Sect. 5), away from central directions and the disk (to minimise field-star contamination), and with a wide range of ages. Additionally, the candidates should have a significant number of stars with available PM components in UCAC3444Main features of UCAC3 are: complete sky coverage, merging of several PM catalogues, new data reduction with reduced errors, significantly improved photometry from CCD data, etc. See http://cdsarc.u-strasbg.fr/viz-bin/Cat?I/315 for further details. (for more representative PMDFs). The sample of OCs meeting our criteria are NGC 1039 (M 34), NGC 2477, NGC 2516, NGC 2682 (M 67), and NGC 7762; their fundamental parameters are listed in Table 1. In short, the selected OCs have ages within 0.2 - 4 Gyr and distances from the Sun within kpc.
| Literature | This work | ||||||||||
| Cluster | Age | 5′ | |||||||||
| (hms) | () | (°) | (°) | (Myr) | (mag) | (kpc) | (pc) | (pc) | () | () | |
| (1) | (2) | (3) | (4) | (5) | (6) | (7) | (8) | (9) | (10) | (11) | (12) |
| NGC 1039 | 02:42:45 | 42:45:42 | 143.66 | 15.61 | 0.7 | ||||||
| NGC 2477 | 07:52:10 | 38:31:48 | 253.56 | 5.84 | 1.9 | ||||||
| NGC 2516 | 07:58:04 | 60:45:12 | 273.82 | 15.86 | 0.6 | ||||||
| NGC 2682 | 08:51:18 | 11:48:00 | 215.70 | 31.90 | 1.2 | ||||||
| NGC 7762 | 23:50:01 | 68:08:18 | 117.22 | 5.85 | 1.4 | ||||||
-
Cols. 4 and 5: Galactic coordinates; Col. 8: distance from the Sun; Col. 9: cluster truncation radius (in pc); Col. 10: in absolute units; Cols. 11 and 12: deconvolved systemic proper motion components, computed with the stars within .
2MASS555The Two Micron All Sky Survey, All Sky data release - http://www.ipac.caltech.edu/2mass/releases/allsky/ (Skrutskie et al. 2006) colour-magnitude diagrams (CMDs) extracted from the central region () are shown in Fig. 2. The 5′ boundary was selected for practical reasons. Our analysis depends on the number of member stars in two different cluster regions (Sect. 4), and the stellar density profiles (Fig. 3) show that represents a compromise between adequate statistics and a change from RDPs following a pure power-law () to a power-law flattened by a core (). For NGC 2682 (M 67) we also use the ground-based CCD astrometry of Yadav et al. (2008) as an independent data set for cross-checking our results. The PM components provided by Yadav et al. (2008) are already corrected for the cluster’s systemic velocity. The 2MASS photometry was extracted from VizieR666http://vizier.u-strasbg.fr/viz-bin/VizieR?-source=II/246 in a wide circular field of radius , which is adequate for determining the cluster extension and background level (see below). We also build a colour-magnitude filter for each cluster, which is used to isolate probable member stars (see, e.g. Bonatto & Bica 2010b for a discussion on the use of such filters). Only stars with colour and magnitude compatible with the filter are used in the subsequent analyses. Age, distance from the Sun, and reddening are derived by fitting solar-metallicity Padova isochrones (Girardi et al. 2002; Bonatto, Bica & Girardi 2004) to the CMDs. The derived fundamental parameters (Table 1) are similar to those in WEBDA.
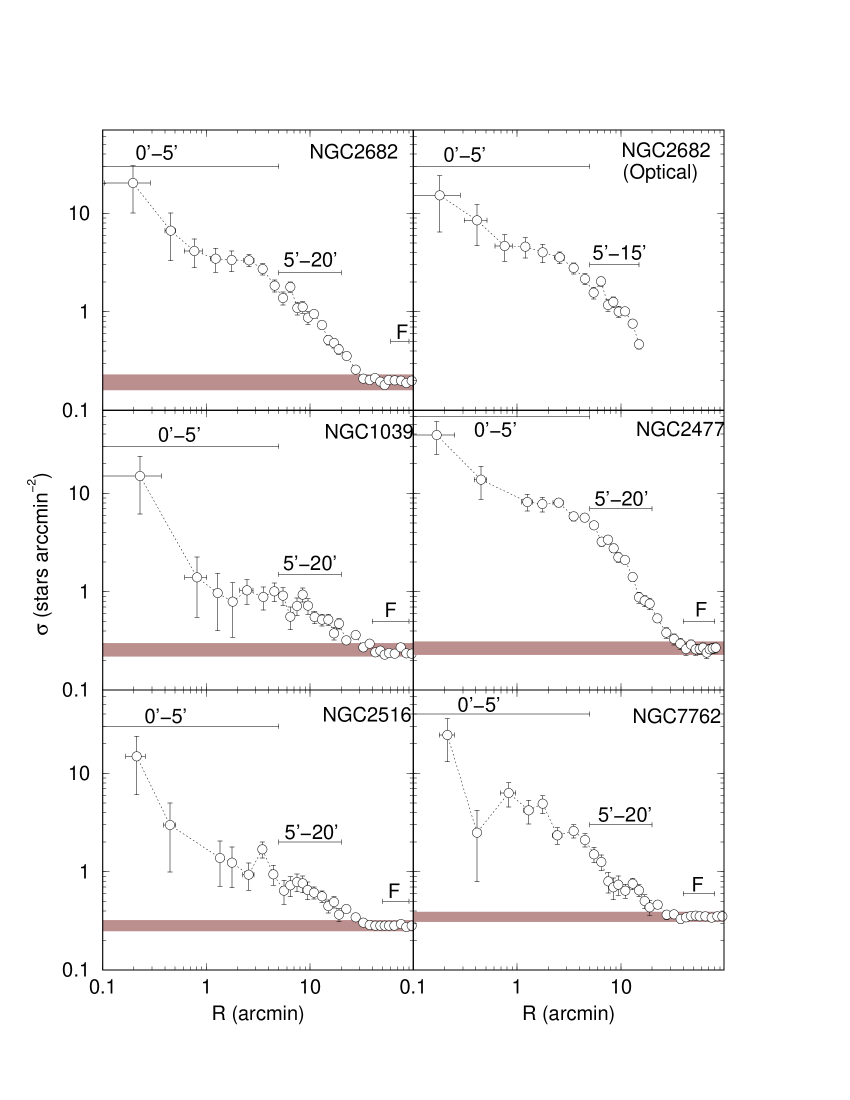
After isolating the probable member stars with the colour-magnitude filters, we use them to build the stellar radial density profile (RDP), which is the projected stellar number density profile around the cluster centre (Fig. 3). Note that the cluster centres have been computed by an algorithm that searches for the highest stellar density in the innermost bin and, at the same time, the smoothest RDP (Bonatto & Bica 2010a). Working with colour-magnitude filtered photometry minimises field contamination and enhances the RDP contrast with the fore/background. The position (and error) of each RDP point along the axes in Fig. 3 corresponds to the average (and uncertainty) distance to the cluster centre of the stars within each bin. We also estimate the cluster truncation radius (), which is simply the distance from the cluster centre where RDP and background are statistically indistinguishable (Fig. 3). On average, the boundary represents of (Table 1). The near-infrared RDPs show that the selected OCs have an extension reaching (the optical data of Yadav et al. 2008 are restricted to ). They also show that field stars with the same colour and magnitude as the probable members are still present in the central region, in varying amounts for the different OCs. The residual field contamination will be taken into account in the PM analysis (Sect. 4).
Proper motion components were obtained in UCAC3 (that also provides the 2MASS photometry for each star) based on the same central coordinates and extraction radius as those used for building the CMDs and RDPs. Afterwards, we applied the respective colour-magnitude filters (Fig. 2) before computing the PM distributions (see below).
4 PMDF deconvolution
By construction, the observed PMDFs are broadened by a PSF that corresponds to the eDF (Sect. 2). Thus, to uncover the intrinsic PMDFs, we apply the iterative Richardson-Lucy (RL) deconvolution method proposed by Richardson (1972) and Lucy (1974). The RL deconvolution conserves the PMDF integral (in the present context the number of stars), but has a relatively slow convergence rate.
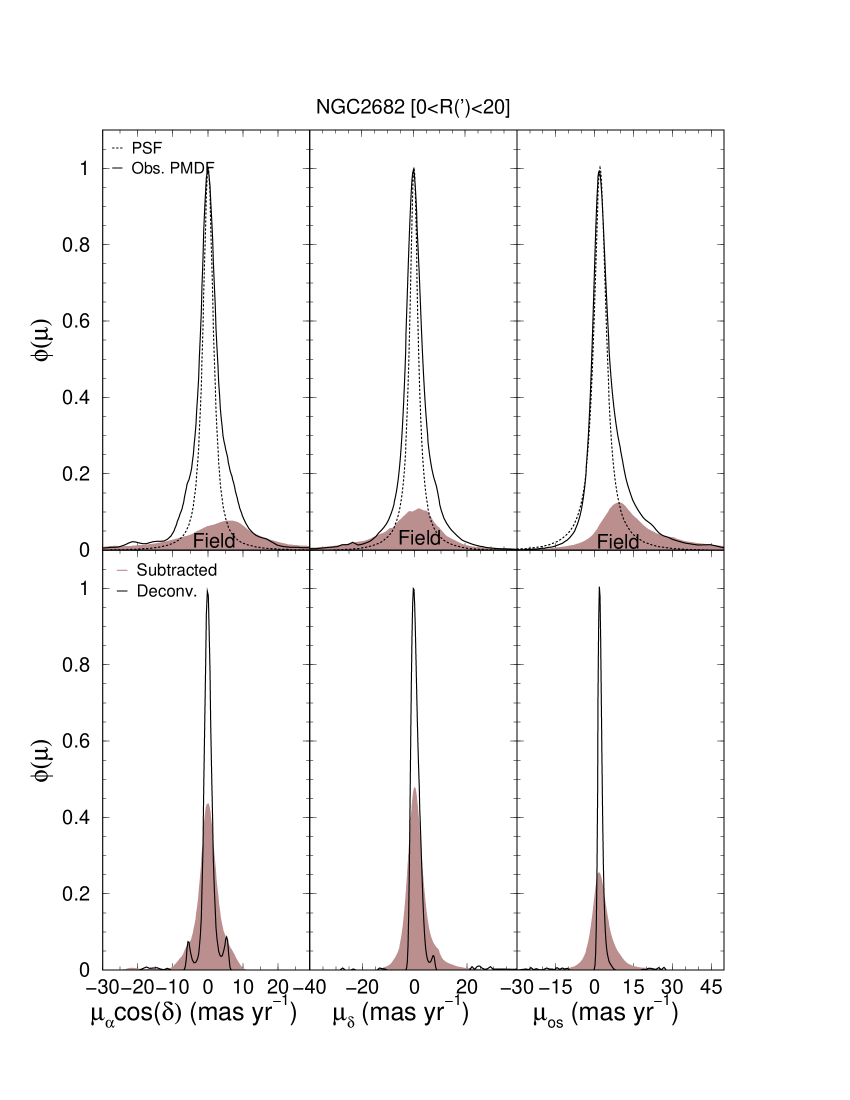
We illustrate the RL deconvolution with the , , and components of the OC NGC 2682 (Fig. 4). As the first step we define the PM-bin size distribution (App. A), and compute and subtract the systemic PM components (Table 1) from and . Actually, this is an iterative step, in which we first subtract the field contamination, deconvolve the resulting PMDF and obtain the systemic PM. We use the region in the analysis as a compromise between the number of member stars and contrast with the field level (Fig. 3). Then we build the cluster and field PMDFs, together with the eDF, which has a width similar to that of the cluster PMDF. Next, the contaminant PMDF of the residual field stars, which is especially seen in as a bump centred at , is subtracted from the observed PMDFs. Finally, the RL deconvolution is applied to the field-subtracted PMDF.
Besides the slow convergence rate, the RL deconvolution is also known for not having a universal convergence criterion. Thus, for determining the number of deconvolution iterations (), we simply sum the squared difference between successive iterations over all bins of the deconvolved PMDF, defined as
where is the current iteration and is the bin along the PM axis (either , , or ), and compute the fractional variation of , . After a series of tests to check changes in deconvolution parameters with the number of iterations, we arbitrarily decided to stop when (or ; App. A). Under this criterion, the deconvolved PMDFs end up with significantly lower dispersions than the observed ones (Figs. 4 to 6 and Table 2), without significant added noise or artifacts (App. A). Besides, contrary to the observed PMDFs, the shape of the deconvolved ones is approximately Gaussian.
| Observed | Deconvolved | |||||||
| Region | N | |||||||
| (′) | (stars) | () | () | () | () | () | () | |
| (1) | (2) | (3) | (4) | (5) | (6) | (7) | (8) | (9) |
| NGC 1039 — Myr, kpc | ||||||||
| 0—20 | 204 | |||||||
| 5—20 | 160 | |||||||
| 0—5 | 44 | |||||||
| NGC 2477 — Myr, kpc | ||||||||
| 0—20 | 1030 | |||||||
| 0—20 | 205 | — | — | — | ||||
| 5—20 | 850 | |||||||
| 0—5 | 232 | |||||||
| 0—5 | 153 | — | — | — | ||||
| NGC 2516 — Myr, kpc | ||||||||
| 0—20 | 263 | |||||||
| 5—20 | 207 | |||||||
| 0—5 | 56 | |||||||
| NGC 2682 (UCAC3) — Gyr, kpc | ||||||||
| 0—20 | 333 | |||||||
| 5—20 | 194 | |||||||
| 0—5 | 129 | |||||||
| 0—5 | 9 | — | — | — | ||||
| NGC 2682 (optical) | ||||||||
| 0—15 | 752 | |||||||
| 0—15 | 113 | — | — | — | ||||
| 5—15 | 535 | |||||||
| 5—15 | 93 | — | — | — | ||||
| 0—5 | 217 | |||||||
| 0—5 | 20 | — | — | — | ||||
| NGC 7762 — Gyr, kpc | ||||||||
| 0—20 | 294 | |||||||
| 5—20 | 181 | |||||||
| 0—5 | 113 | |||||||
-
Col. 2: number of member stars in region. and derived from the fit . Conversion from to was based on the respective cluster distances (Table 1).
5 Discussion
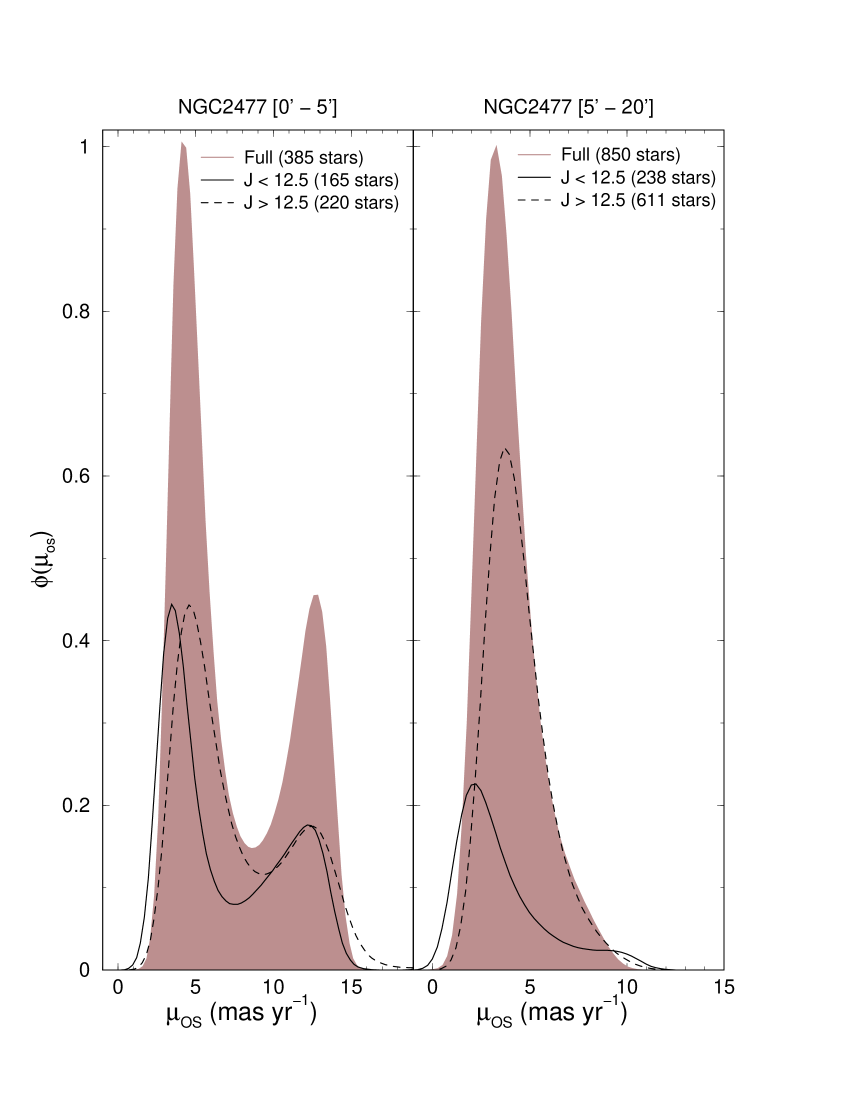
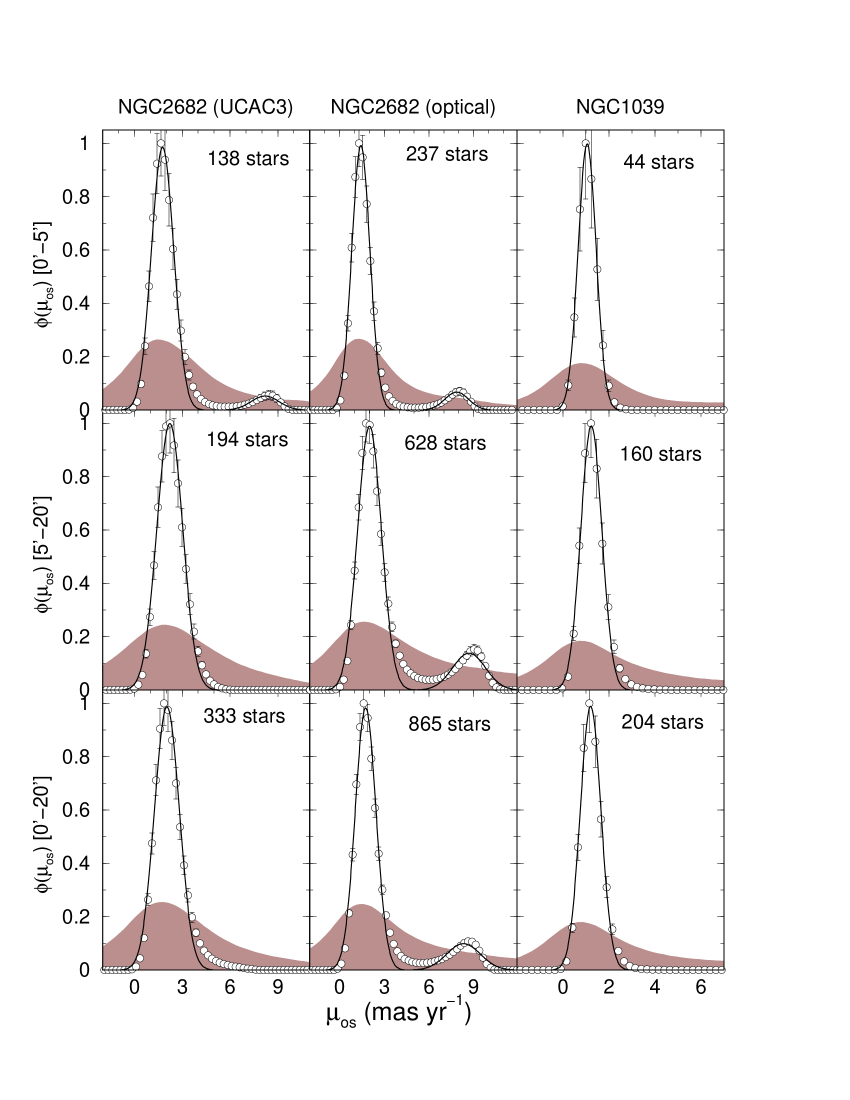
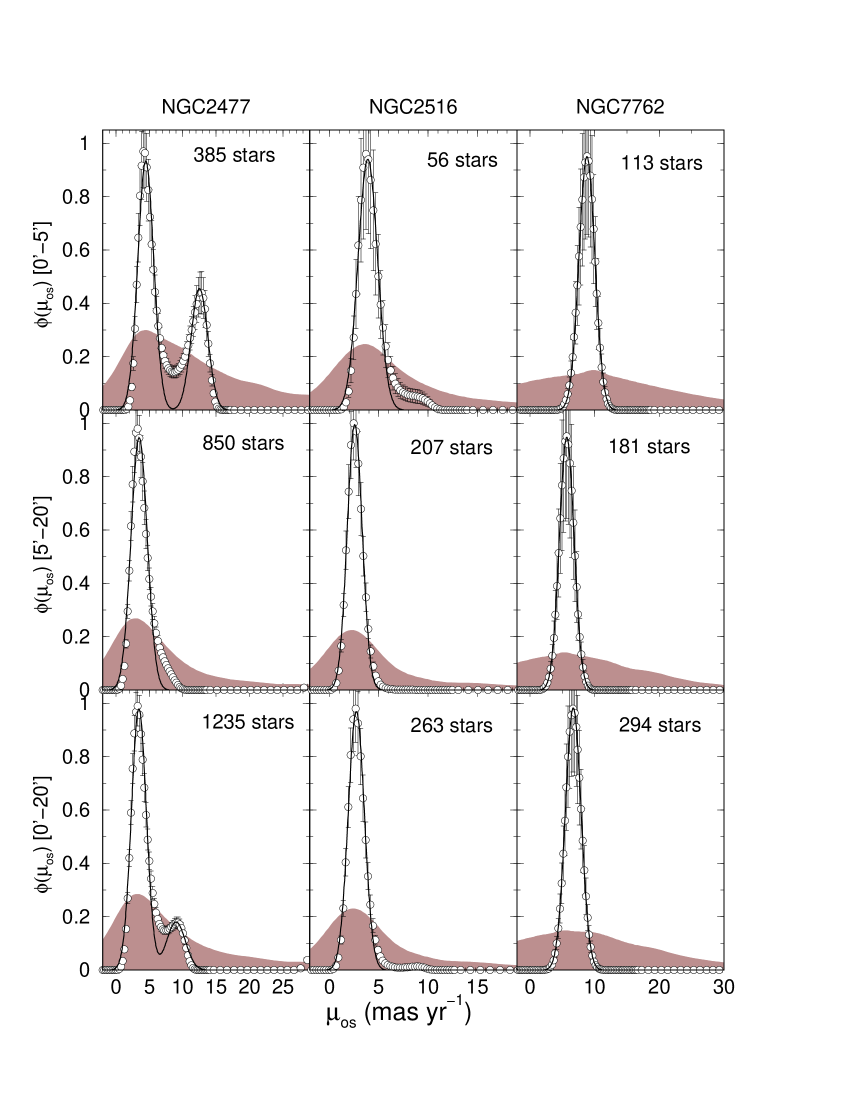
Similarly to NGC 2682 (Sect. 4), the RL deconvolution was applied to the field-subtracted PMDFs of the remaining OCs. Here we present the results of this procedure but, to avoid redundancy, we restrict the discussion to the on-sky PMDFs. However, besides the overall cluster, we also analyse separately the central and outer regions (according to the RDPs in Fig. 3), to search for spatial variations in the stellar kinematics that may be related to dynamical evolution. The deconvolved PMDFs are subsequently fitted with a Gaussian profile (), which provides the velocity dispersion () and the average velocity () of the stars in the region. The field-subtracted and deconvolved PMDFs are shown in Figs. 5 and 6, and the relevant profile parameters are given in Table 2. The observed, field, and error PMDFs for the full OC sample are shown in App. B.
It is clear that the deconvolved PMDFs (with dispersion ) are significantly narrower than the field-subtracted ones (). Indeed, we find , but this ratio should be taken as an upper limit, since the observed PMDFs are not Gaussian and the fit is dominated by the profile core.
The central and outer parts of NGC 1039, NGC 2516, and NGC 7762, have PMDFs essentially characterised by a single Gaussian. In some cases (NGC 2682, NGC 2477, and only marginally in NGC 2516) however, the observed PMDF has a wing towards high-PM values, which appears to be a signature of structure in the profile. This structure shows up in the deconvolved PMDFs as a second PM component, which is conspicuous especially in the central cluster region. The second component is characterised by a higher average velocity than the main one, but both have similar values of dispersion.
In the central parts of NGC 2477, the second component corresponds to about 40% of the member stars in the region. This fraction drops to when the overall cluster is considered. For NGC 2682, this component contains only of the stars in the central region. This fraction is consistently the same for the UCAC3 and optical data. However, in the outer parts of NGC 2682, the second component is only seen in the optical data. Possible reasons for the difference are: the optical PMDF corresponds to a smaller and somewhat more interior region (5′- 15′ as compared to 5′- 20′), and contains times as much stars as that of UCAC3. The bump appears only when the observed PMDF is clearly non-asymmetric with respect to the average velocity, thus displaying a broad wing towards high velocities, e.g. NGC 2477 and NGC 2682. On the other hand, there is no bump emerging from the essentially gaussian (observed) PMDFs of NGC 1039, NGC 2516, and NGC 7762 (Figs. 5 and 6). In addition, it is interesting to note that the bump in the central region of NGC 2682 appears almost identically in PMDFs built with independent data sets.
Another issue is to what degree incompleteness in crowded regions - and the more difficult measurement of PM components for faint stars - affect the PMDFs. Additionally, could the bump be related to incompleteness? We use NGC 2477, the most distant and populous OC of our sample (thus, the most prone to suffering from incompleteness) to examine this point (App. B.1). Since our analysis depends on the number of member stars (especially at the central region), we selected as the boundary between bright and faint stars. At the distance of NGC 2477, this boundary corresponds to a stellar mass of . The bright and faint deconvolved PMDFs built for the central region are similar (Fig. 11), consistently presenting the high-velocity bump at . The only significant difference is that the faint (less massive) star PMDF is shifted towards high values of with respect to that of the bright stars. A similar shift occurs for the bright and faint star PMDFs in the outer region (without the bump). Although relatively small, the shift between the bright and faint PMDFs might suggest slightly different kinematics for stars in different mass ranges. This experiment also suggests that incompleteness and PM measurements of faint stars - at least to the level available in UCAC3 - are not critical for the PMDFs.
Additionally, one might ask whether the bump may come from residual, i.e. unaccounted for field contamination. It is true that, given the statistical way we decontaminate the clusters (Sect. 3), some field-star contribution might persist in the subtracted PMDFs. However, both NGC 2477 and NGC 2782 are located in the third Galactic quadrant and at high Galactic latitudes, which by itself minimises contamination (as can also be seen in Figs. 9 and 10). Thus, any residual contamination should be minimum, which would contradict the fraction of stars composing the bump, in the central region of NGC 2477 and in NGC 2682. The above arguments suggest that the bump is related to a cluster kinematic property, but we cannot definitely rule out the possibility that it might be an artefact of the RL deconvolution, and/or some residual contamination by stars with peculiar PM components.
There is no direct interpretation for the additional bump seen in the deconvolved PMDFs of NGC 2477 and NGC 2682. Assuming that it is physical, one possibility is that the double peak may arise from a merger of two clusters (as suggested by the referee, Thijs Kouwenhoven). In this sense, de Oliveira, Bica & Dottori (2000) carried out N-body simulations of cluster encounters, studying long-term structural changes up to Gyr. They found that the clusters may coalesce at such ages, but until then, the presence of the two clusters can still be traced by means isophotal distortions and ellipticity variations, as observed in model and actual clusters (e.g. de Oliveira et al. 2000). In this scenario, internal differences in kinematics might persist too, producing different signatures in the deconvolved PMDFs.
Alternatively, the high-average velocity component may be related to mass segregation, in which a fraction of the stars collectively migrate along the radial direction (over a time-scale of a relaxation time) within a star cluster. In the cases dealt with here, it occurs only in the two most populous OCs, NGC 2477 and NGC 2682. Maybe it cannot be detected (by the present approach) in the other OCs because they are less populated (i.e., possibly the same reason why it is seen in the outer parts of NGC 2682 with the optical data, but not with UCAC3). Finally, working with histograms and a different PM-data set, Bica & Bonatto (2005) raised the possibility that the high-velocity component in NGC 2682 might be related to the presence of binaries. However, given the findings of Kouwenhoven & de Grijs (2008), this possibility seems the least probable. In any case, a definitive solution for the bump nature would require detailed simulations of the internal cluster dynamics (including cluster merger, mass segregation, and binarity), a task that is beyond the scope of the present paper.
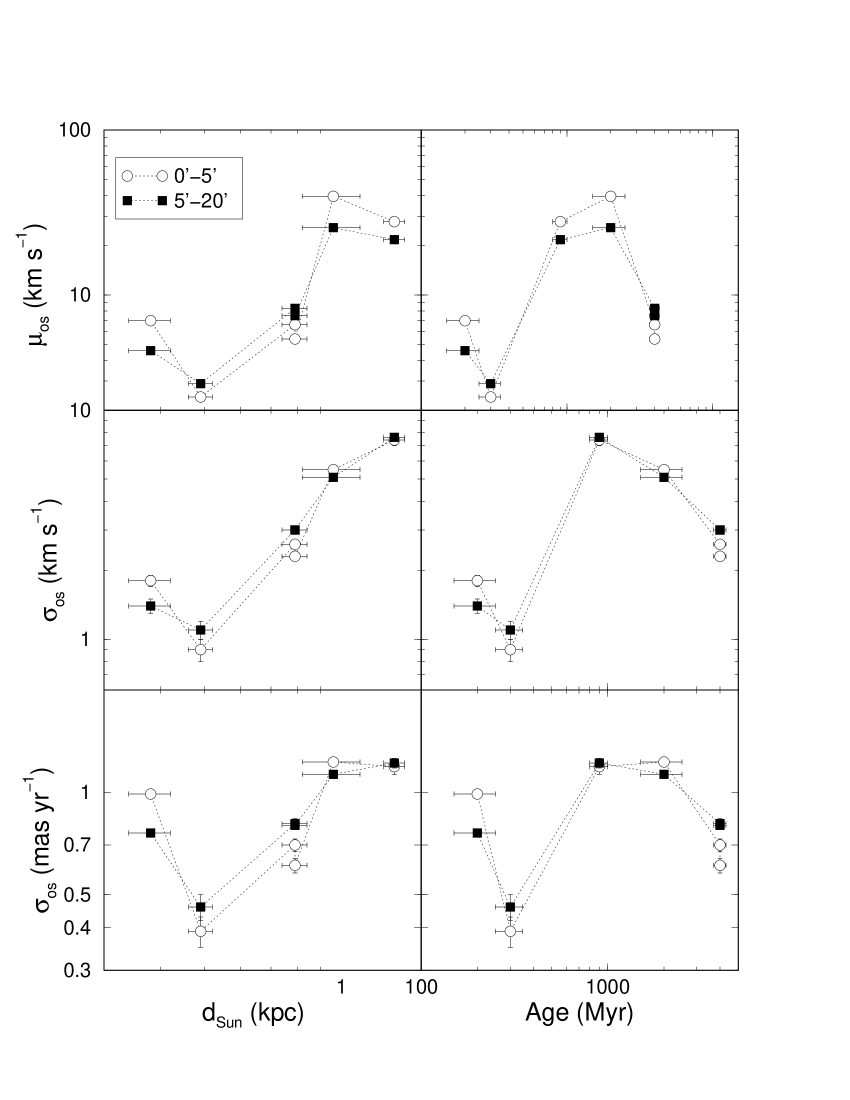
The velocity dispersions derived from the deconvolved PMDFs (Table 2) of NGC 1039 and NGC 2516 (and, to a lesser degree, NGC 2682), are consistent with those of (approximately virialized) OCs of . On the other hand, those of NGC 2516 and NGC 2477 appear to be excessively high for OCs of a similar mass scale. However, such large dispersion values can be partly explained by an observational limitation related to distance, since both OCs are the most distant of the sample. For a limited observational time-base, the PM determination for a distant OC will primarily detect the high-PM components, thus leading to a broad PM profile and high values of velocity dispersion. Under similar conditions, a nearby OC, on the other hand, will also have part of the low-PM components detected, thus implying a lower velocity dispersion. This effect is present in our analysis, as can be seen by the correlation between and distance from the Sun (Fig. 7 - left panels). An additional consequence of the distance-related effect would be a shift towards high values of the on-sky average velocity (). Again, this shift would increase with the distance from the Sun, and this relation is also present in Fig. 7. Despite this effect, the average velocity of the bump stars in NGC 2477 ( ) is exceedingly high for a cluster, to the point that these stars - if they really belong to NGC 2477 - are not gravitationally bound to the cluster. This suggests that the high-velocity bump may be an artefact produced by the RL deconvolution (when applied to asymmetric profiles) or, least probably, unaccounted for field contamination.
Given the above caveat, it is not possible to disentangle a physical relation between and cluster age (Fig. 7 - right panels) from the observational limitation.
6 Summary and conclusions
A crucial point in understanding a cluster’s dynamical stage is the derivation of kinematical parameters for its member stars, usually by means of proper motions obtained in public databases. However, uncertainties associated with ground-based proper motion measurements are usually large, and their effect should be properly taken into account when building PM profiles for determining the velocity dispersion.
In this paper we investigate the above issue using the relatively nearby and populous open clusters NGC 1039 (M 34), NGC 2477, NGC 2516, NGC 2682 (M 67), and NGC 7762 as test cases. Their PM components have been obtained in UCAC3.
Rather than working with PM histograms, we build PMDFs for the cluster and field stars, taking the -PM uncertainties into account. In short, (i) we use the CMD morphology for establishing the colour and magnitude ranges of the probable member stars, (ii) these stars are used to build the RDP, which provides the cluster structural parameters and allows to define the comparison field, (iii) we define a grid of PM bins of variable size that spans the full range of values of , , and , (iv) considering the cluster and field stars separately we compute the probability that the PM measurements of a given star corresponds to any bin, (v) the field-star PMDF is subtracted from the cluster PMDF and, (vi) we take the intrinsic PM-error distribution function as the PSF to be used in the Richardson-Lucy deconvolution approach.
The main result of our approach is that the deconvolved PMDFs are well represented by Gaussians with dispersions lower than the observed ones by a factor of 4-10. Besides the main component, the deconvolution revealed structure in the profiles of NGC 2477 and NGC 2682 in the form of a second - and less populous - distribution shifted towards higher average velocities, which may originate from cluster merger, large-scale mass segregation or, least probably, binaries. The secondary bump in NGC 2477 consistently appears in PMDFs built with stars brighter and fainter than , which suggests that it is not related to incompleteness and/or faint star-PM measurement. However, we cannot exclude the possibility that the bump is an artefact produced by the RL deconvolution when applied to strongly asymmetric profiles such as those of NGC 2477 and NGC 2682. NGC 1039 and NGC 2516, the nearest OCs analysed here, end up with deconvolved dispersions compatible with those expected of bound OCs of . We also detect an increase of the velocity dispersion and average velocity with distance from the Sun, which is probably due to a similarly limited time-base used for measuring the proper motions among different star clusters.
In recent years our group has given particular attention to the investigation of OCs by means of analytical tools that produce field-star decontaminated CMDs and RDPs. These tools have proved essential for a constrained analysis of OCs characterised by a range of parameters (age, distance from the Sun, reddening, etc), and located on a wide variety of environments (e.g. Bonatto & Bica 2010b; Bonatto & Bica 2007; Bonatto et al. 2006). The present paper links the classical CMD and RDP analyses with a novel approach for dealing with proper motions and the respective errors.
Acknowledgements
We thank the referee, Thijs Kouwenhoven, for interesting comments and suggestions. We acknowledge support from the Brazilian Institution CNPq. This publication makes use of data products from the Two Micron All Sky Survey, which is a joint project of the University of Massachusetts and the Infrared Processing and Analysis Centre/California Institute of Technology, funded by the National Aeronautics and Space Administration and the National Science Foundation. We also employed the WEBDA database, operated at the Institute for Astronomy of the University of Vienna.
References
- Bi & Boerner (1994) Bi H. & Boerner G. 1994, A&AS, 108, 409
- Bica & Bonatto (2005) Bica E. & Bonatto C. 2005, A&A, 431, 943
- Bonatto, Bica & Girardi (2004) Bonatto C., Bica E. & Girardi L. 2004, A&A, 415, 571
- Bonatto et al. (2006) Bonatto C., Bica E., Ortolani S. & Barbuy B. 2006, A&A, 453, 121
- Bonatto & Bica (2007) Bonatto C. & Bica E. 2007, MNRAS, 377, 1301
- Bonatto & Bica (2009b) Bonatto C. & Bica E. 2009b, MNRAS, 394, 2127
- Bonatto & Bica (2010a) Bonatto C. & Bica E. 2010a, A&A, 516, 81
- Bonatto & Bica (2010b) Bonatto C. & Bica E. 2010b, A&A, 521A, 74
- Chen, de Grijs & Zhao (2004) Chen L., de Grijs R. & Zhao J.L. 2007, AJ, 134, 1368
- Girardi et al. (2002) Girardi L., Bertelli G., Bressan A., Chiosi C., Groenewegen M.A.T., Marigo P., Salasnich B. & Weiss A. 2002, A&A, 391, 195
- Goodwin & Bastian (2006) Goodwin S.P. & Bastian N. 2006, MNRAS, 373, 752
- de Grijs et al. (2008) de Grijs R., Goodwin S.P., Kouwenhoven M.B.N. & Kroupa, P. 2008, A&A, 492, 685
- Kouwenhoven & de Grijs (2008) Kouwenhoven M.B.N. & de Grijs R. 2008, A&A, 480, 103
- Lada & Lada (2003) Lada C.J. & Lada E.A. 2003, ARA&A, 41, 57
- Lamers et al. (2005) Lamers H.J.G.L.M., Gieles M., Bastian N., Baumgardt H., Kharchenko N.V. & Portegies Zwart S. 2005, A&A, 441, 117
- Lucy (1974) Lucy L. 1974, AJ, 79, 745
- de Oliveira, Bica & Dottori (2000) de Oliveira M.R., Bica E. & Dottori H. 2000, MNRAS, 311, 589
- de Oliveira et al. (2000) de Oliveira M.R., Dutra C.M., Bica E. & Dottori H. 2000, A&AS, 146, 57
- Pavani & Bica (2007) Pavani D.B. & Bica E. 2007, A&A, 468, 139
- Piskunov et al. (2007) Piskunov A.E., Schilbach E., Kharchenko N.V., Röser S. & Scholz R.-D. 2007, A&A, 468, 151
- Richardson (1972) Richardson W.H. 1972, J.Opt.Soc.Am., 62, 55
- Richer et al. (2008) Richer H.B., Dotter A., Hurley J., Anderson J., King I., Davis S., Fahlman G.G., Hansen B.M.S. et al. 2008, AJ, 135, 2141
- Skrutskie et al. (2006) Skrutskie M.F., Cutri R., Stiening R., Weinberg M.D., Schneider S.E., Carpenter J.M., Beichman C., Capps R. et al. 2006, AJ, 131, 1163
- Spitzer (1987) Spitzer L. 1987, in Dynamical Evolution of Globular Clusters, Princeton, NJ, Princeton University Press, p. 191
- Vio, Bardsley & Wamsteker (2005) Vio R., Bardsley J. & Wamsteker W. 2005, A&A, 442, 397
- Yadav et al. (2008) Yadav R.K.S., Bedin L.R., Piotto G., Anderson J., Cassisi S., Villanova S., Platais I., Pasquini L. et al. 2008, A&A, 484, 609
- Zacharias et al. (2005) Zacharias N., Monet D.G., Levine S.E., Urban S.E., Gaume R. & Wycoff G.L. 2004, AAS, 205, 4815
- Zacharias et al. (2010) Zacharias N., Finch C., Girard T., Hambly N., Wycoff G., Zacharias M.I. , Castillo D., Corbin T. et al. 2010, AJ, 139, 2184
Appendix A Some aspects related to the RL deconvolution
A.1 PMDF resolution
For preserving the profile resolution especially around the PMDF peak (where the number density of stars is high) and, at the same time, keep acceptable error bars (especially towards the PMDF wings where the number density is low), we adopt a variable distribution of bin sizes , where represents any component among (, , ) for building the PMDFs.
After determining where the PMDF peak occurs, we use for shifts with respect to the peak in the range , for , for , and for and . Additionally, this procedure also has the advantage of reducing computation time.
A.2 Deconvolution convergence
The rather slow convergence rate of the RL deconvolution method has been extensively discussed in the literature (e.g. Bi & Boerner 1994; Vio, Bardsley & Wamsteker 2005). However, it is easy to implement, reliable, and the quality of the outputs can be followed at each iteration.

We follow in Fig. 8 the changes on and with the number of deconvolution iterations (). While the average velocity (panel b) changes little over the 200 iterations applied here, , on the other hand, decreases systematically with (panel a) but with a rate that begins to flatten for . Clearly, could decrease somewhat more for . However, as implied by the rate of change that, for has decreased to (panel c), it would take several hundred more iterations to produce a significant change in . Finally, the chi-square (Sect. 4) fractional variation also presents a steady decrease with (panel d), dropping to (or a variation) for .
Appendix B Observed and field PMDFs
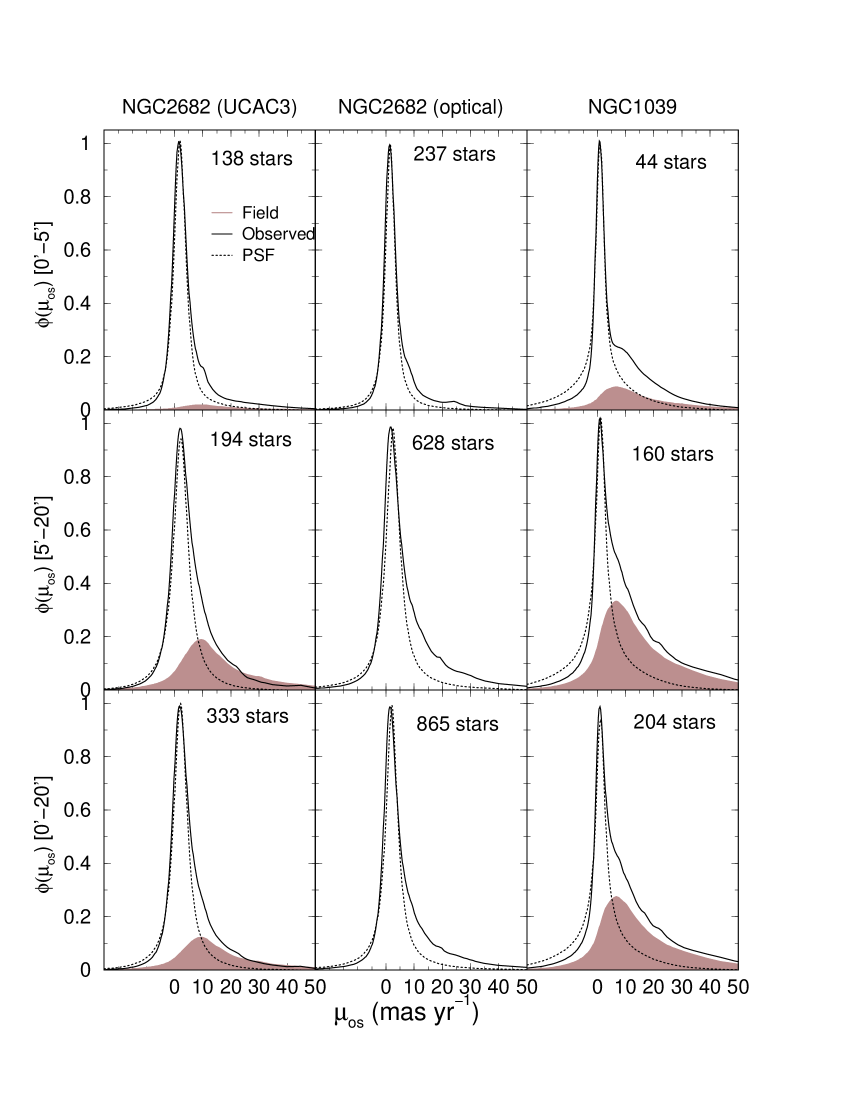
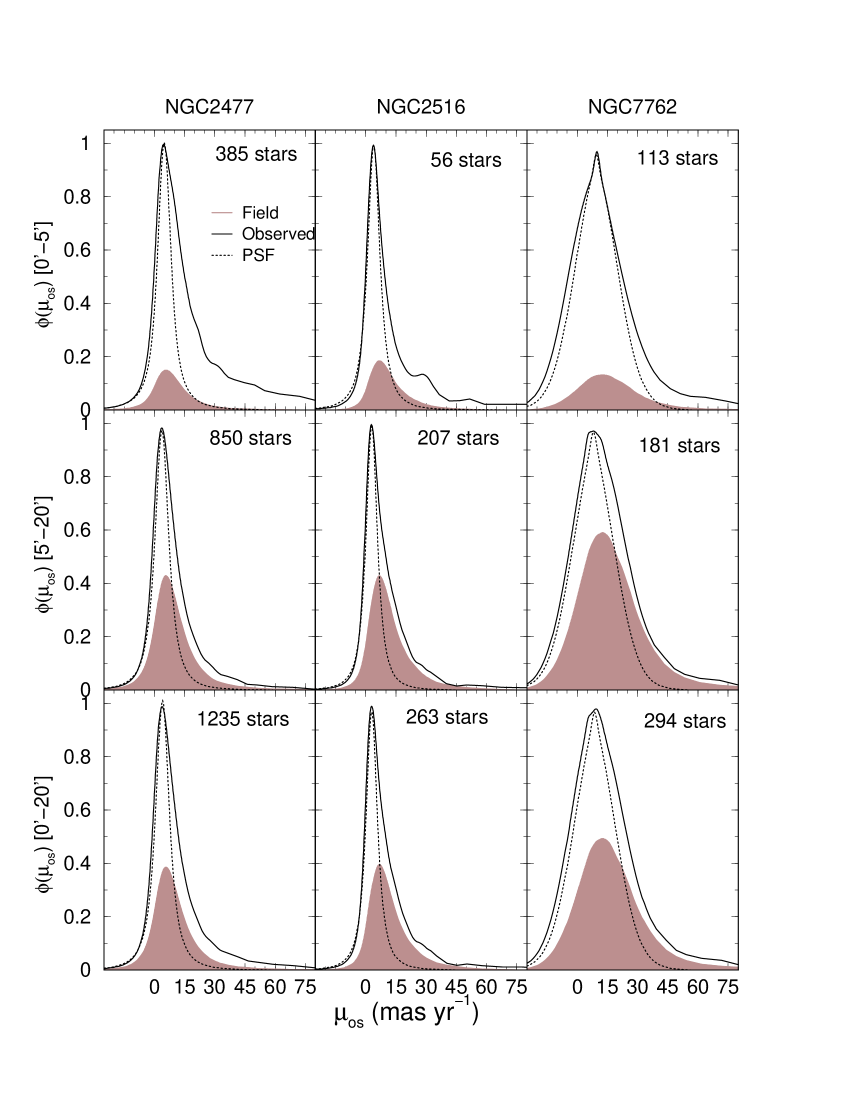
We show in Figs. 9 and 10 the observed on-sky PMDFs for all clusters of our sample, built for the central, outer, and overall cluster regions. Also shown are the PMDFs corresponding to the intrinsic error distribution (PSF) and the field. It is interesting to note the relative contribution of the field stars PM among the different regions of the same cluster and among the full set of clusters. This shows that the field contribution must be taken into account in the analysis. Also, and perhaps more importantly is the PSF width that, in some cases, is almost as broad as the cluster PMDF.
B.1 PMDFs in different magnitude ranges
In Fig. 11 we examine the incompleteness/faint stars issue in NGC 2477, which should be important especially for the central part of the cluster. Starting with the CMD of NGC 2477 (Fig. 2), we build PMDFs separately for stars brighter and fainter than . This magnitude boundary is adequate for characterising different types of stars and, at the same time, keeping a reasonable number of stars in each magnitude range. The bright and faint PMDFs are compared to the “full-magnitude” range PMDF, both for the central (left panel) and outer (right) cluster region.