Coherent Optical Spectroscopy of a Single Quantum Dot Via an Off-Resonant Cavity
Abstract
In recent experiments on coupled quantum dot (QD) optical cavity systems a pronounced interaction between the dot and the cavity has been observed even for detunings of many cavity linewidths. This interaction has been attributed to an incoherent phonon-mediated scattering process and is absent in atomic systems. Here, we demonstrate that despite its incoherent nature, this process preserves the signatures of coherent interaction between a QD and a strong driving laser, which may be observed via the optical emission from the off-resonant cavity. Under bichromatic driving of the QD, the cavity emission exhibits spectral features consistent with optical dressing of the QD transition. In addition to revealing new aspects of the off-resonant QD-cavity interaction, this result provides a new, simpler means of coherently probing QDs than traditional approaches and opens the possibility of employing off-resonant cavities to optically interface QD-nodes in quantum networks.
Optically controlled quantum dot (QD) spins coupled to semiconductor microcavities constitute a promising platform for robust and scalable quantum information processing devices, where QD spin nodes are optically interconnected via photonic circuits. As such, much effort in recent years has been dedicated to demonstrating fast optical control of a QD spin Press et al. (2008); Kim et al. (2010) and to studying QD- cavity quantum electrodynamics (CQED) phenomena Englund et al. (2007). The prospect of strongly enhanced light-matter interactions between a QD and an optical field has served as a focal impetus in integrating QDs with high quality factor (Q) optical cavities, with maximum enhancement occurring when the QD and the cavity are resonant and the QD is spatially aligned to the cavity mode. Since achieving this maximum enhancement is difficult due to limitations in growth and fabrication techniques, the recently observed coupling between a single QD and a detuned optical cavity mode Englund et al. (2010); Ates et al. (2009) has spurred considerable theoretical Hohenester (2010); Majumdar et al. (2011) and experimental interest in determining the physical mechanism behind such coupling as well as in possible applications. Though recent experiments have investigated the linewidth and saturation behavior of this off-resonant cavity emission Majumdar et al. (2010); Ulhaq et al. (2010), relatively little has been done to investigate the potential utility of such measurements in performing coherent optical spectroscopy of single QDs.
Here, we present both theoretical and experimental studies of a strongly-driven QD that is off-resonantly coupled to a photonic crystal (PC) cavity mode. In these studies, a strong narrow-bandwidth CW pump laser serves to dress the QD, while a weaker continuous wave (CW) probe laser is scanned across the QD resonance; the output signal is always collected at the spectrally detuned cavity (Fig. 1 a). We model the bichromatic driving of the QD coupled to an off-resonant cavity by adding an incoherent phonon-mediated coupling between the QD and the cavity and perform simulations with realistic system parameters. The bichromatic driving of a two-level system has been analyzed before Z. Ficek (1995). We use similar techniques to analyze the driving of a two-level system such as a QD, incoherently coupled to an off-resonant cavity via phonons Majumdar et al. (2011) (see Supplementary Material). In these simulations we neglect any coherent coupling between the QD and the cavity (i.e., the vacuum Rabi splitting ). Figure 1 c shows the theoretically calculated cavity output as a function of the probe laser wavelength for different powers of the resonant pump laser. At low pump power, we observe a simple Lorentzian line-shape with QD linewidth Majumdar et al. (2010). However, as the pump power is increased, the Lorentzian peak splits into two peaks, the separation between the peaks increasing linearly with pump Rabi frequency. We find that these two peaks are separated by times the Rabi frequency (see Supplementary material). As the pump power is increased further, a third peak corresponding to the central Mollow peak appears at the QD resonance, leading to the emergence of two dips whose separation also increases linearly with pump Rabi frequency. We note that the lack of a prominent central Mollow peak as observed in resonance fluorescence studies of single QDs Flagg et al. (2009); Vamivakas et al. (2009) is a result of the saturation of the QD absorption and, hence, of the cavity emission. As such, these cavity emission measurements are more akin to absorption measurements of a strongly driven QD Xu et al. (2007) rather than the aforementioned resonance fluorescence measurements Flagg et al. (2009); Vamivakas et al. (2009). Figure 1 d plots the cavity output for different detunings between the pump and the QD. We observe that the two peaks remain distinct but become asymmetric when the pump is detuned from the QD. This is consistent with the anti-crossing of the Rabi sidebands of the dressed QD that occurs as the pump is tuned through the QD resonance Xu et al. (2008). These theoretical results demonstrate that measurements of cavity emission allow for the observation of phenomena associated with the coherent optical driving of the QD.
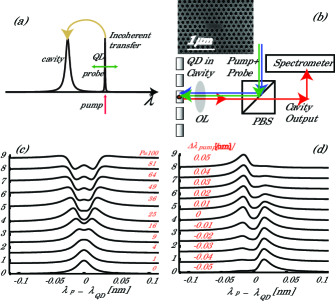
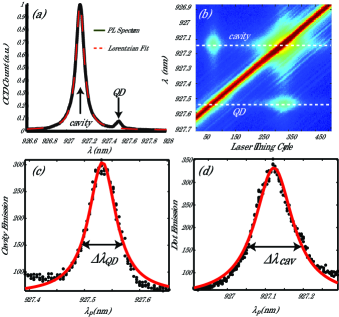
To demonstrate the use of such cavity emission to perform coherent optical spectroscopy of an off-resonantly coupled QD, we perform a series of experiments measuring the optical emission spectra of a system consisting of a single self-assembled InAs QD off-resonantly coupled to a linear three hole defect GaAs PC cavity under different optical excitation configurations in a helium-flow cryostat at cryogenic temperatures ( K) (Fig. 1 b) Englund et al. (2007). The nm GaAs membrane used to fabricate the photonic crystal is grown by molecular beam epitaxy on top of a GaAs wafer. A low density layer of InAs QDs is grown in the center of the membrane ( nm beneath the surface). The GaAs membrane sits on a nm sacrificial layer of Al0.8Ga0.2As. Under the sacrificial layer, a -period distributed Bragg reflector, consisting of a quarter-wave AlAs/GaAs stack, is used to increase collection into the objective lens. The photonic crystal was fabricated using electron beam lithography, dry plasma etching, and wet etching of the sacrificial layer in diluted hydrofluoric acid, as described previously Englund et al. (2007). Optical emission is collected and dispersed by a single grating monochromator and then measured by a liquid nitrogen cooled charge coupled device (CCD). We first characterize the coupled QD-cavity system by measuring the photoluminescence (PL) spectrum obtained under above-band excitation by an nm Ti:sapphire laser (Fig. 2 a). From the Lorentzian fit to the cavity resonance, we find that the cavity linewidth is nm, corresponding to a cavity field decay rate of GHz. We do not observe the anti-crossing of the cavity and QD peaks when the QD is tuned across the cavity resonance by changing temperature, indicating that the QD is not strongly coupled to the cavity. The QD resonance is at nm and the cavity resonance is at nm at K temperature leading to a dot-cavity detuning nm. When we scan a laser across the off-resonant QD-cavity system we observe cavity emission when the laser is resonant with the QD and QD emission when the laser is resonant with the cavity (Fig. 2 b). We can estimate the linewidth of the QD ( nm) and the cavity ( nm) by scanning the excitation laser across one resonance and observing emission at the other (Fig. 2 c and d). These measurements yield a broader cavity linewidth compared to that measured in standard PL measurements due to the heating of the structure caused by the resonant laser Majumdar et al. (2010). We now use this off-resonant cavity emission to probe the dressing of the QD by a strong resonant laser field.
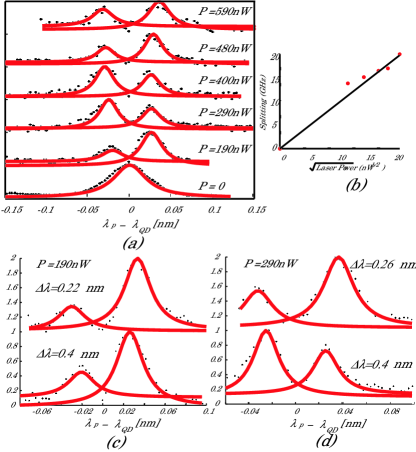
First, we experimentally investigate bi-chromatic driving of the off-resonantly coupled QD-cavity system under the same conditions as modeled in Fig. 1 a: a strong pump laser is used to resonantly drive the QD, while a weak probe laser is used to scan across the QD resonance. For these experiments, we utilize the spectral selectivity provided by the experimental setup to isolate the cavity emission and measure it as a function of the probe wavelength. A cross-polarized confocal microscopy setup is employed in this case (Fig. 1 b), although cross-polarization is not essential here as the QD and the cavity emission are co-polarized. Fig. 3 a shows the cavity emission intensity as a function of the probe laser wavelength . In the absence of the pump laser , we observe that the cavity emission spectrum possesses a Lorentzian line-shape. However, when a strong pump drives the QD, the Lorentzian splits into two peaks, as observed in the simulations in Fig. 1 c. However experimentally measured QD linewidths are broadened by spectral diffusion of the QD transition, which is not included in our theoretical model Kamada and Kutsuwa (2008). Hence, we fit a Lorentzian to each peak and study the splitting between two peaks as a function of the pump laser power. Fig. 3 b plots this splitting as a function of the square root of the laser power measured in front of the objective lens (OL). We observe that the splitting increases linearly with , the laser field amplitude. The splitting is given by times the laser Rabi frequency , where is the QD dipole moment. We note that in the results of Fig. 3 a, the peaks are are not symmetric, due to the fact that fixing the pump laser exactly to the QD resonance in experiments is made difficult by spectral drifts in both the QD resonance and the pump laser wavelength over time. For a detuned pump, the splitting is modified, and this causes a deviation of the Rabi frequencies from the linear relation as shown in Fig. 3 b. We also note that the high pump power regime of Fig. 1 c, which shows a central peak and two dips in the observed spectra, is difficult to observe in experiments due to the fact that the CCD also collects transmitted pump light. At higher powers, this transmitted pump light can saturate CCD pixels corresponding to wavelengths near the pump wavelength. This saturation can result in charge leakage across CCD pixels leading to a deterioration of the signal to noise ratio of cavity emission measurements. The use of improved spectral filtering techniques would reduce the amount of pump light collected, possibly enabling observation of this high power regime.
We estimate that the off-resonant cavity enhances the laser electric field inside cavity by a factor of , compared to the bare QD case, assuming a spot size of m and QD at the field maximum (see supplement). This agrees with the result shown in Fig. 3 c, where the cavity emission is plotted for two different QD-cavity detunings at the same pump power. The Rabi frequencies of the laser at a QD-cavity detuning of nm are measured to be and GHz at input powers of and nW, respectively. The Rabi frequencies increase to and GHz when the pump is closer to cavity ( are and nm, respectively). We theoretically estimate these Rabi frequencies to be and GHz, which are close to the experimentally measured values.
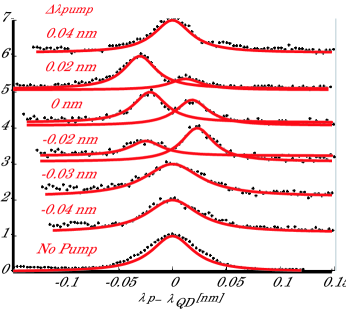
Finally, we study the effects of the detuning between the pump and the QD resonance on the off-resonant cavity emission. Fig. 4 shows the cavity emission as a function of probe laser wavelength for different pump laser-QD detunings . The pump laser power is kept fixed at nW. The detuning is changed from nm (blue detuned) to nm (red detuned). We observe that when the pump laser is far detuned from the QD resonance, the cavity emission shows a single peak with . As the pump is tuned closer to the cavity resonance, two peaks emerge in the spectrum, where the peaks are asymmetric when the pump is not exactly resonant with the QD. The fact that the peaks remain distinct as the pump is tuned through the QD resonance verifies experimental observation of the anti-crossing of the Rabi sidebands of the driven QD, consistent with the theory (Fig. 1 d).
In conclusion, we demonstrate that signatures of the coherent driving of a QD by a strong pump laser are preserved after phonon assisted scattering to an off-resonant cavity despite the fact that this scattering process is incoherent. In addition to revealing new aspects of the off-resonant QD-cavity interaction, this result is also potentially useful for enabling simpler coherent optical spectroscopy of a QD, as the readout signal is offset in frequency and can be spectrally filtered using well-established techniques. Moreover, this approach may relax the requirement of working exclusively with strongly coupled QD-cavity systems in quantum networks.
I Supplementary
II Estimation of electric field enhancement:
We consider a Gaussian laser beam with power and frequency incident on a photonic crystal cavity. The power is measured in front of the objective lens and the coupling efficiency of the laser to the cavity is . If the cavity quality factor is , with cavity resonance frequency and linewidth , the energy inside the cavity (for a laser resonant to the cavity) is . For an off-resonant cavity, where the laser is detuned from the cavity by , the previous expression for energy is multiplied by a Lorentzian:
| (1) |
where with being the resonance frequency of the cavity. The energy in the cavity can also be expressed as , where is the permittivity of the medium, and is the electric field at the point of maximum electric energy density, and is the cavity mode volume. Equating the two expressions of energy, we can write
| (2) |
Using
| (3) |
where is the velocity of light and is the resonance wavelength of the cavity, we can find that :
| (4) |
If the quantum dot is not located at the point of the maximum electric field energy density, the electric field at its location will be smaller than (and the spatial variation of the E-field is determined by the mode pattern ). Therefore, the electric field at the location of the QD would be
| (5) |
On the other hand, when there is no cavity present, the intensity of the light (assuming a Gaussian beam) incident on the GaAs is given by
| (6) |
where is the Gaussian beam radius of the laser. Also the intensity of the laser is given by
| (7) |
Equating these two, the electric field is found to be
| (8) |
Assuming normal incidence on the air-GaAs interface
| (9) |
where is the refractive index of GaAs. We note that the effect of the reflection in the interface, is embedded in for the analysis done for the cavity. From the above discussion, the electric field sensed by the QD in the absence of the cavity has the form
| (10) |
Comparing the cavity and no-cavity case, we can find that the electric field enhancement is given by
| (11) |
When the laser is resonant with the cavity, the maximum field enhancement for a linear three hole defect () cavity is , assuming , , nm, m, , and the QD at the field maximum, i.e., . For a detuning of linewidths (as is true for our experiment), the maximum enhancement is . We note that this maximum enhancement can be increased by using a better quality factor cavity, or lower mode volume. Another way to increase the enhancement is increasing the coupling efficiency by using a waveguide or a fiber coupled to the cavity.
III Estimation of the QD Dipole Moment
The data of Fig. a, b allows for order of magnitude estimation of system parameters such as QD dipole moment and effective QD electric field. Assuming a coupling efficiency of the Gaussian laser beam to the PC cavity mode , we can estimate the maximum laser field amplitude at the position of the QD using the Eqn. 4. From the linear fit in Fig. b, we estimate the dipole moment of the QD to be be on the order of Debye, with as obtained previously with the same grating coupled cavity design Toishi et al. (2009). For this dipole moment, the maximum QD-cavity interaction strength should be GHz, assuming the QD is located at the electric field maximum, thereby leading to the strong coupling. As mentioned previously, we did not observe the anti-crossing of the QD and cavity peaks in PL and thus believe that the actual value of is smaller than this calculated value most likely because the QD is not located at the cavity electric field maximum.
IV Theory of Bichromatic Driving
In the theoretical description of our experiment, we calculate the emission spectrum of the cavity under bichromatic driving of an off resonantly coupled QD and measure how the intensity of the cavity emission changes as a function of the probe laser detuning. The bichromatic driving of a two-level system has been analyzed before Z. Ficek (1995). We use similar techniques to analyze the driving of a two-level system such as a QD, coupled to an off-resonant cavity. The dynamics of a driven QD-cavity system is given by the Jaynes-Cummings Hamiltonian:
| (12) |
where and are, respectively, the cavity and the dot resonance frequency; and are, respectively, the annihilation operator for a cavity photon and the lowering operator for the QD; is the coherent interaction strength between the QD and the cavity and is the Rabi frequency of the driving laser. For bichromatic driving, the driving field consists of a strong pump laser with Rabi frequency tuned to the QD frequency and a weak probe laser with Rabi frequency , which can be tuned to arbitrary frequency, parameterized by the pump-probe detuning :
| (13) |
In a frame rotating with the pump laser frequency the Hamiltonian is
| (14) |
where is the QD-cavity detuning. We note that for a bichromatic driving, the Hamiltonian is always time-dependent. To treat incoherent processes we use the master equation Gardiner and Zoller (2005):
where is the Lindblad term associated with the collapse operator . The first two terms represent QD spontaneous emission with a rate , and cavity decay with a rate . The two terms with represent a phonon mediated coupling between the cavity and the QD Majumdar et al. (2011). The last term with phenomenologically describes pure dephasing of the QD. We numerically calculate the emission spectrum of the cavity given by the Fourier transform of the two-time correlation function of the cavity field, proportional to . Under the quantum regression theorem the auto-correlation function is equal to tr where obeys the master equation with initial condition . The time dependence of the Hamiltonian is such that the master equation can be cast in terms of Liouvillian superoperators as
| (15) |
where
This equation is solved by Floquet theory, by assuming a solution of the form . The number of terms in the expansion necessary to obtain any level of precision is determined by the relative strength of to , and in this way the problem can be considered perturbative in the probe strength. After Laplace transforming the master equation, the method of continued fractions is used to obtain the resonance fluorescence spectrum of the cavity Tan (1999). The height of the peak at the cavity resonance is calculated as a function of the probe detuning . The criterion for the appearance of dressed states is that the pump Rabi frequency should be higher than the QD linewidth . The inclusion of incoherent terms and effectively broadens the dot and alters this condition, but below a certain critical value of the change in the cavity height with probe detuning is a simple Lorentzian with a linewidth on the order of the natural QD linewidth. Above threshold, the dressed states are resolvable and cavity height spectrum splits into two peaks in the experimental regime we considered. Broadening of the peaks in the experiment beyond theoretical prediction is caused by the spectral diffusion of the QD. The parameters used for the simulations are: GHz, GHz, GHz, GHz, , . For the simulation reported here we assume , as the QD is not strongly coupled to the cavity. Increasing makes the two peaks more asymmetric.
V Numerical Simulation: Dependence of the splitting on pump power
We show in the paper that we can probe the coherent interaction between the QD and the resonant laser by monitoring the off-resonant cavity emission (Fig. c in the paper). Both theoretically and experimentally we observe two peaks at lower pump powers. At higher pump power, we theoretically observe two dips. In our experiment, however, we cannot reach this regime of high pump power.
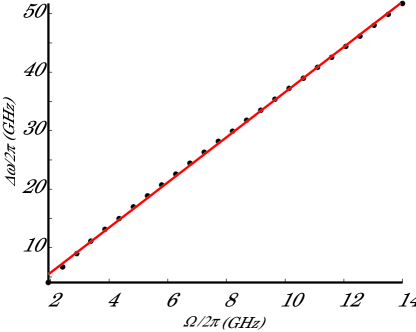
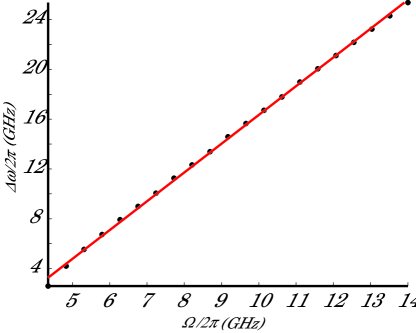
The separation between the peaks and dips increases linearly with the pump Rabi frequency. However, from the theoretical plot, we find that the peaks are separated by times the laser Rabi frequency (Fig. 5)and the dips are separated by twice the laser Rabi frequency (Fig. 6). More detailed theoretical derivation will be provided in Papageorge et al. (2011).
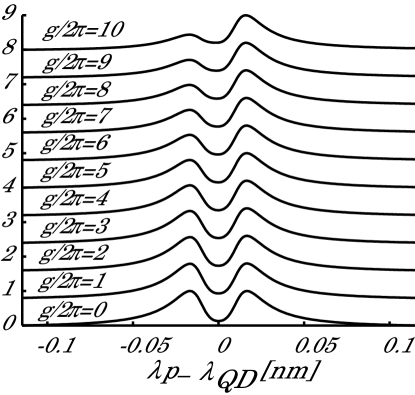
VI Numerical Simulation: effect of
In the numerical simulation results presented in the paper, we assumed , i.e., no coherent interaction is present between the QD and the cavity. Inclusion of makes the two peaks asymmetric. Fig. 7 shows the cavity emission for a pump power of , with ranging from to . Here the cavity is at a shorter wavelength compared to the QD, and we observe that the peak closer to cavity is not enhanced. This observation is starkly different from the resonance fluorescence measurement, where the peak close to the cavity is enhanced, as observed in Majumdar et al. (2011); Roy et al. (2011). This indicates again, that this way of measuring the coherent interaction between the QD and the laser is akin to an absorption measurement.
The authors acknowledge financial support provided by the Army Research Office, Office of Naval Research and National Science Foundation. A.M. was supported by the Stanford Graduate Fellowship (Texas Instruments fellowship). E.K. was supported by the Intelligence Community (IC) Postdoctoral Research Fellowship.
References
- Press et al. (2008) D. Press et al., Nature 456, 218 (2008).
- Kim et al. (2010) E. D. Kim et al., Phys. Rev. Lett. 104, 167401 (2010).
- Englund et al. (2007) D. Englund et al., Nature 450, 857 (2007).
- Englund et al. (2010) D. Englund et al., Phys. Rev. Lett. 104, 073904 (2010).
- Ates et al. (2009) S. Ates et al., Nature Photonics 3, 724 (2009).
- Hohenester (2010) U. Hohenester, Phys. Rev. B 81, 155303 (2010).
- Majumdar et al. (2011) A. Majumdar et al., arXiv:1012.3125 (2011).
- Majumdar et al. (2010) A. Majumdar et al., Phys. Rev. B 82, 045306 (2010).
- Ulhaq et al. (2010) A. Ulhaq et al., Phys. Rev. B 82, 045307 (2010).
- Z. Ficek (1995) H. F. Z. Ficek, Phys. Rev. A 53, 4275 (1995).
- Flagg et al. (2009) E. B. Flagg et al., Nature Physics 5, 203 (2009).
- Vamivakas et al. (2009) A. N. Vamivakas et al., Nature Physics 5, 198 (2009).
- Xu et al. (2007) X. Xu et al., Science 317, 929 (2007).
- Xu et al. (2008) X. Xu et al., Phys. Rev. Lett. 101, 227401 (2008).
- Kamada and Kutsuwa (2008) H. Kamada and T. Kutsuwa, Phys. Rev. B 78, 155324 (2008).
- Toishi et al. (2009) M. Toishi et al., Opt. Express 17, 14618 (2009).
- Gardiner and Zoller (2005) C. W. Gardiner and P. Zoller, Quantum Noise (Springer-Verlag, 2005).
- Tan (1999) S. M. Tan, Journal of Optics B: Quantum and Semiclassical Optics 1, 424 (1999).
- Papageorge et al. (2011) A. Papageorge et al., in preparation (2011).
- Roy et al. (2011) C. Roy et al., arXiv:1102.0254v1 (2011).